Chapter 12—Hypothesis Tests Applied to
Means: One Sample
MULTIPLE CHOICE QUESTIONS
12.1+ In one-sample tests of means we
12.2 I want to test the hypothesis that children who experience daycare before the age
of 3 do better in school than those who do not experience daycare. I have just
described the
12.3+ When we are using a two-tailed hypothesis test, the null hypothesis is of the form
12.4 When we are using a two-tailed hypothesis test, the alternative hypothesis is of
the form
12.5 The sampling distribution of the mean is
12.6+ Which of the following is NOT part of the Central Limit Theorem?
Test Bank
12.7 If the population from which we sample is normal, the sampling distribution of
the mean
12.8 With large samples and a small population variance, the sample means usually
12.9+ If we knew the population mean and variance, we would expect
12.10 The standard error of the mean is
12.11 The standard error of the mean is a function of
12.12 If the population from which we draw samples is “rectangular,” then the sampling
distribution of the mean will be
12.13 It makes a difference whether or not we know the population variance because
Chapter 12
303
12.14+ Suppose that we know that the sample mean is 18 and the population standard
deviation is 3. We want to test the null hypothesis that the population mean is 20.
In this situation we would
12.15+ If the standard deviation of the population is 15 and we repeatedly draw samples
of 25 observations each, the resulting sample means will have a standard error of
12.16 Many textbooks (though not this one) advocate testing the mean of a sample
against a hypothesized population mean by using z even if the population standard
deviation is not known, so long as the sample size exceeds 30. Those books
recommend this because
12.17 When you are using a one-sample t test, the degrees of freedom are
12.18 In using a z test for testing a sample mean against a hypothesized population
mean, the formula for z is
Test Bank
304
12.19 An assumption behind the use of a one-sample t test is that
12.20 The importance of the underlying assumption of normality behind a one-sample
means test
12.21 The reason why we need to solve for t instead of z in some situations relates to
12.22+ The variance of an individual sample is more likely than not to be
12.23 The sampling distribution of the variance is
12.24+ For a t test with one sample we
12.25+ With a one-sample t test, the value of t is
Chapter 12
305
12.26+ If we have run a t test with 35 observations and have found a t of 3.60, which is
significant at the .05 level, we would write
12.27 Which of the following does NOT directly affect the magnitude of t?
12.28 If we compute 95% confidence limits on the mean as 112.5 – 118.4, we can
conclude that
12.29 When we take a single sample mean as an estimate of the value of a population
mean, we have
12.30 A 95% confidence interval is going to be _______ a 99% confidence interval.
12.31+ If we have calculated a confidence interval and we find that it does NOT include
the population mean,
Test Bank
306
12.32 The two-tailed p value that a statistical program produces refers to
12.33 If we fail to reject the null hypothesis in a t test we can conclude
12.34+ Which of the following statistics comparing a sample mean to a population mean
is most likely to be significant if you used a two-tailed test?
12.35+ All of the following increase the magnitude of the t statistic and/or the likelihood
of rejecting H0 EXCEPT
12.36 A one-sample t test was used to see if a college ski team skied faster than the
population of skiers at a popular ski resort. The resulting statistic was t.05(23) = –
7.13, p < .05. What should we conclude?
12.37 Which of the following statements is true?
Chapter 12
12.38 A t test is most often used to
12.39 When are we most likely to expect larger differences between group means?
12.40+ Cohen’s
ˆ
d
is an example of
12.41+ The point of calculating effect size measures is to
12.42 When you have a single sample and want to compute an effect size measure, the
most appropriate denominator is
12.43 When would you NOT use a standardized measure of effect size?
12.44 A confidence interval computed for the mean of a single sample
Test Bank
308
12.45 If we compute a confidence interval as 12.65 ≤ ≤ 25.65, then we can conclude
that
12.46 The t distribution
12.47 The confidence intervals for two separate samples would be expected to differ
because
12.48+ The term “effect size” refers to
TRUE/FALSE QUESTIONS
increases, the distribution will approach the normal distribution.
sample.
12.52 [TRUE] The standard deviation of a sampling distribution is known as the
standard error.
appropriate to test a sample mean.
unknown.
larger than the corresponding z because it is based on estimated variance, which is
biased.

Chapter 12
309
mean, the degrees of freedom are 31.
12.58 [TRUE] The larger the difference between the sample mean and the population
mean, the larger the t value.
TEST QUESTIONS
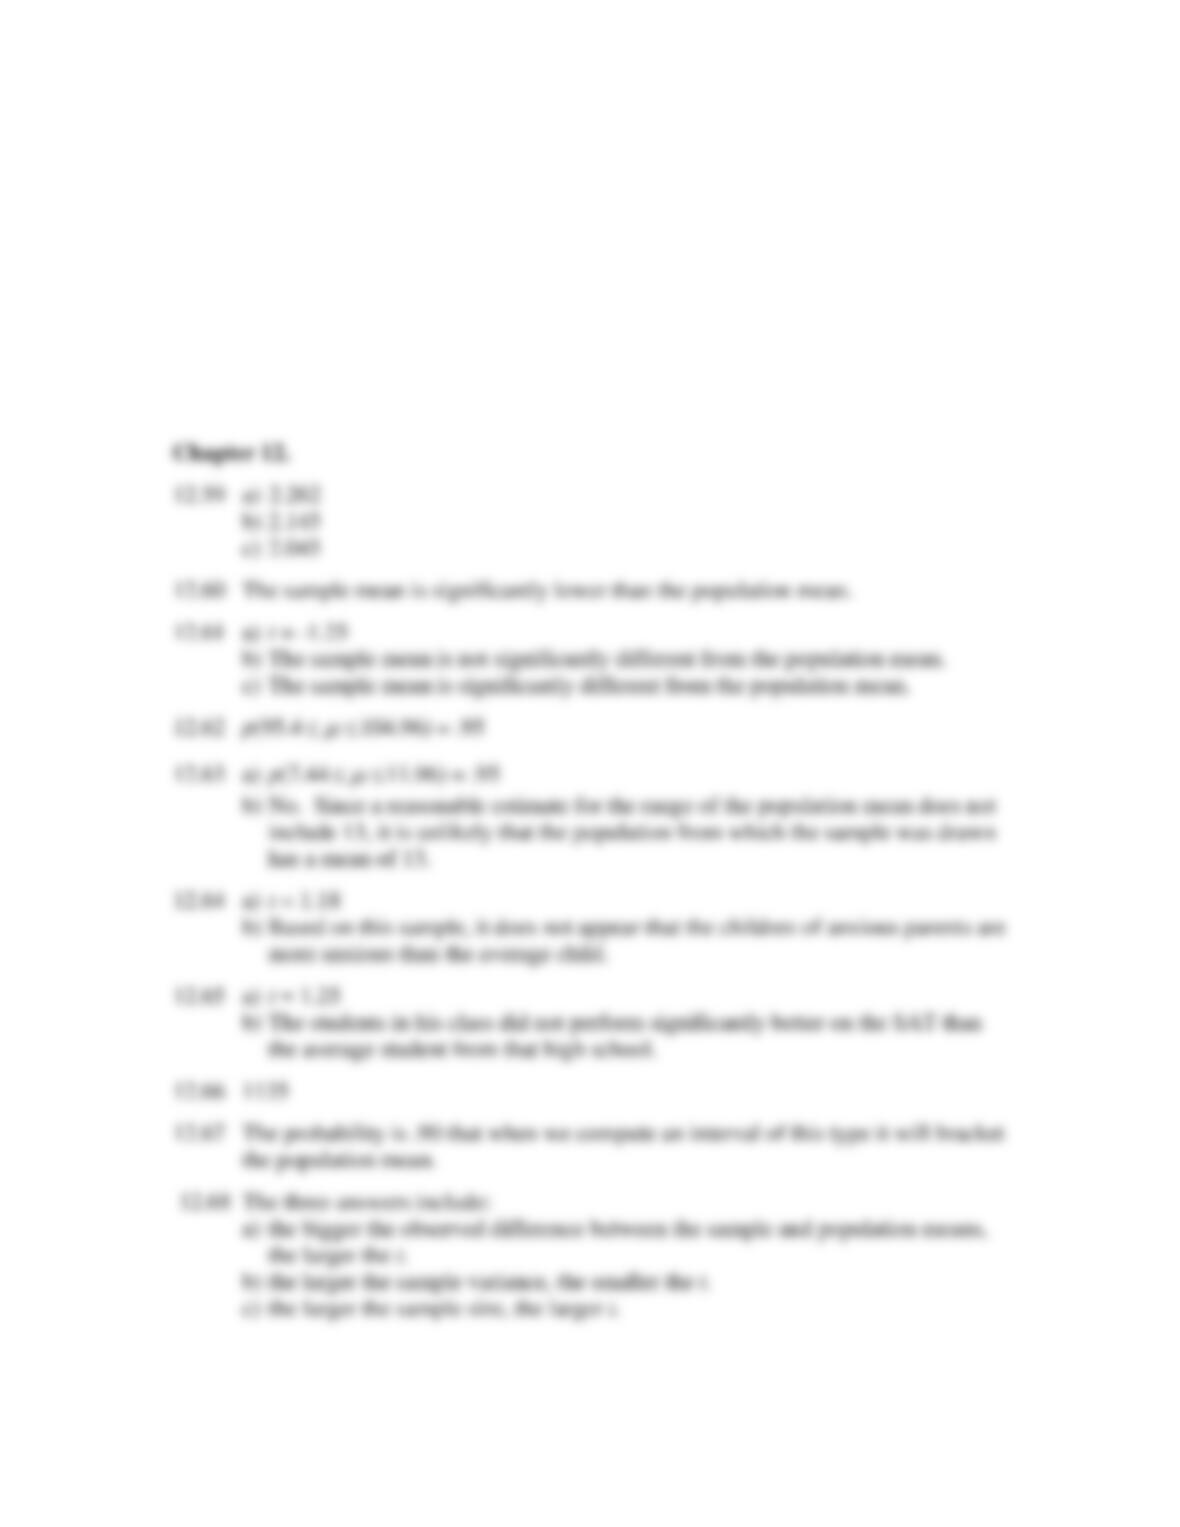
12.59 Assuming a two-tailed one sample test is being used, what are the critical values
for t given the following sample sizes:
a) N = 10
b) N = 15
c) N = 30
12.60 Given a sample size of 30, and one sample t = -2.5, what would you conclude
about the sample from which the mean was drawn?
12.61 Given = 100,
,91=X
s = 27, and N = 30:
a) Calculate t.
b) Write a sentence interpreting the value of t as a two-tailed test.
c) Write a sentence interpreting the value of t as a one-tailed test.
12.62 Calculate the 95% confidence interval for given
,100=X
s = 25, and N = 101.
12.63 The following 10 numbers were drawn from a population.
5 7 7 10 10 10 11 12 12 13
a) Calculate the 95% confidence interval for the population mean.
b) Is it likely that these numbers came from a population with a mean of 13?
Explain.
12.64 The mean anxiety score in elementary school children is 14.55. A researcher
wants to know if children of anxious parents are more anxious than the average
child. Below are the anxiety scores from 10 children of anxious parents.
13 14 14 15 15 15 16 17 17 18
a) Calculate the t value.
b) Write a sentence to answer the researcher’s question.
12.65 The average SAT score for a local high school was 1100. One teacher is
convinced that the 25 students who were in his homeroom performed better than
the average student in the high school. Their average score was 1125 with a
standard deviation of 100.
a) Calculate t.
b) Evaluate the teacher’s “hypothesis” in light of t.
Test Bank
310
12.66 In the previous question, what would be the minimum mean score of the teacher’s
students that would yield a statistically significant difference using a one-tailed
test?
12.67 Explain the following statement: p (100
110) = .90.
12.68 Briefly describe two factors that affect the magnitude of t.
Answers to Open-ended Questions