Unlock document.
This document is partially blurred.
Unlock all pages and 1 million more documents.
Get Access
The Design of the Tax System 3111
48. Which of the following statements is correct?
a. Vertical equity is the idea that taxpayers with similar abilities to pay taxes should pay the same
amount.
b. Horizontal equity is the idea that taxes should be levied on a person according to how well that
person can shoulder the burden.
c. A regressive tax would mean that high-income tax payers pay a larger fraction of their income
in taxes than would low-income taxpayers.
d. A proportional tax would mean that high-income and low-income taxpayers pay the same
fraction of income in taxes.
49. When the marginal tax rate equals the average tax rate, the tax is
a. proportional.
b. progressive.
c. regressive.
d. egalitarian.

3112 The Design of the Tax System
50. A country is using a proportional tax when
a. its marginal tax rate equals its average tax rate.
b. its marginal tax rate is less than its average tax rate.
c. its marginal tax rate is greater than its average tax rate.
d. it uses a lump-sum tax.
51. Which tax system requires higher-income taxpayers to have lower tax rates, even though they
pay a larger amount of tax when compared to lower-income taxpayers?
a. a proportional tax
b. a progressive tax
c. a regressive tax
d. a lump-sum tax
The Design of the Tax System 3113
52. If a tax takes a smaller fraction of income as income rises, it is
a. proportional.
b. regressive.
c. progressive.
d. based on the ability-to-pay principle.
53. Which of the following statements is correct?
a. A general sales tax on food is regressive when low-income taxpayers spend a larger proportion
of their income on food than high-income taxpayers.
b. A general sales tax on food is regressive when middle income taxpayers spend a smaller
proportion of their income on food than high-income taxpayers.
c. A general sales tax on food is regressive when high-income taxpayers spend a larger proportion
of their income on food than middle income taxpayers.
d. A general sales tax on food is regressive when high-income taxpayers spend a larger proportion
of their income on food than low-income taxpayers.
3114 The Design of the Tax System
54. Which tax system requires higher-income taxpayers to pay a higher percentage of their income in
taxes?
a. a progressive tax
b. a proportional tax
c. a regressive tax
d. a lump-sum tax
55. You are trying to design a tax system that will simultaneously achieve both of the following goals:
1) two people with the same total income would pay taxes of the same amount, and 2) a high-
income person would pay a higher fraction of income in taxes than a low-income person. Which
of the following tax systems could achieve both goals?
a. a lump-sum tax
b. a regressive tax
c. a progressive tax
d. a proportional tax
The Design of the Tax System 3115
56. You are trying to design a tax system that will simultaneously achieve both of the following goals:
1) a person with no income would pay no taxes, and 2) a high-income person would pay a higher
fraction of income in taxes than a low-income person. Which of the following statements is
correct?
a. A lump-sum tax would achieve the second goal but not the first.
b. A regressive tax would achieve the second goal but not the first.
c. A progressive tax could achieve both goals.
d. A proportional tax could achieve the second goal but not the first.
57. When the marginal tax rate exceeds the average tax rate, the tax is
a. proportional.
b. regressive.
c. non-egalitarian.
d. progressive.
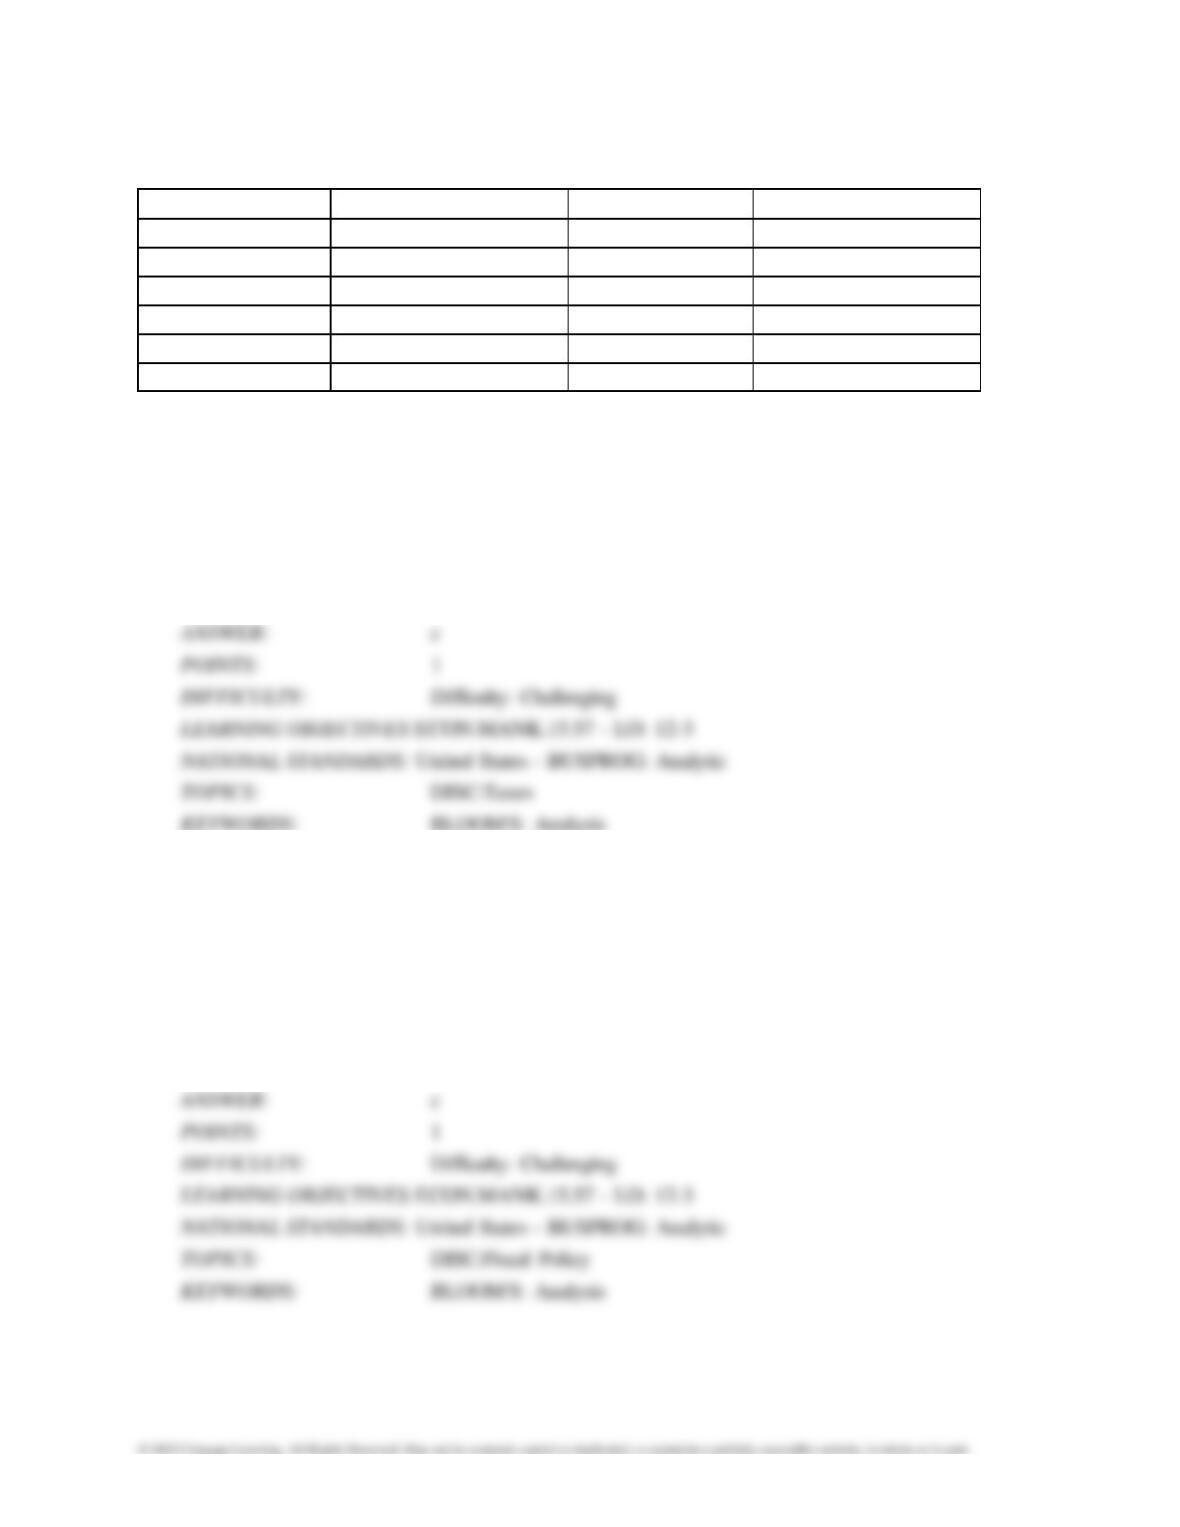
3116 The Design of the Tax System
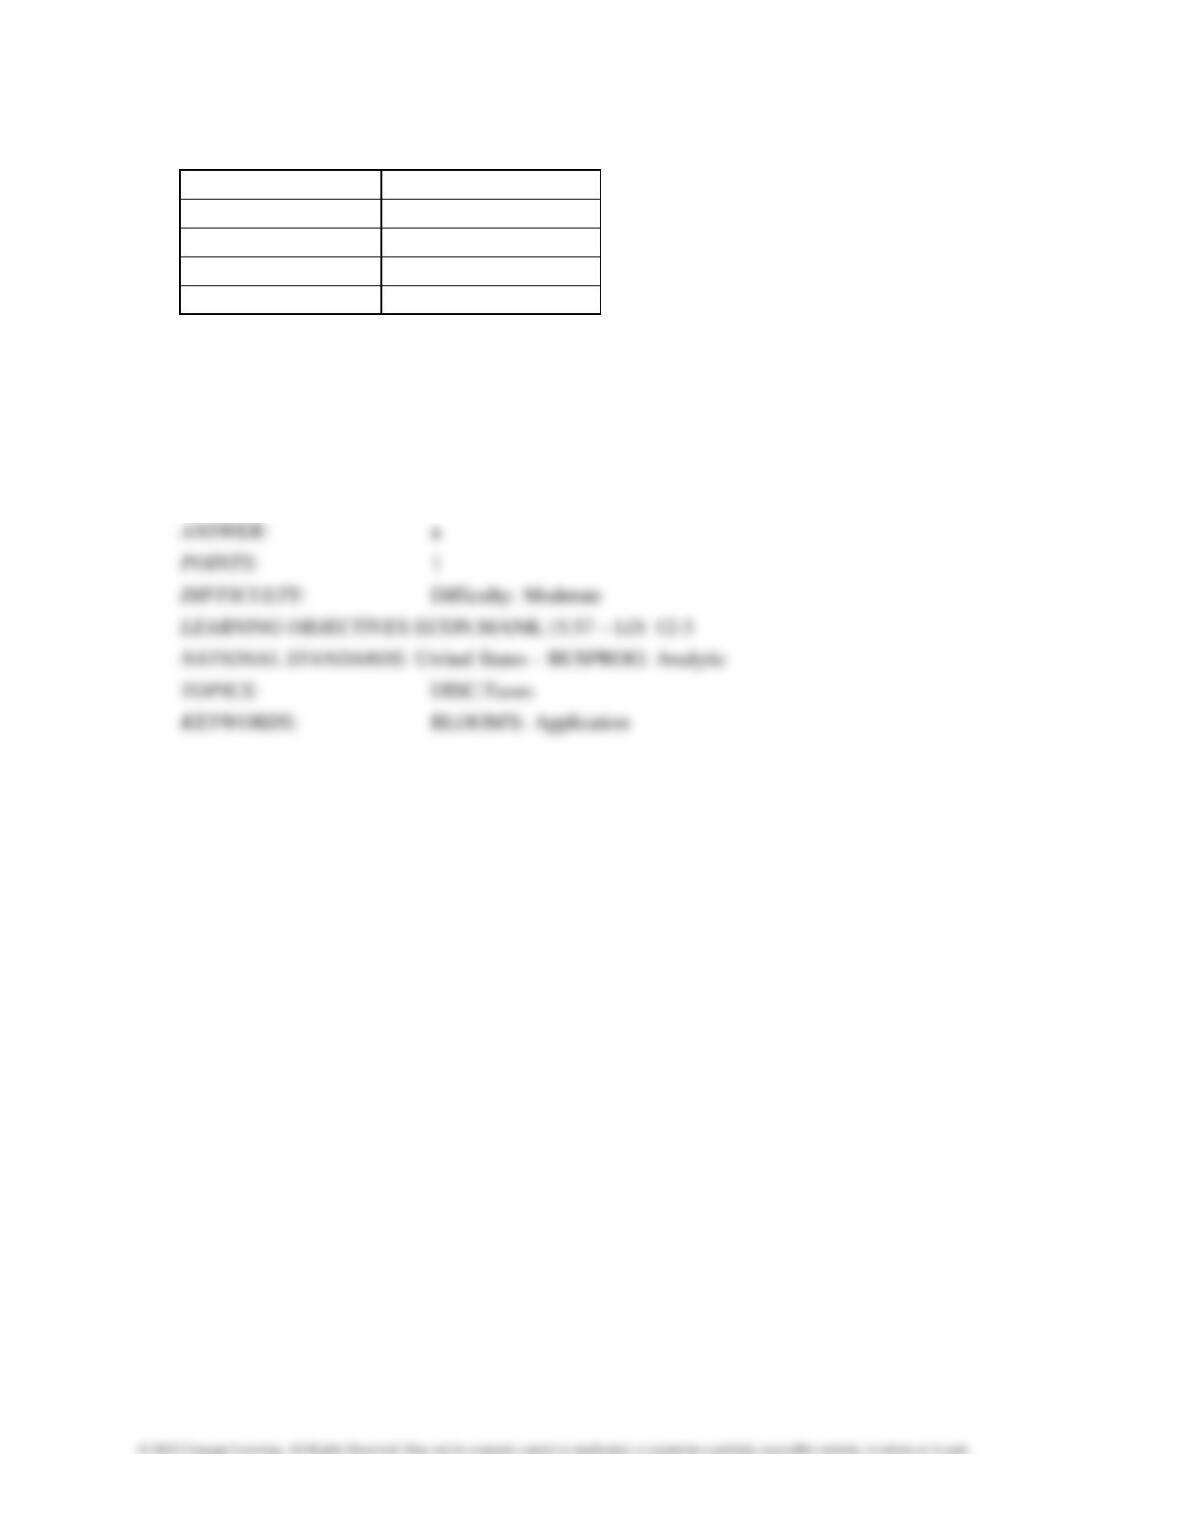
Table 12-14
Amount of Tax
Percent of Income
$15,000
15%
$30,000
20%
$60,000
30%
$90,000
40%
58. Refer to Table 12-14. The tax system is
a. progressive.
b. regressive.
c. proportional.
d. lump sum.
The Design of the Tax System 3117
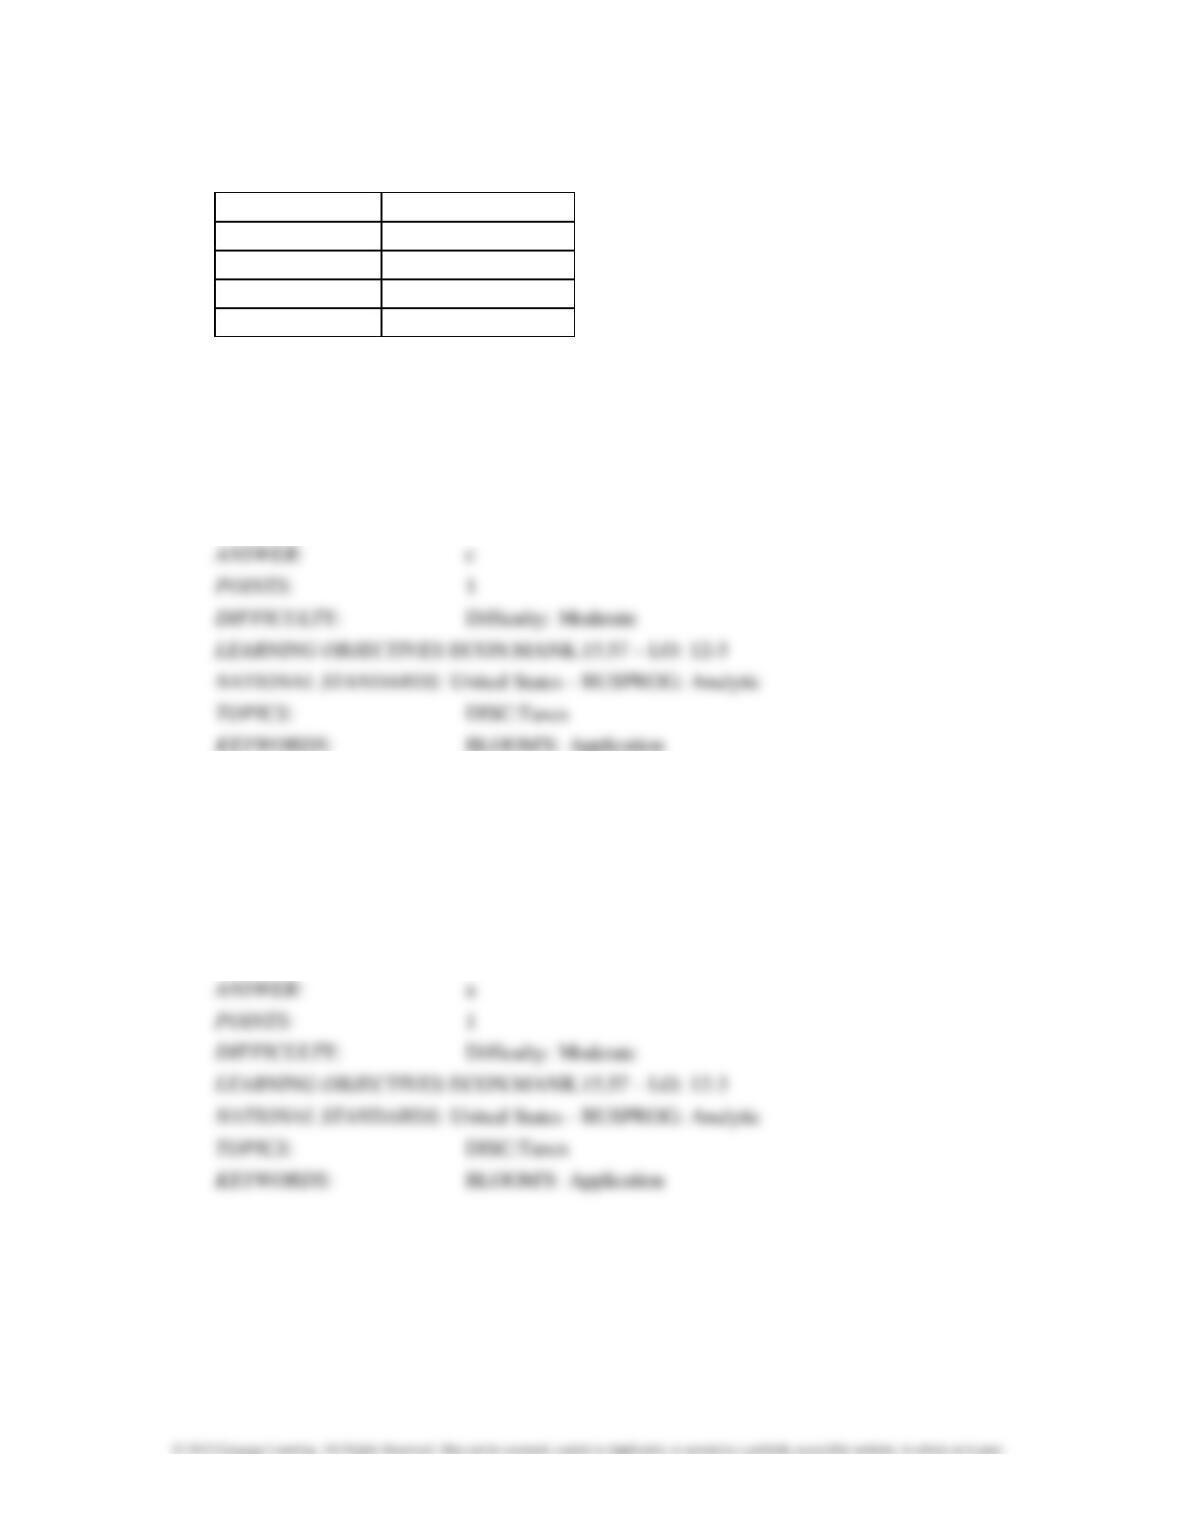
Table 12-15
Amount of Tax
Percent of Income
$15,000
20%
$30,000
30%
$60,000
40%
$100,000
50%
59. Refer to Table 12-15. The tax system is
a. proportional.
b. regressive.
c. progressive.
d. lump sum.
60. Refer to Table 12-15. In this tax system which of the following is possible?
a. vertical and horizontal equity
b. vertical but not horizontal equity
c. horizontal but not vertical equity
d. neither horizontal nor vertical equity
3118 The Design of the Tax System
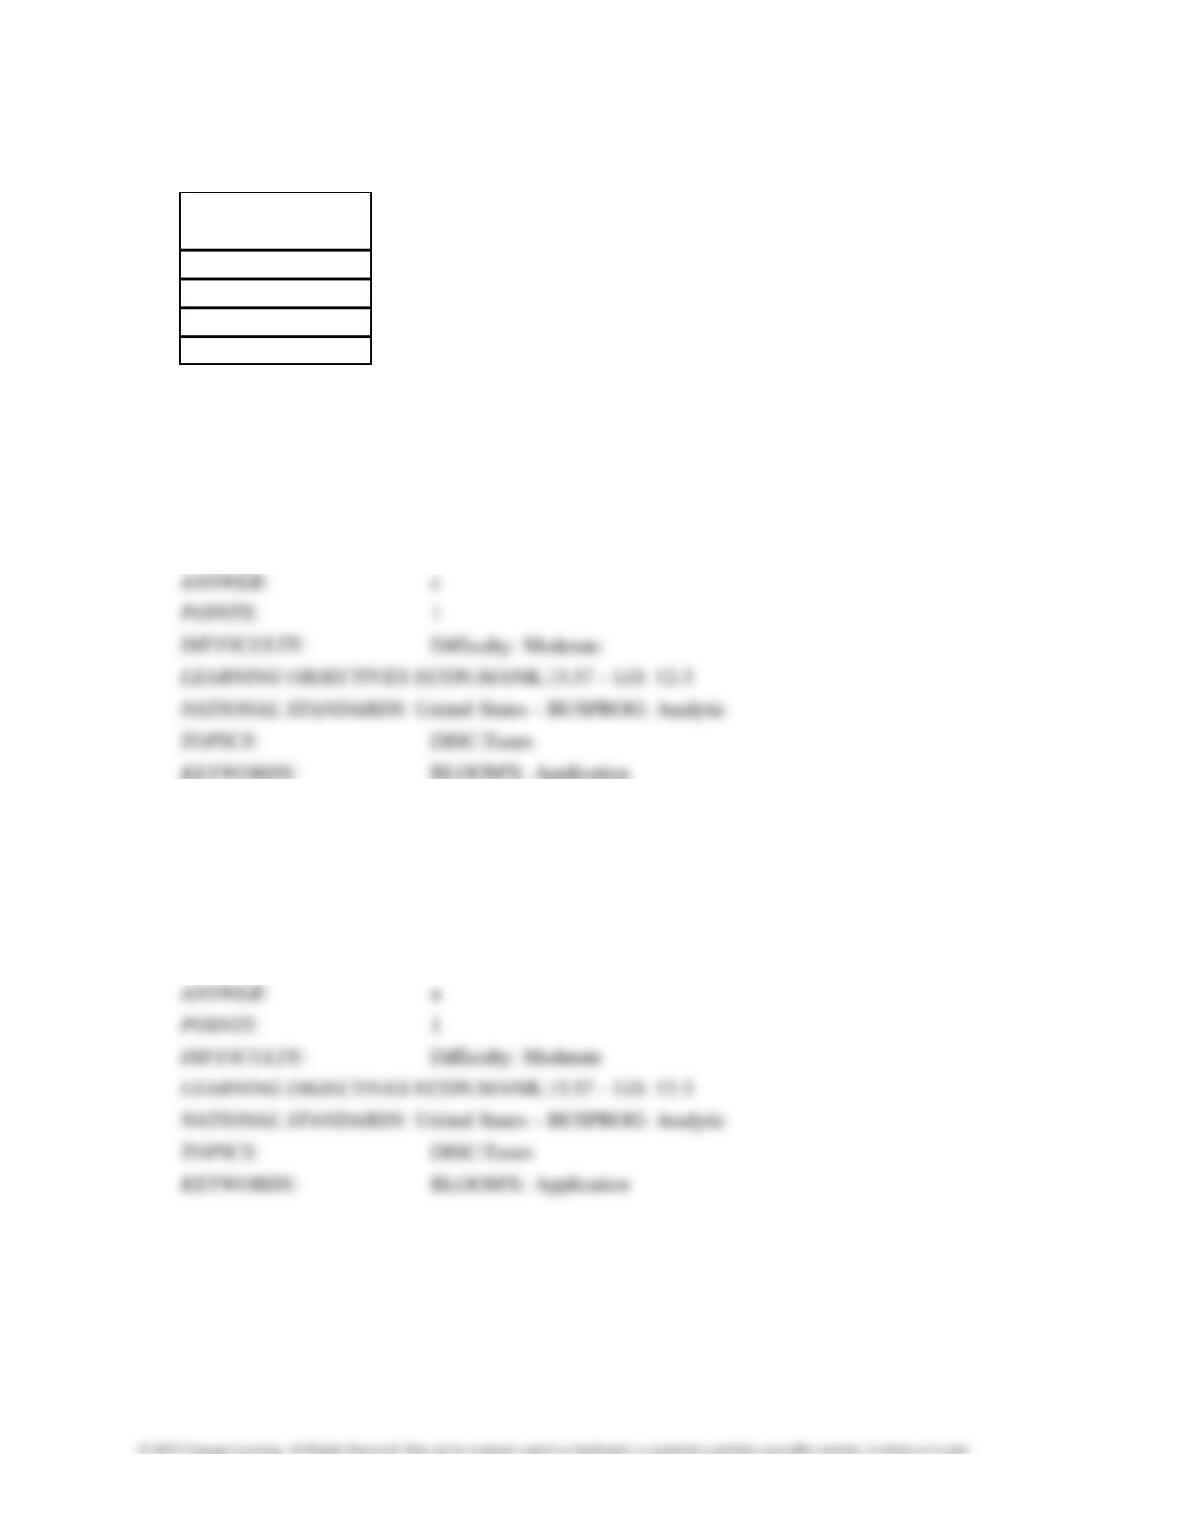
Table 12-16
Percent of Income
Paid as Tax
10%
20%
30%
40%
61. Refer to Table 12-16. The tax system is
a. proportional.
b. regressive.
c. progressive.
d. lump sum.
62. Refer to Table 12-16. In this tax system which of the following is possible?
a. vertical and horizontal equity
b. vertical but not horizontal equity
c. horizontal but not vertical equity
d. neither horizontal nor vertical equity
The Design of the Tax System 3119
Table 12-17
The following table shows the marginal tax rates for unmarried individuals for two years.
2009 2010
On Taxable Income...
The Tax Rate is...
On Taxable Income...
The Tax Rate is...
$0 to $15,000
10%
Over $0
20%
$15,000 to $40,000
15%
$40,000 to $75,000
20%
$75,000 to $120,000
25%
Over $120,000
30%
63. Refer to Table 12-17. Suppose one goal of the tax system was to achieve vertical equity. While
people may disagree about what is “equitable,” based on the marginal tax rates given for the two
years, which of the following statements is true?
a. Vertical equity is possible in both years.
b. Vertical equity is possible in 2009 but not in 2010.
c. Vertical equity is not possible in 2009 but is possible in 2010.
d. Vertical equity is not possible in either year.
64. Refer to Table 12-17. Which of the following best describes the tax schedule in 2009?
a. proportional tax
b. progressive tax
c. regressive tax
d. vertical tax
3120 The Design of the Tax System
Table 12-18
United States Income Tax Rates for a Single Individual, 2009 and 2010.
2009 Tax Rates
Income Ranges
2010 Tax Rates
Income Ranges
15%
$0 – $28,000
10%
$0 – $10,000
28%
$28,000 – $70,000
15%
$10,000 – $30,000
31%
$70,000 – $140,000
27%
$30,000 – $60,000
36%
$140,000 – $300,000
30%
$60,000 – $150,000
40%
over $300,000
35%
$150,000 – $320,000
38%
over $320,000
65. Refer to Table 12-18. What type of tax structure did the United States have in 2009 for single
individuals?
a. a proportional tax structure
b. a regressive tax structure
c. a progressive tax structure
d. a lump-sum tax structure
66. Refer to Table 12-18. What type of tax structure does the United States have in 2010 for single
individuals?
a. a proportional tax structure
b. a regressive tax structure
c. a progressive tax structure
d. a lump-sum tax structure
The Design of the Tax System 3121
67. In which of the following tax systems do taxes increase as income increases?
a. both proportional and progressive
b. proportional but not progressive
c. progressive but not proportional
d. neither proportional nor progressive
68. Suppose that the government collected taxes in the following fashion: people who earn less than
$50,000 pay 25 percent in taxes, people who earn between $50,000 and $100,000 pay 35 percent
in taxes, people who earn between $100,000 and $200,000 pay 30 percent in taxes, and people
who earn more than $200,000 pay 28 percent in taxes. Which of the following statements is
correct?
a. The tax system is proportional for income levels less than $50,000 and regressive for income
levels above
$50,000.
b. The tax system is regressive for income levels less than $100,000 and progressive for income
levels above
$100,000.
c. The tax system is progressive for income levels less than $100,000 and regressive for income
levels above
$100,000.
d. The tax system is progressive for income levels less than $50,000 and proportional for income
levels above
$100,000.
3122 The Design of the Tax System
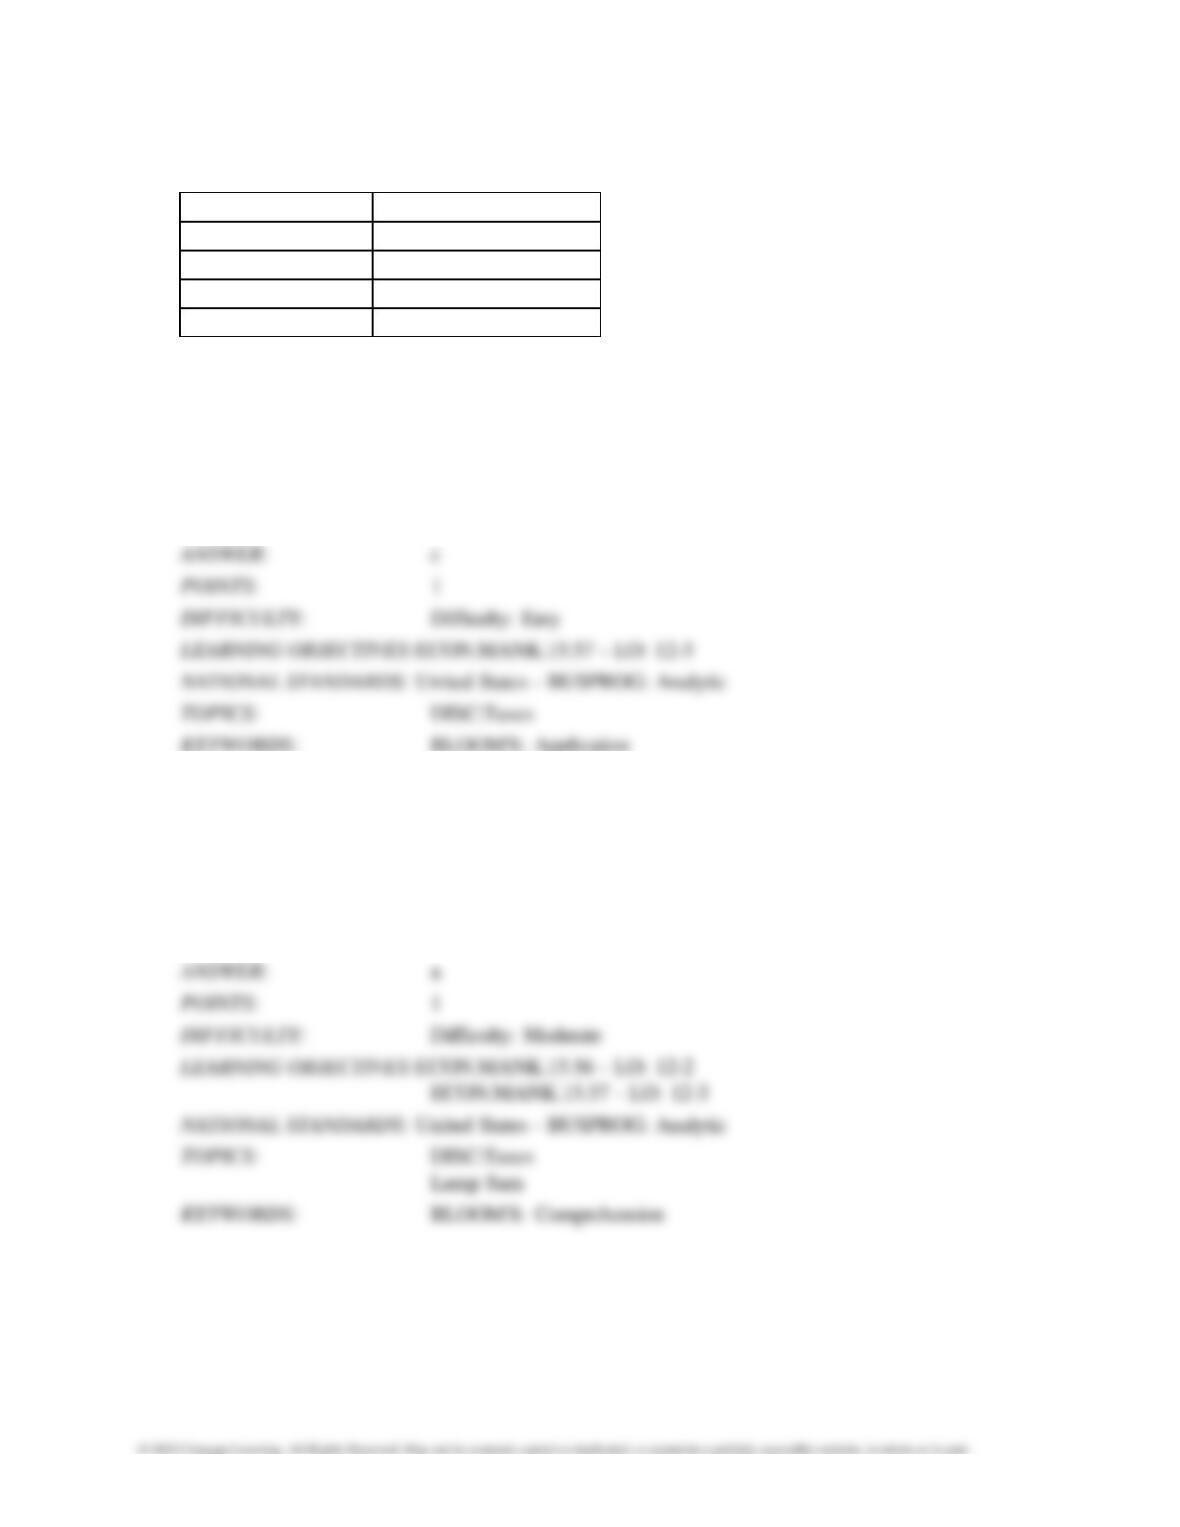
Table 12-19
Amount of Tax
Percent of Income
$15,000
15%
$30,000
15%
$60,000
15%
$90,000
15%
69. Refer to Table 12-19. The tax system is
a. progressive.
b. regressive.
c. proportional.
d. lump sum.
70. The most efficient tax possible is a
a. lump-sum tax.
b. marginal tax.
c. proportional tax.
d. value-added tax.
The Design of the Tax System 3123
Table 12-20
The following table presents the total tax liability for an unmarried taxpayer under four different
tax schedules for the income levels shown.
Amount of Tax Due
Income
Tax Schedule A
Tax Schedule B
Tax Schedule C
Tax Schedule D
$50,000
$10,000
$20,000
$17,500
$15,000
$100,000
$30,000
$30,000
$25,000
$30,000
$200,000
$80,000
$40,000
$30,000
$60,000
71. Refer to Table 12-20. Which tax schedules are progressive?
a. Tax Schedule A only
b. Tax Schedule A and Tax Schedule B
c. Tax Schedule A, Tax Schedule B, and Tax Schedule C
d. All four Tax Schedules are progressive.
72. Refer to Table 12-20. Which tax schedules are regressive?
a. Tax Schedule A and Tax Schedule B
b. Tax Schedule B and Tax Schedule C
c. Tax Schedule C and Tax Schedule D
d. None of the Tax Schedules are regressive.
3124 The Design of the Tax System
73. Refer to Table 12-20. Which tax schedules are proportional?
a. Tax Schedule B only
b. Tax Schedule B and Tax Schedule C
c. Tax Schedule D only
d. Tax Schedule A and Tax Schedule B
74. Refer to Table 12-20. Which tax schedule could be considered a lump-sum tax?
a. Tax Schedule B only
b. Tax Schedule B and Tax Schedule C
c. Tax Schedule D only
d. None of the tax schedules could be considered a lump-sum tax.
The Design of the Tax System 3125
Table 12-21
The dollar amounts in the last three columns are the taxes owed under the three different tax
systems.
Income
Tax System A
Tax System B
Tax System C
$ 50,000
$10,000
$25,000
$10,000
100,000
25,000
30,000
20,000
200,000
80,000
40,000
40,000
75. Refer to Table 12-21. Which of the three tax systems is proportional?
a. Tax System A
b. Tax System B
c. Tax System C
d. None of the systems are proportional.
76. Refer to Table 12-21. Which of the three tax systems is regressive?
a. Tax System A
b. Tax System B
c. Tax System C
d. None of the systems are regressive.
3126 The Design of the Tax System
77.
Refer to Table 12-21. Which of the three tax systems is progressive?
a. Tax System A
b. Tax System B
c. Tax System C
d. All of the tax systems are progressive.
Table 12-22
TAX A
TAX B
TAX C
TAX D
INCOME
AMOUNT OF TAX
AMOUNT OF TAX
AMOUNT OF TAX
AMOUNT OF TAX
$50,000
$12,500 (25%)
$15,000 (30%)
$10,000 (20%)
$15,000 (30%)
100,000
$25,000 (25%)
$25,000 (25%)
$25,000 (25%)
$15,000 (15%)
200,000
$50,000 (25%)
$40,000 (20%)
$60,000 (30%)
$15,000 (7.5%)
78. Refer to Table 12-22. A regressive tax is illustrated by tax
a. A only.
b. B or D.
c. C only.
d. A or D.
The Design of the Tax System 3127
79. Refer to Table 12-22. A proportional tax is illustrated by tax
a. A.
b. B.
c. C.
d. D.
80. Refer to Table 12-22. A lump-sum tax is illustrated by tax
a. A.
b. B.
c. C.
d. D.
3128 The Design of the Tax System
81. Refer to Table 12-22. A progressive tax is illustrated by tax
a. A.
b. B.
c. C.
d. D.
Table 12-23
The dollar amounts in the last three columns are the taxes owed under the three different tax
systems.
Income
Tax System A
Tax System B
Tax System C
$100,000
$20,000
$20,000
$50,000
$250,000
$50,000
$75,000
$60,000
$500,000
$100,000
$210,000
$70,000
82. Refer to Table 12-23. Which of the three tax systems is proportional?
a. Tax System A
b. Tax System B
c. Tax System C
d. None of the systems are proportional.
The Design of the Tax System 3129
83. Refer to Table 12-23. Which of the three tax systems is regressive?
a. Tax System A
b. Tax System B
c. Tax System C
d. None of the systems are regressive.
84. Refer to Table 12-23. Which of the three tax systems is progressive?
a. Tax System A
b. Tax System B
c. Tax System C
d. None of the systems are progressive.
85. Refer to Table 12-23. Which of the three tax systems exhibits vertical equity?
a. Tax System A
b. Tax System B
c. Tax System C
d. All of the systems exhibit vertical equity.
3130 The Design of the Tax System
86. In 2009, the lowest quintile of income earners paid about
a. 1 percent of income as taxes and paid less than 1 percent of all taxes.
b. 5 percent of income as taxes and paid less than 1 percent of all taxes.
c. 1 percent of income as taxes and paid about 5 percent of all taxes.
d. 5 percent of income as taxes and paid about 5 percent of all taxes.
87. In 2009, the top 1 percent of income earners made about
a. 1 percent of all income and paid about 1 percent of all taxes.
b. 13 percent of all income and paid about 22 percent of all taxes.
c. 22 percent of all income and paid about 13 percent of all taxes.
d. 50 percent of all income and paid about 50 percent of all taxes.


