CHAPTER 12
FINANCIAL STATEMENT ANALYSIS
SUMMARY OF QUESTION TYPES BY LEARNING OBJECTIVE
AND LEVEL OF DIFFICULTY
Item
LO
LOD
Item
LO
LOD
Item
LO
LOD
Item
LO
LOD
Item
LO
LOD
True-False Statements
1.
1
E
9.
4
E
17.
5
M
25.
6
M
33.
7
E
2.
1
E
10.
4
E
18.
5
E
26.
6
E
34.
8
M
3.
2
M
11.
4
E
19.
5
E
27.
7
M
35.
8
H
4.
2
E
12.
4
E
20.
5
M
28.
7
M
36.
8
H
5.
2
E
13.
5
E
21.
6
E
29.
7
E
6.
3
H
14.
5
M
22.
6
M
30.
7
E
7.
3
M
15.
5
E
23.
6
E
31.
7
E
8.
3
H
16.
5
E
24.
6
M
32.
7
E
Multiple Choice Questions
37.
1
H
50.
5
H
63.
6
M
76.
6,7
E
89.
6,7
M
38.
1
E
51.
5
M
64.
6
H
77.
6,7
E
90.
6,7
M
39.
1
E
52.
5
E
65.
6
M
78.
6,7
M
91.
6,7
M
40.
1
M
53.
5
M
66.
6
E
79.
6,7
H
92.
6,7
M
41.
1
H
54.
5
M
67.
6
E
80.
6,7
E
93.
6,7
E
42.
3
M
55.
5
M
68.
6
H
81.
6,7
M
94.
6,7
M
43.
3
M
56.
6
E
69.
6
M
82.
6,7
E
95.
6,7
M
44.
3
E
57.
6
E
70.
6
M
83.
6,7
M
96.
6,7
E
45.
3
E
58.
6
M
71.
6
M
84.
6,7
E
97.
6,7
M
46.
3
E
59.
6
E
72.
6,7
E
85.
6,7
E
98.
6,7
H
47.
4
M
60.
6
E
73.
6,7
E
86.
6,7
E
99.
6,7
H
48.
4
M
61.
6
E
74.
6,7
E
87.
6,7
E
100.
6,7
E
49.
5
E
62.
6
E
75.
6,7
M
88.
6,7
M
101.
6,7
M
Exercises
102.
6,7
H
103.
6,7
M
104.
6,7
H
105.
7
H
Matching
106.
3,5–7
M
107.
6
H
Short-Answer Essay
108.
7
M
109.
7
E
110.
7
E
Essay
111.
1
M
112.
7
M
Note: E = Easy M = Medium H = Hard
12 – 2 Test Bank for Understanding Financial Accounting, Canadian Edition
SUMMARY OF LEARNING OBJECTIVES BY QUESTION TYPE
Item
Type
Item
Type
Item
Type
Item
Type
Item
Type
Item
Type
Item
Type
Learning Objective 1
1.
TF
37.
MC
39.
MC
41.
MC
2.
TF
38.
MC
40.
MC
111.
Es
Learning Objective 2
3.
TF
4.
TF
5.
TF
Learning Objective 3
6.
TF
8.
TF
43.
MC
45.
MC
106.
Ma
7.
TF
42.
MC
44.
MC
46.
MC
Learning Objective 4
9.
TF
10.
TF
11.
TF
12.
TF
47.
MC
48.
MC
Learning Objective 5
13.
TF
16.
TF
19.
TF
50.
MC
53.
MC
106.
Ma
14.
TF
17.
TF
20.
TF
51.
MC
54.
MC
15.
TF
18.
TF
49.
MC
52.
MC
55.
MC
Learning Objective 6
21.
TF
59.
MC
68.
MC
77.
MC
86.
MC
95.
MC
104.
Ex
22.
TF
60.
MC
69.
MC
78.
MC
87.
MC
96.
MC
106.
Ma
23.
TF
61.
MC
70.
MC
79.
MC
88.
MC
97.
MC
107.
Ma
24.
TF
62.
MC
71.
MC
80.
MC
89.
MC
98.
MC
25.
TF
63.
MC
72.
MC
81.
MC
90.
MC
99.
MC
26.
TF
64.
MC
73.
MC
82.
MC
91.
MC
100.
MC
56.
MC
65.
MC
74.
MC
83.
MC
92.
MC
101.
MC
57.
MC
66.
MC
75.
MC
84.
MC
93.
MC
102.
Ex
58.
MC
67.
MC
76.
MC
85.
MC
94.
MC
103.
Ex
Learning Objective 7
27.
TF
72.
MC
79.
MC
86.
MC
93.
MC
100.
MC
108.
SAE
28.
TF
73.
MC
80.
MC
87.
MC
94.
MC
101.
MC
109.
SAE
29.
TF
74.
MC
81.
MC
88.
MC
95.
MC
102.
Ex
110.
SAE
30.
TF
75.
MC
82.
MC
89.
MC
96.
MC
103.
Ex
112.
Es
31.
TF
76.
MC
83.
MC
90.
MC
97.
MC
104.
Ex
32.
TF
77.
MC
84.
MC
91.
MC
98.
MC
105.
Ex
33.
TF
78.
MC
85.
MC
92.
MC
99.
MC
106.
Ma
Learning Objective 8
34.
TF
35.
TF
36.
TF
Note: TF = True-False Ex = Exercise SAE = Short-Answer Essay
MC = Multiple Choice Ma = Matching Es = Essay
Financial Statement Analysis 12 – 3
CHAPTER LEARNING OBJECTIVES
1. Understand and explain the process of financial analysis.
2. Identify the common contexts for financial statement analysis and explain why
an awareness of context is essential to the analysis.
3. Explain why knowledge of the business is important when analyzing a
company’s financial statements.
4. Identify the types of information used when analyzing financial statements and
where it is found.
5. Explain the various perspectives used in financial statement analysis, including
retrospective, prospective, trend, and cross-sectional analysis.
12 – 4 Test Bank for Understanding Financial Accounting, Canadian Edition
6. Identify the different metrics used in financial analysis, including common-size
analysis and ratio analysis, and explain how they are used.
7. Identify, calculate, and interpret specific ratios that are used to analyze the
liquidity, activity, solvency, profitability, and equity of a company.
8. Identify and explain the limitations of ratio analysis.

Financial Statement Analysis 12 – 5
TRUE-FALSE STATEMENTS
1. Financial statement analysis is the process of evaluating a company’s performance
based on an analysis of their financial statements.
2. It is important that the conclusion of an analysis differentiates between factual results
and the analysts’ opinion.
3. A banker assessing a loan application and an equity analyst making an investment
decision would perform the same type of analysis of a company.
4. An investment analyst will analyze the company’s results relative to other companies.
5. An investment analyst will only focus on historic results as future growth will not
impact shareholder decisions.
6. When analyzing companies that have diverse business activities, analysts should
NOT rely on segmented information.
7. When a company operates in different geographic locations this is known as operating
segments.
8. A company is required to disclose information related to the segment(s) in a note to
the financial statements if it has only one distinctive operating segment.
9. The auditor‘s report guarantees the accuracy of the information presented in the
financial statements.
10. The objective of MD&A is to allow the user to see the company through the eyes of
management.
11. Financial statement users value the auditors’ opinion as the auditor is an
independent third party.
12. The audit report guarantees the accuracy of financial information contained in the
financial statements.

12 – 6 Test Bank for Understanding Financial Accounting, Canadian Edition
13. Analyzing financial data on the same company over time is called cross-sectional
analysis.
14. Retrospective analysis reviews past trends in order to help predict the future.
15. Times series analysis compares the data from one company with the data from
another company.
16. Prospective analysis is known as a forward-looking analysis.
17. Retrospective analysis is using the past to predict future trends.
18. Historical results CANNOT be used as a foundation for predicting future outcomes.
19. Trend analysis is used to examine one period of a company’s information.
20. Cross-sectional analysis compares data from one company with those of another
company over many periods.
21. Common-size analysis is useful for making comparisons across the various financial
statements.
22. Common-size income statement analysis uses net revenues as a base for all
percentages.
23. Ratio analysis provides a complete picture of the general financial health and
wellbeing of a company.
24. Common-size analysis involves converting the percentage values in the financial
statements to dollar values.
25. Ratios exhibit the relationship between figures from year to year and the reason for
the changes year to year.
26. Ratios are more conclusive than attention directing.
27. Return on equity is a measure of performance from management’s perspective.

Financial Statement Analysis 12 – 7
28. Fully diluted earnings per share is a worst case scenario.
29. When calculating the EPS, the cumulative preferred dividends must be removed
even if the dividends have NOT been declared and paid.
30. The current ratio is an activity ratio.
31. Activity ratios measure how efficiently or effectively a company is managing its short–
term assets and short-term obligations.
32. The current ratio should normally be 1.0 or less.
33. Activity ratios help an analyst assess the company’s management of its working
capital.
34. Accounting policy choices will affect the financial statement but do NOT impact the
ratios determined.
35. The diversity of operations can make it difficult to compare companies and also
affects the trend analysis for the same company.
36. “Window dressing” is a term used when a company postpones transactions to
produce a more desirable number to be used in ratio calculations.
12 – 8 Test Bank for Understanding Financial Accounting, Canadian Edition
ANSWERS TO TRUE-FALSE STATEMENTS
Item
Ans.
Item
Ans.
Item
Ans.
Item
Ans.
Item
Ans.

Financial Statement Analysis 12 – 9
MULTIPLE CHOICE QUESTIONS
37. Place the following steps involved in financial statement analysis in the proper order:
I. Determine the purpose and context of the analysis
II. Develop conclusions and recommendations
III. Collect information needed for the analysis
IV. Analyze and interpret the metrics
V. Prepare common-size analysis and calculate ratios
a) I, III, V, IV, II
b) I, II, III, IV, V
c) V, I, III, IV, II
d) IV, III, V, I, II
38. An analysis can be performed by a(n)
a) credit rating agency.
b) potential investors.
c) creditors.
d) all of the above.
39. An analysis would include
a) calculating ratios.
b) looking at relationships with the financial statements.
c) comparing results with industry benchmarks.
d) all of the above.
40. Analysts use financial statements for their analysis for all of the following reasons
EXCEPT
a) corporate performance.
b) employee satisfaction.
c) lending decisions.
d) risks related to the investment.
41. Which one of the following steps adds the most value to an analysis?
a) determine the purpose of the analysis
b) develop conclusions
c) analyze and interpret the ratios
d) prepare common-size analysis
42. In order to understand a company’s business, an analyst must understand the
corporation’s strategy. Which of the following is an example of a corporate strategy?
a) being a high-cost producer
b) following product simplification
c) being a low-cost producer
d) being a low-volume producer

12 – 10 Test Bank for Understanding Financial Accounting, Canadian Edition
43. A low-cost producer focuses on
a) providing goods and services at highest possible costs and selling at high prices.
b) providing goods and services at lowest possible costs and selling at high prices.
c) providing goods and services at highest possible costs and selling at low prices.
d) providing goods and services at lowest possible costs and selling at low prices.
44. Product differentiation strategy is to
a) provide superior service at a premium price.
b) provide superior service at a low price.
c) provide regular service at a low price.
d) provide regular service at a high price.
45. Which of the following best represents a low-cost producer?
a) gourmet grocery store
b) discount grocery store
c) high end retailer
d) specialty store
46. Which of the following best represents a company following the product differentiation
strategy?
a) gourmet grocery store
b) discount grocery store
c) discount retailer
d) dollar store
47. Why is the audit report important in the analysis of a company?
a) It guarantees the accuracy of the information in the financial statements.
b) It guarantees the accuracy of the internal controls of the company.
c) The auditors are hired by management to assess the appropriateness of the accounting
policies chosen.
d) The auditors are an independent third party expressing an opinion on the fairness of the
financial statements.
48. The auditor’s report confirms that
a) the financial statements are error free.
b) the information contained in the auditor’s report is negative information.
c) the statements present fairly the financial condition of a company.
d) the auditor has qualifications to make on the information.
49. Cross-sectional analysis involves examining a company’s financial data
a) across account classifications.
b) as percentages of net sales or total assets.
c) and comparing it with other companies.

Financial Statement Analysis 12 – 11
d) across time periods.
50. The analysis of financial statements to assist in predicting future results is an example of
a) historical analysis.
b) retrospective analysis.
c) retroactive analysis.
d) prospective analysis.
51. Which of the following is NOT an example of cross sectional analysis?
a) determining how the growth in sales from one company differed from that of another
company
b) comparing growth in sales across different industries
c) determining the growth in sales for a company over a five-year period
d) comparing total sales across companies in the same industry for the past three years
52. Which of the following depicts earnings per share?
a) Net income ÷ number of common shares
b) Net income ÷ weighted average number of common shares
c) (Net income – preferred dividend) ÷ weighted average number of common shares
d) (Net income – preferred dividend) ÷ number of common shares
53. EBITDAR is best described as
a) earnings before income, taxes, depreciation, acquisitions and restructuring.
b) earnings before interest, taxes, depreciation, acquisitions and restructuring.
c) earnings before income, taxes, discounts, acquisitions and restructuring.
d) equity before interest, taxes, depreciation, acquisitions and restructuring.
54. Which of the following descriptions best describes trend analysis?
a) converting dollar values on the financial statements to percentages of a specific base
amount
b) comparing data from one company to with those of another company over the same
period
c) examining company information from multiple periods
d) using historical information as a basis for predicting future outcomes
55. Which of the following descriptions best describes cross-sectional analysis?
a) converting dollar values on the financial statements to percentages of a specific base
amount
b) comparing data from one company to with those of another company over the same
period
c) examining company information from multiple periods
d) using historical information as a basis for predicting future outcomes
56. On a common-size income statement, all items are shown as

12 – 12 Test Bank for Understanding Financial Accounting, Canadian Edition
a) percentages of net income.
b) percentages of total assets.
c) percentages of gross revenue.
d) percentages of gross profit.
57. Which of the following is NOT a general category of ratios?
a) performance
b) short-term liquidity
c) long-term liquidity
d) financial leverage
58. An analytical tool for comparing two companies of different sizes is
a) common-size statements.
b) short-term liquidity.
c) financial leverage.
d) performance.
59. Review of the financial statements revealed the following for Glitter Inc.: Sales
$1,250,000, Net income $37,500, Total assets $650,000, Long-term debt $750,000, Interest
expense $65,000 and Cost of goods sold $775,000. When preparing common-size financial
statements, interest expense would be shown as
a) 10.0%.
b) 9.3%.
c) 8.4%.
d) 5.2%.
60. To see if a company’s cost of sales is increasing proportionately with sales, an analyst
would use
a) raw financial data.
b) common-size analysis.
c) trend analysis.
d) prospective analysis.
61. Ratios are useful in explaining the
a) relationships between financial data.
b) differences between companies.
c) trends within industries.
d) reasons for financial performance.
Use the following information for questions 62–63.
Consider the following income statement data for Odem Inc.:
2016 2015
Sales revenue $97,300 $86,200
Less: Cost of goods sold 45,600 53,400

Financial Statement Analysis 12 – 13
Gross profit 51,700 32,800
Less: Selling and administration costs 22,500 18,300
Net Income $29,200 $14,500
62. The common-size percentage for selling and administration costs in 2016 was
a) 21.2%.
b) 23.1%.
c) 43.5%.
d) 77.0%.
63. Based on common-size analysis, which of the following statements is correct?
a) The increase in sales revenue in 2016 was caused by higher selling and administrative
expenses.
b) The company’s cost to sales ratio improved in 2016.
c) The increase in gross profit in 2016 was due to increased sales.
d) Net income as a percent of sales declined in 2016.
64. Given the following data: sales $1,500,000; gross profit $640,000; net income $40,000
and income tax expense $35,000. What is the common-size percentage for operating
expenses?
a) 37.7%
b) 42.7%
c) 95.0%
d) 97.3%
65. Given the following data: sales $1,500,000; gross profit $640,000; net income $40,000
and income tax expense $35,000. What is the common-size percentage for the cost of
sales?
a) 3.0%
b) 37.7%
c) 42.7%
d) 57.3%
66. Which of the following is a short-term liquidity ratio?
a) debt/equity ratio
b) profit margin ratio
c) quick ratio
d) return on assets ratio
67. How are prepaid accounts used in each of the following ratios?
Current ratio Quick ratio
a) Numerator Denominator
b) Numerator Numerator
c) Numerator Not used
d) Not used Numerator

12 – 14 Test Bank for Understanding Financial Accounting, Canadian Edition
68. Purchase of inventory for cash will
a) increase the current ratio.
b) decrease the current ratio.
c) increase the quick ratio.
d) decrease the quick ratio.
69. Which of the following represents the debt/equity ratio?
a) total liabilities ÷ total shareholders’ equity
b) total liabilities ÷ (total liabilities + shareholders’ equity)
c) total liabilities ÷ (total assets – shareholders’ equity)
d) total long-term liabilities ÷ (total long-term liabilities + shareholders’ equity)
70. Which of the following descriptions best describes common-size analysis?
a) converting dollar values on the financial statements to percentages of a specific base
amount
b) comparing data from one company to with those of another company over the same
period
c) examining company information from multiple periods
d) using historical information as a basis for predicting future outcomes
71. When preparing common-size analysis of a statement of income, the base is normally
a) Net income.
b) Operating expenses.
c) Revenues.
d) Cost of goods sold.
72. All of the following measure activity except for
a) accounts receivable turnover.
b) inventory turnover.
c) equity turnover.
d) accounts payable turnover.
73. Review of the financial statements revealed the following for Glitter Inc.: Sales
$1,250,000, Net income $37,500, Total assets $650,000, Long-term debt $750,000, Interest
expense $65,000 and Cost of goods sold $775,000. What is the Glitter’s gross profit margin
closest to?
a) 3%
b) 38%
c) 52%
d) 62%
74. Which of the following companies would be least likely to calculate accounts receivable
turnover ratios?

Financial Statement Analysis 12 – 15
a) a restaurant
b) a construction company
c) a consulting firm
d) an insurance office
75. Which of the return on investment ratios would be of most interest to the owners of a
company?
a) return on assets
b) return on interest
c) return on debt
d) return on equity
76. Lenders would be most concerned with
a) debt to equity ratio.
b) EPS.
c) inventory turnover.
d) price earnings ratio.
77. Which of the return on investment ratios would be of most interest to the management of
a firm?
a) return on assets
b) return on debt
c) return on equity
d) return on profits
78. The return on assets ratio could be used for a(n)
a) financing decision.
b) liquidity decision.
c) investment decision.
d) debt-to-equity decision.
79. Changes in the profit margin ratio could indicate changes in any of the following EXCEPT
changes in
a) sales volume.
b) product profitability.
c) the cost structure.
d) the pricing policy.
Use the following information for questions 80–81.
The following data was taken from the accounting records of Whalen Corporation:
2016 2015
Total assets $950,000 $850,000
Total liabilities 250,000 240,000
Preferred shares 75,000 75,000

12 – 16 Test Bank for Understanding Financial Accounting, Canadian Edition
Common shares 300,000 300,000
Retained earnings 325,000 235,000
Additional data:
Net income 140,000
Interest expense 25,000
Sales revenue 980,000
80. The return on assets for 2016 is
a) 15.6%.
b) 16.5%.
c) 17.4%.
d) 18.5%.
81. The return on equity for 2016 is
a) 20.0%.
b) 21.4%.
c) 26.7%.
d) 46.7%.
82. Consider the following income statement data for Odem Inc.:
2016 2015
Sales revenue $97,300 $86,200
Less: Cost of goods sold 45,600 53,400
Gross profit 51,700 32,800
Less: Selling and administration costs 22,500 18,300
Net Income $29,200 $14,500
What was the 2016 net profit margin before income tax closest to?
a) 16.8%
b) 23.1%
c) 30.0%
d) 53.1%
Use the following information for questions 83–85.
Luminus Corporation‘s books revealed the following for 2016 and 2015:
2016 2015
Cash $ 27,750 $ 21,250
Accounts receivable 42,000 37,500
Inventory 72,250 61,600
Other prepaid assets 12,500 12,500
Accounts payable 41,250 38,000
Other current payables 13,000 15,000
Shareholders’ equity 100,250 79,850
Sales 525,000 450,750
Cost of goods sold 300,000 240,750
Operating expenses 70,000 65,000

Financial Statement Analysis 12 – 17
Net income $155,000 $145,000
83. The number of days to collect the average receivable in 2016 was
a) 28 days.
b) 29 days.
c) 30 days.
d) 31 days.
84. The current ratio for the 2016 year-end is
a) 2.85.
b) 2.62.
c) 1.29.
d) 1.02.
85. The quick ratio for the 2016 year-end is
a) 1.99.
b) 1.69.
c) 1.52.
d) 1.29.
86. Which of the following depicts the current ratio?
a) (current assets – inventory) ÷ current liabilities
b) currents assets ÷ total assets
c) (current assets – inventory) ÷ total assets
d) current assets ÷ current liabilities
87. Which of the following depicts the quick ratio?
a) (cash + accounts receivable + short-term investments) ÷ current liabilities
b) (cash + accounts receivable) ÷ total assets
c) (current assets – current liabilities) ÷ total assets
d) (cash + inventory) ÷ current liabilities
88. Two companies have an identical amount of current assets and current liabilities.
Chelmsford Inc. has 40% of its current assets invested in inventory, whereas Hanmer Corp.
has 30% of its current assets invested in inventory. Which of the following statements is
true?
a) Chelmsford will have the higher quick ratio.
b) Chelmsford will have the higher current ratio.
c) The companies are equally liquid because their current ratios are the same.
d) Chelmsford is less liquid than Hanmer.
89. Which of the following transactions will increase the current ratio (assuming the ratio is
initially greater than 1)?
a) purchasing inventory on credit

12 – 18 Test Bank for Understanding Financial Accounting, Canadian Edition
b) selling inventory for more than cost
c) buying office supplies
d) collecting accounts receivable
90. The quick ratio will be negatively impacted by
a) tying up cash in inventory.
b) increasing accounts receivable.
c) decreasing the level of prepaid accounts.
d) increasing levels of long term debt.
91. An analyst is comparing two companies, a retail bookstore chain and an on-line
bookstore. Which of the following activity ratios is most likely significantly higher for the on-
line bookstore?
a) accounts receivable turnover
b) inventory turnover
c) accounts payable turnover
d) gross margin
92. An analyst is comparing two companies, a retail bookstore chain and an on-line
bookstore. Which of the following liquidity ratios is most likely significantly lower for the retail
bookstore?
a) quick ratio
b) current ratio
c) working capital
d) operating cash flow to short term debt
93. To best interpret the accounts receivable turnover ratio, the days in accounts receivable
should be compared to the company’s
a) inventory turnover.
b) sales revenue.
c) credit terms.
d) accounts receivable balance.
Use the following information for questions 94–96.
Makevali Industries’ books revealed the following data for 2016:
Total assets $575,000 Shareholders’ equity $222,900
Current liabilities 52,100 Long-term liabilities 300,000
Operating Cash flow 125,500
94. The debt/equity ratio for 2016 is
a) 1.25.
b) 1.34.
c) 1.58.
d) 2.33.

Financial Statement Analysis 12 – 19
95. The cash flows to total liabilities ratio for 2016 is
a) 35.6%.
b) 41.75%.
c) 56.19%.
d) 241%.
96. Which of the following represents the interest coverage ratio?
a) Net income ÷ interest
b) [Net income + (interest × (1 – tax rate))] ÷ interest
c) Income before interest but after taxes ÷ interest
d) Income before interest , taxes and depreciation ÷ interest
97. Diesel Inc. had the following activity during 2016:
Sales $1,250,000 Interest expense $41,000
Cost of sales 787,500 Income tax expense 27,400
Selling & Admin. expenses 252,300
The interest coverage ratio during 2016 is
a) 5.13.
b) 5.80.
c) 7.69.
d) 11.28.
98. Which ratio can help estimate the number of years required to pay off a company’s total
debt?
a) total debt ÷ net income
b) net income ÷ operating cash flow
c) total debt ÷ current assets
d) cash flows for operations ÷ total liabilities
99. The price investors are willing to pay for a dollar’s worth of earnings is the
a) ROE
b) EPS.
c) price earnings ratio.
d) stock market price.
Use the following information for questions 100–101.
From the year-end financial statements of Mega Mix Music (MMM) Ltd.:
Common Preferred
Average shareholders’ equity $1,500,000 $ 120,000
Average number of shares outstanding 100,000 30,000
Dividends paid 50,000 90,000
Additional Data:

12 – 20 Test Bank for Understanding Financial Accounting, Canadian Edition
Net Income $340,000
Interest expense $22,000
Average Total assets $2,535,000
100. The EPS for MMM Ltd.is
a) $1.92.
b) $2.00.
c) $2.50.
d) $3.40.
101. Which of the following ratios would be considerably higher for a financial services
company as opposed to a manufacturer?
a) EPS
b) debt-to-equity
c) net profit margin
d) price earnings
Financial Statement Analysis 12 – 21
ANSWERS TO MULTIPLE CHOICE QUESTIONS
Item
Ans.
Item
Ans.
Item
Ans.
Item
Ans.
Item
Ans.
Item
Ans.

12 – 22 Test Bank for Understanding Financial Accounting, Canadian Edition
EXERCISES
102. Christakos Corporation’s financial statements for 2016 follow:
CHRISTAKOS CORPORATION
Statement of Income
For the Year Ended December 31, 2016
Sales $1,575,000
Cost of goods sold (976,500)
Gross profit 598,500
Operating expenses (236,250)
Income before taxes 362,250
Income taxes (144,900)
Net income $ 217,350
CHRISTAKOS CORPORATION
Statement of Financial Position
December 31, 2016
Cash $ 49,000
Receivables 143,900
Inventories 167,800
Property, plant and equipment 682,800
Total assets $1,043,500
Current liabilities $ 131,000
Non-current liabilities 450,000
Common shares 250,000
Retained earnings 212,500
Total liabilities and shareholders’ equity $1,043,500
Instructions
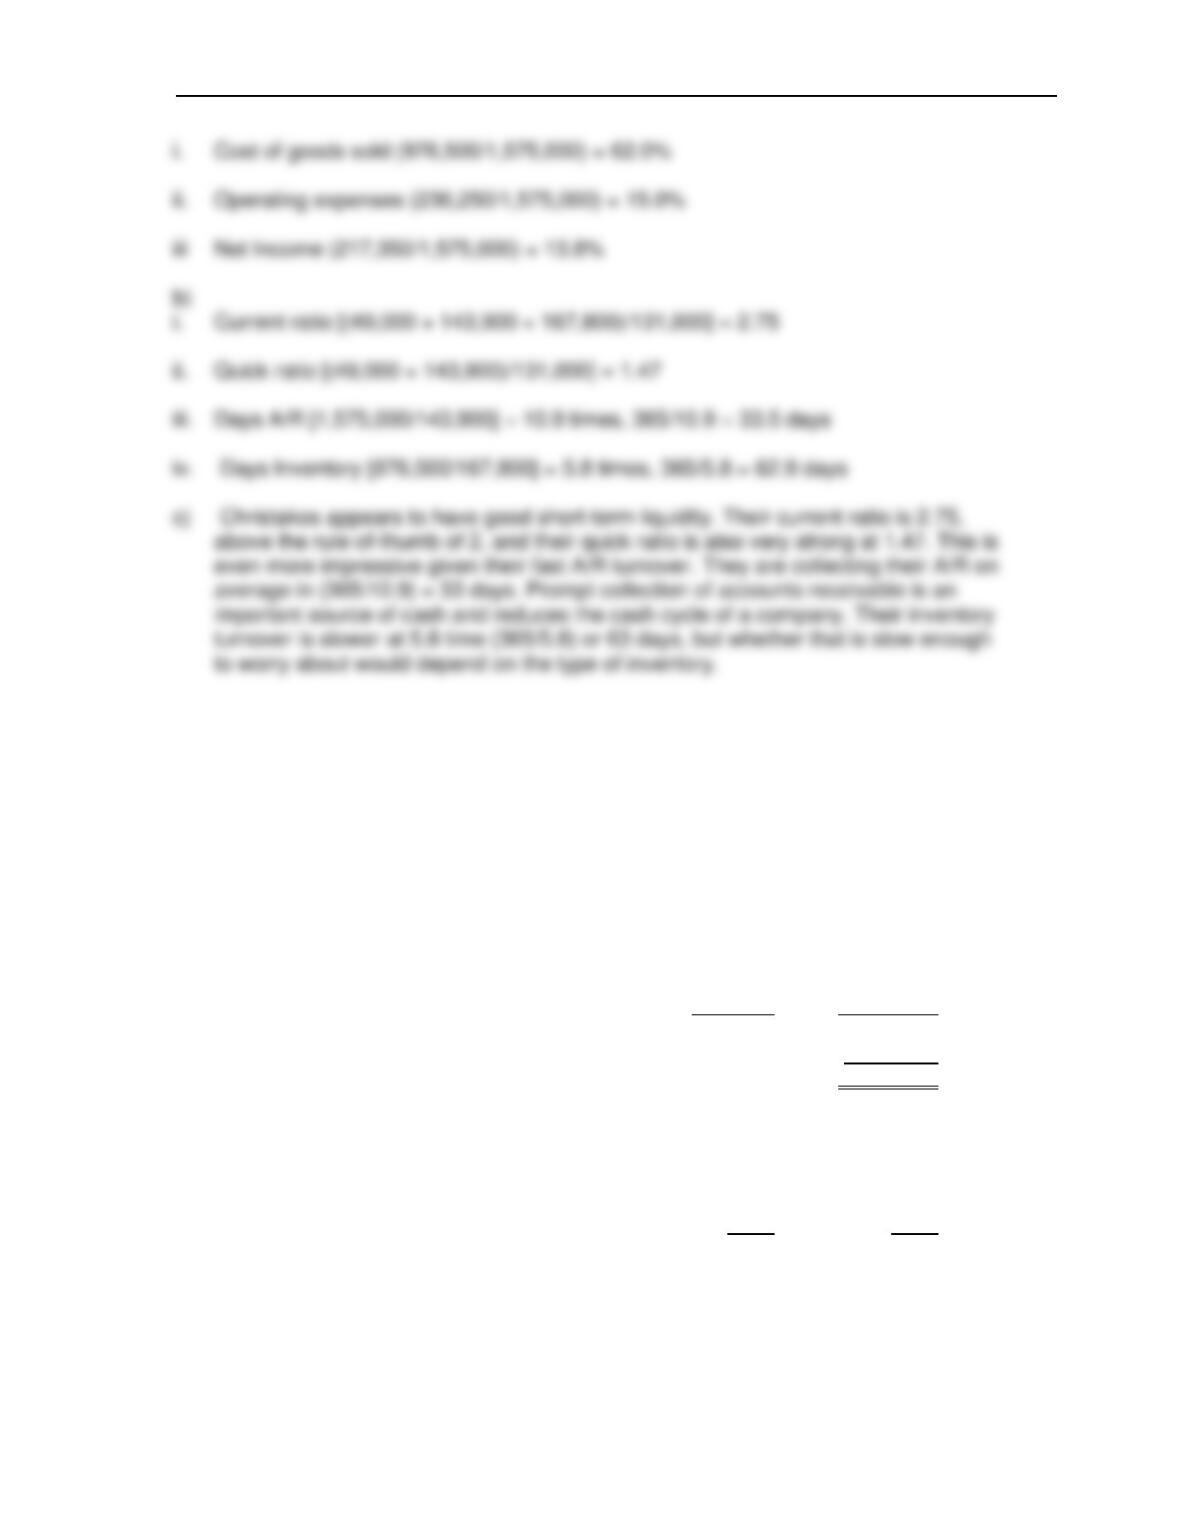
a) If Christakos were preparing common-size financial statements, calculate the
following:
i. Cost of goods sold
ii. Operating expenses
iii. Net Income
b) Calculate the following liquidity ratios for Christakos:
i. Current ratio
ii. Quick ratio
iii. Days Accounts receivable (assume average assets are the same as year-end
assets)
iv. Days Inventory (assume average assets are the same as year-end assets)
c) Comment on Christakos’s performance.
Solution (15 min.)
a)
Financial Statement Analysis 12 – 23
103. Abbreviated versions of the financial statements for Forbes Industries are
presented below:
FORBES COMPANY
Statement of Income
For the Year Ended December 31, 2016
Sales $1,700,000
Costs and expenses
Cost of good sold $1,140,000
Operating expenses 364,800
Interest expense 37,800 1,542,600
Income before income taxes 157,400
Income tax expense 55,090
Net income $ 102,310
FORBES COMPANY
Statement of Financial Position
December 31, 2016
2016 2015
Total assets $842,110 $717,800
Total liabilities 329,600 279,600
Total shareholders’ equity 512,510 438,200
Instructions
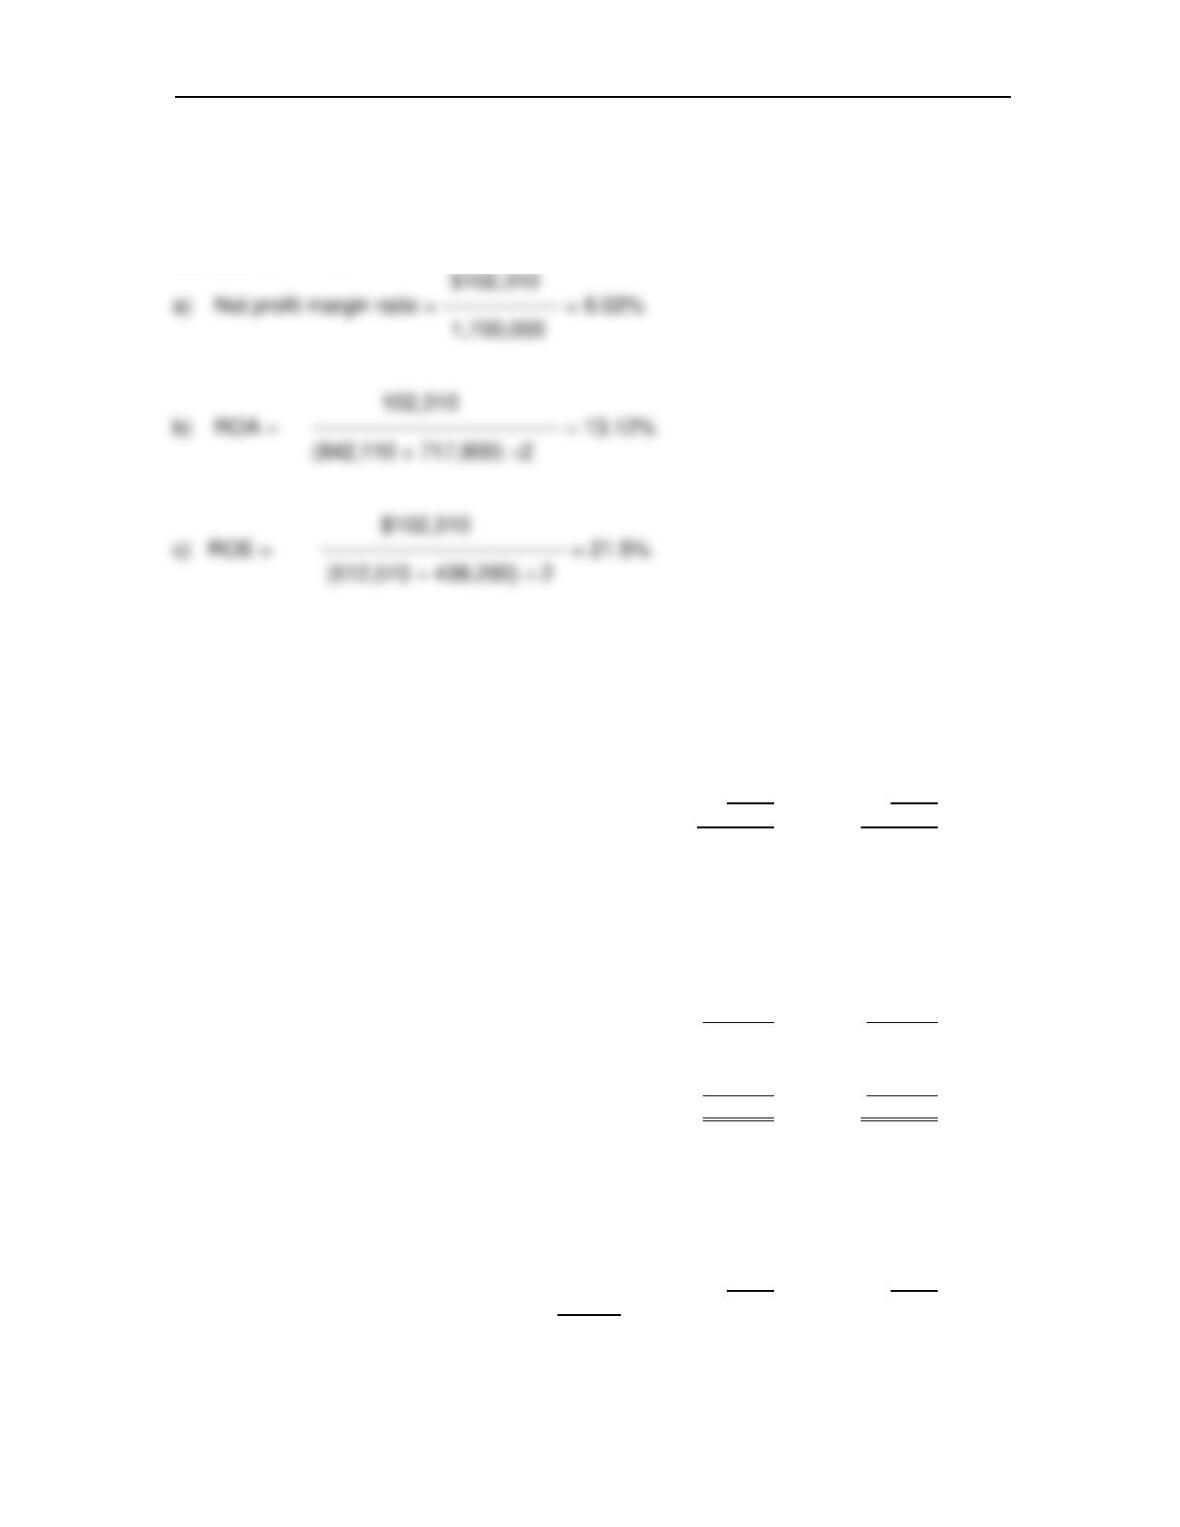
Calculate the following:
12 – 24 Test Bank for Understanding Financial Accounting, Canadian Edition
a) Net profit margin ratio
b) Return on assets
c) Return on equity
Solution (15 min.)
104. The following are the comparative financial statements for Haki Corporation for
2016 and 2015: Haki Corporation
Comparative Statement of Incomes
For periods ending December 31
2016 2015
Sales Revenue 167,500 140,000
Cost of Goods Sold 100,000 85,000
Gross Profit 67,500 55,000
Expenses
Depreciation 15,000 15,000
Selling and Administrative 22,500 15,000
Interest Expense 5,000 2,500
Total Expenses 42,500 32,500
Net Income (before taxes) 25,000 22,500
Income Taxes 10,000 7,500
Net Income 15,000 15,000
Haki Corporation
Comparative Statement of Financial Positions
As at December 31
2016 2015
Assets
Current Assets:
Cash 4,000 2,500
Financial Statement Analysis 12 – 25
Marketable Securities 10,000 7,500
Accounts Receivable 35,000 30,000
Inventory 31,000 25,000
Total Current Assets 80,000 65,000
Investments (at cost) 30,000 32,500
Property, plant and equipment
Property, Plant and Equipment 200,000 190,000
Less: Accumulated Depreciation 87,500 80,000
112,500 110,000
Goodwill 2,500 2,500
Total Assets 225,000 210,000
Liabilities and Shareholders’ Equity
Current Liabilities:
Accounts Payable 12,500 10,000
Notes Payable 25,000 20,000
Accrued and Other Liabilities 20,000 15,000
Total Current Liabilities 57,500 45,000
Non current Liabilities:
Bonds and Notes Payable 72,500 78,250
Total Liabilities 130,000 123,250
Shareholders’ Equity
Common shares 15,000 15,000
Contributed Surplus 55,000 61,750
Retained Earnings 25,000 10,000
Total Shareholders’ Equity 95,000 86,750
Total Liabilities and Shareholders’ Equity 225,000 210,000
Instructions
Comment on the financial performance of Haki Co in terms of
a) Liquidity
b) Activity
c) Profitability
d) Solvency
Solution (25 min.)
12 – 26 Test Bank for Understanding Financial Accounting, Canadian Edition
Financial Statement Analysis 12 – 27
105. Odeon Inc. has come to the bank you work for looking for a $250,000 long-term
loan. The loan committee has asked you to review the following data submitted with
Odeon’s loan application:
2014 2015 2016
Current assets $316,500 $475,200 $820,800
Current liabilities 120,000 155,400 414,600
Non-current liabilities 60,800 175,200 300,000
Shareholders’ equity 303,700 408,600 490,200
Operating income 168,900 103,500 208,500
Interest expense 7,200 13,200 28,500
Income tax expense 65,400 34,200 72,000
Net income 96,300 56,100 108,000
Operating cash flow 106,300 64,200 115,000
Instructions
a) Calculate the solvency ratios: Debt/Equity, Interest coverage, and Cash flows to
total liabilities for all three years.
b) Write a brief report giving your recommendation on granting the loan. Provide
support for your position.
Solution (15 min.)
12 – 28 Test Bank for Understanding Financial Accounting, Canadian Edition

Financial Statement Analysis 12 – 29
MATCHING
106. Listed below are the names and definitions of various measures used in financial
analysis. Match the names to the definitions by placing the appropriate letter in the
space provided.
NAMES
A. Prospective analysis E. Cross-sectional analysis
F. Operating segment G. Common-size statements
B. Return on equity H. Retrospective analysis
C. Price/earnings ratio I. Current ratio
D. Debt/equity ratio J. Diluted EPS
DEFINITIONS
____ 1. Statements in which each element is expressed as a percentage of some
denominator value
____ 2. Measures what EPS would have been if all securities are converted into
common shares
____ 3. Measures the return on shareholders’ investment
____ 4. Based on historical data only
____ 5. Compares share price with the earnings per share
____ 6. Different business activities with a company
____ 7. A short-term liquidity measure
____ 8. Comparing one company’s performance to another
____ 9. Measures of a firm’s financial leverage
____ 10. Determining the future results of a company
Solution (5 min.)

12 – 30 Test Bank for Understanding Financial Accounting, Canadian Edition
107. Listed below are the names and formulas for various financial ratios. Match the
formulas to the ratio names by placing the appropriate letter in the space provided.
NAMES
A. ROE F. Interest coverage
B. D/E G. A/R turnover
C. Quick ratio H. Current Ratio
D. Inventory turnover I. A/P Turnover
E. ROA
FORMULAS
____ 1. Net income ÷ Average total assets
____ 2. (Net income – preferred dividends) ÷ average shareholders’ equity
____ 3. Cost of goods sold ÷ average inventory
____ 4. Credit sales ÷ average accounts receivable
____ 5. Credit purchases ÷ average accounts payable
____ 6. Current assets ÷ current liabilities
____ 7. (Current assets – inventory – prepaid expenses) ÷ current liabilities
____ 8. Total liabilities ÷ shareholders’ equity
____ 9. (Net income + taxes + interest + depreciation) ÷ interest expense
Solution (5 min.)

Financial Statement Analysis 12 – 31
12 – 32 Test Bank for Understanding Financial Accounting, Canadian Edition
SHORT-ANSWER ESSAY QUESTIONS
108. Below are data taken from the financial statements of two companies in the same
industry:
Football Inc. Hockey Inc.
Total assets $600,000 $600,000
Total liabilities 0 200,000
Total common equity 600,000 400,000
Income before interest & taxes 100,000 100,000
Interest rate on liabilities 10% 10%
Instructions
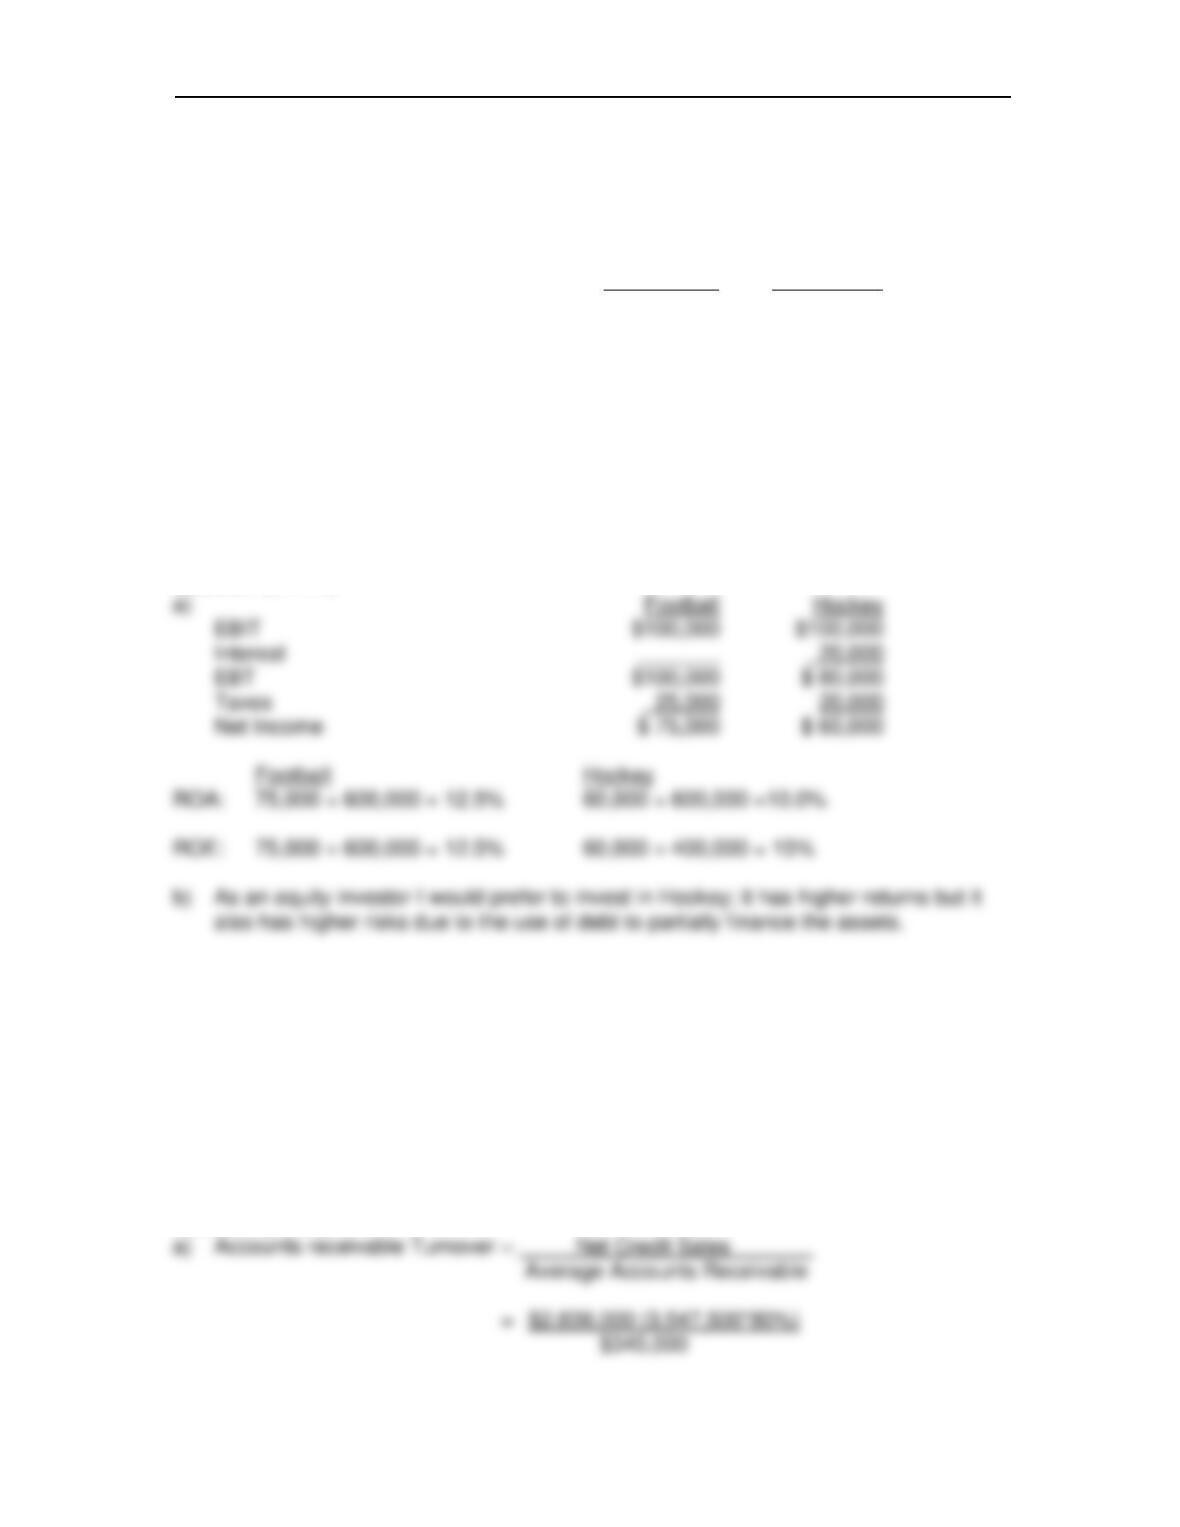
a) Calculate the ROA and ROE for both companies. Assume total assets and equity
have not changed from the previous year.
b) As an equity investor, which company would you prefer to invest in?
Solution (8 min.)
109. In 2016, Olaf Company had total sales of $3,547,500, it is estimated that 80% of
company sales are made on credit and the average balance in the accounts receivable
for the same period was $345,000. The company’s credit terms require that all
receivables be paid within 30 days.
Instructions
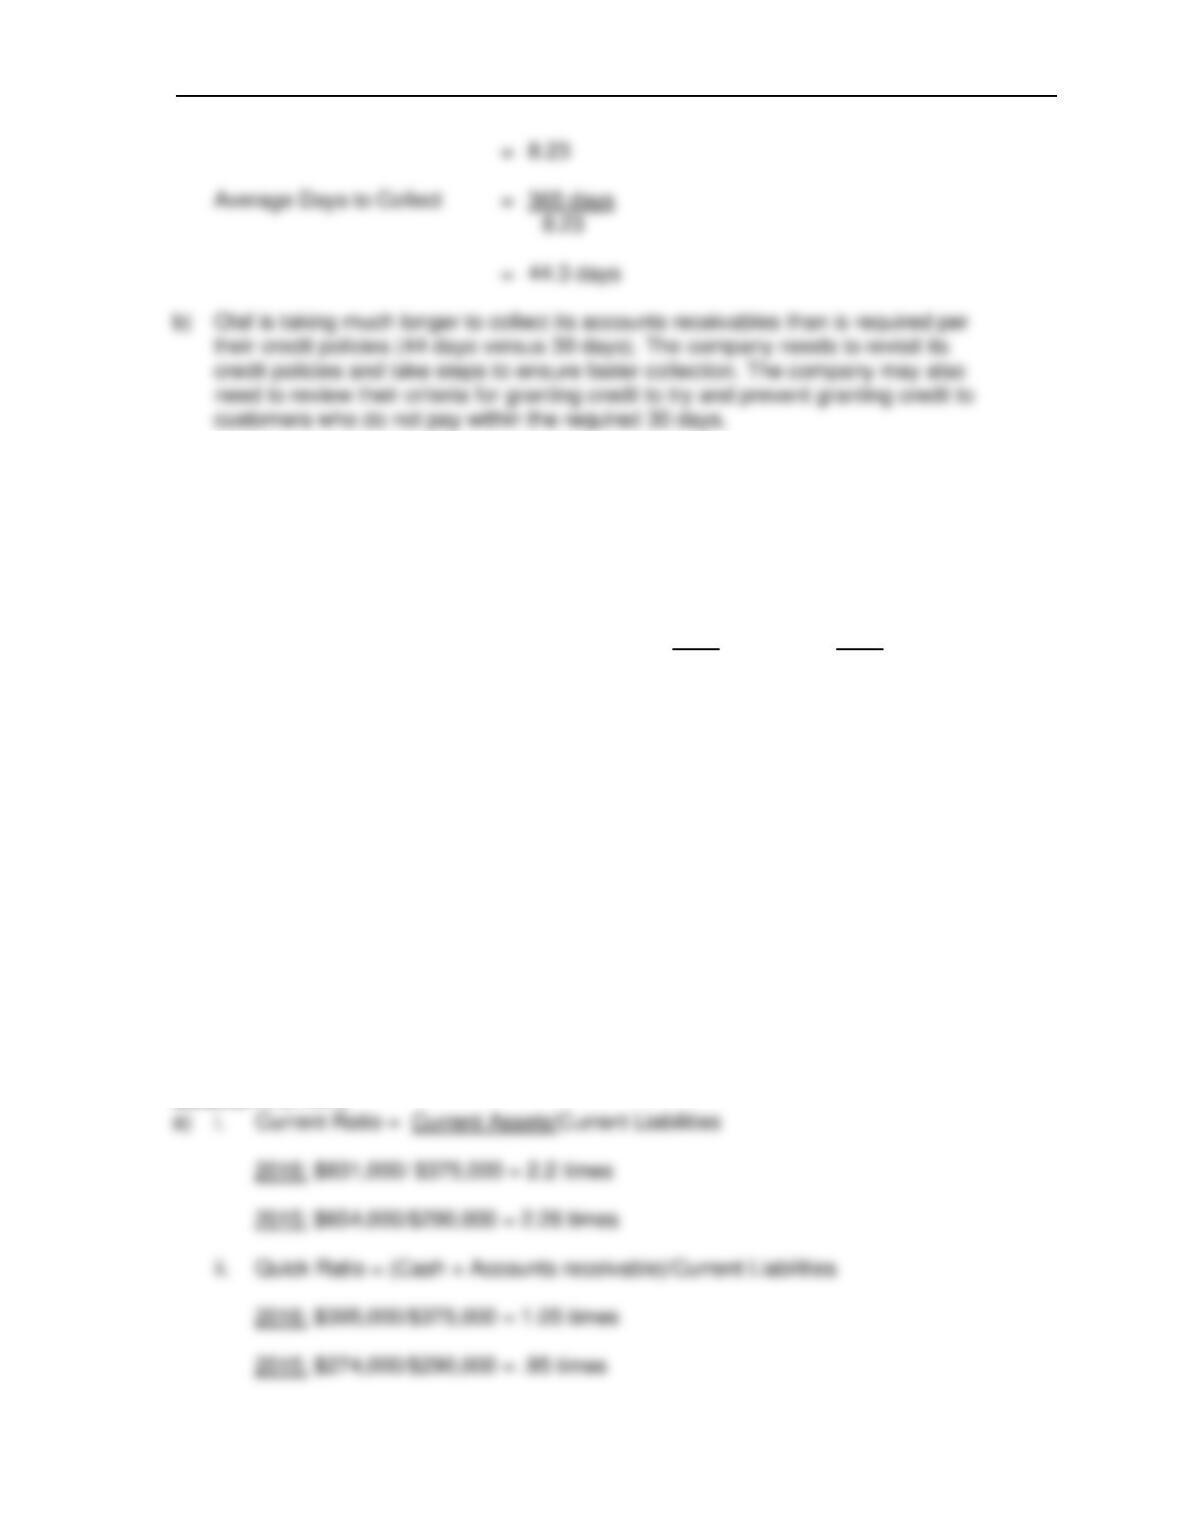
a) Calculate Olaf’s average days to collect accounts receivable.
b) Based on your answer to the above, comment on Olaf’s credit policies.
Solution (7min.)
Financial Statement Analysis 12 – 33
110. Bank of Nova Islands is considering granting a loan to Manitoba Enterprises.
Manitoba Enterprises is a commercial printer and, in anticipation of a major sales
increase expected in the coming year, has applied for a one-year loan of $100,000 to
finance an expansion of its inventory. The following excerpts are from Manitoba’s 2016
Statement of Financial Position:
Current Assets 2016 2015
Cash $ 45,000 $ 24,000
Accounts receivable 350,000 250,500
Inventory 424,000 368,000
Prepaid expenses 12,000 12,000
Current Liabilities 375,000 290,000
Instructions
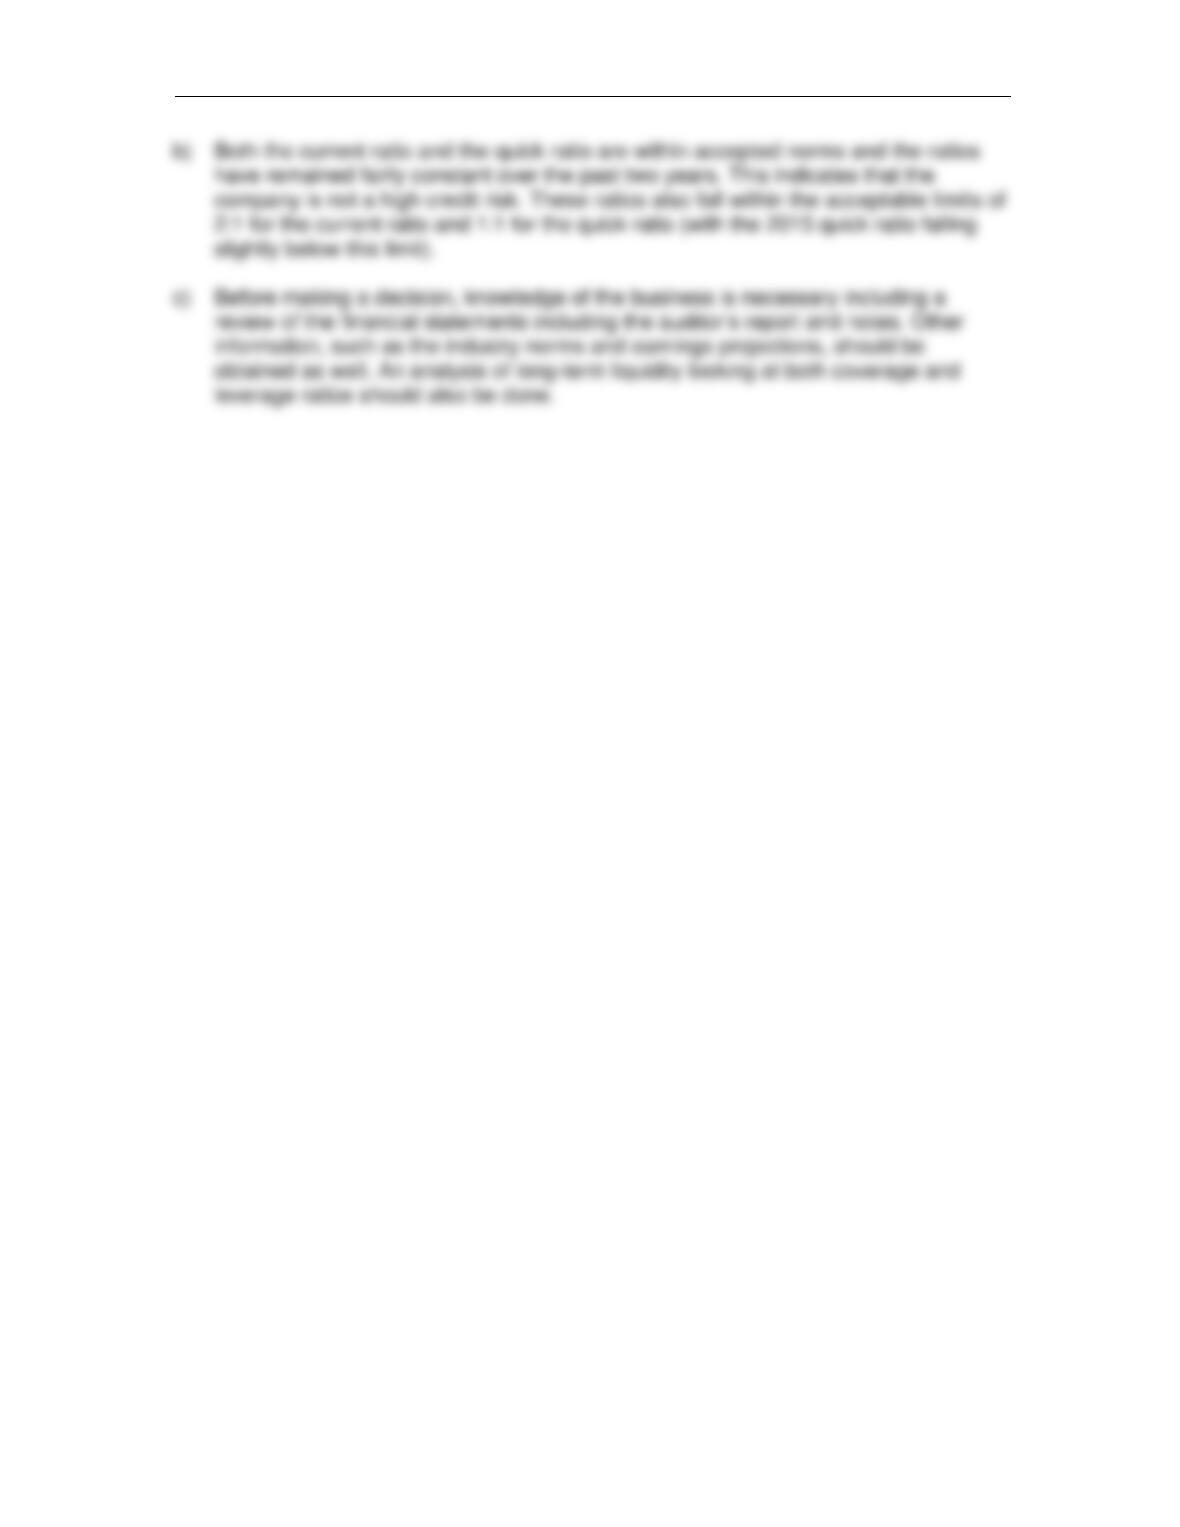
a) Calculate the following ratios for Manitoba for the years ended December 31, 2015,
and 2016:
i. Current ratio
ii. Quick ratio
b) Based on your calculations, comment on whether you would recommend granting
the loan.
c) What steps should you undertake before making your decision and is there other
information you would like to have?
Solution (10 min.)
12 – 34 Test Bank for Understanding Financial Accounting, Canadian Edition
Financial Statement Analysis 12 – 35
ESSAY QUESTIONS
111. Many people think that financial statements analysis is the process of calculating
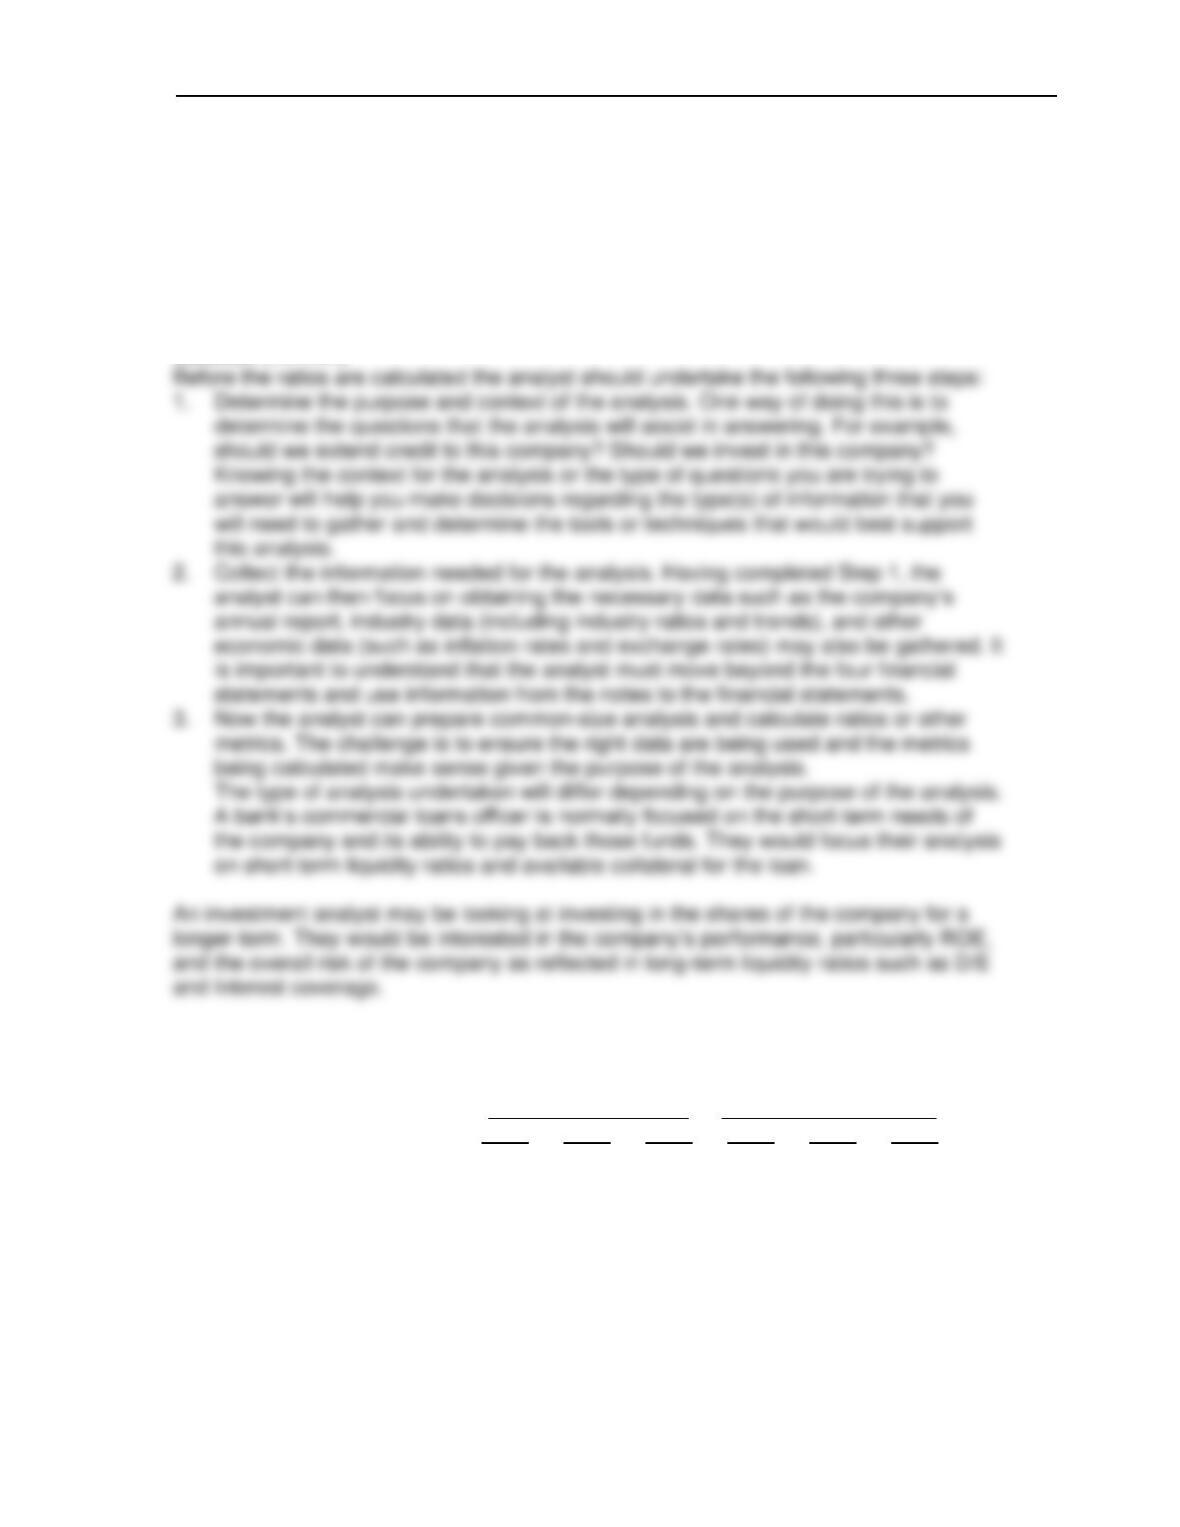
ratios for a company. Outline the steps necessary for an analyst to undertake before
calculating the ratios. Explain how the type of analysis might differ for a bank’s
commercial loans officer and an investment analyst.
Solution (10 min.)
112. Presented below are a series of financial ratios for two companies in the same
industry:
Home Decor Inc. Pier Creations Co.__
2014 2015 2016 2014 2015 2016
Inventory turnover 11.8 13.6 15.5 8.4 8.5 8.0
Accts. receivable turnover 15.1 14.5 16.0 10.5 10.2 10.6
Current ratio 2.2 2.0 2.1 2.2 2.9 3.6
Quick ratio 1.3 1.2 1.1 1.7 2.3 2.8
Instructions
Write an analysis of the two companies. Include any comments you might have about
their relative ability to manage their current assets and to meet their current obligations.
12 – 36 Test Bank for Understanding Financial Accounting, Canadian Edition
Solution (10 min.)
Financial Statement Analysis 12 – 37
LEGAL NOTICE