Managerial Decision Modeling w/ Spreadsheets, 3e (Balakrishnan/Render/Stair)
Chapter 12 Inventory Control Models
12.1 Chapter Questions
Use this information to answer the following questions.
A bakery buys sugar in 15-pound bags. The bakery uses 5000 bags of sugar each year. Carrying costs are $20
per bag per year. Ordering costs are estimated at $5 per order. Assume that the bakery is open 250 days a year
and its daily demand is estimated at 20 bags. It takes 5 days for each order of sugar to be filled.
1) Refer to the information above. What is the optimal EOQ?
A) 200 bags
B) 5000 bags
C) 2500 bags
D) 100 bags
E) 50 bags
2) Refer to the information above. What is the maximum inventory held in a given EOQ cycle?
A) 5000 bags
B) 200 bags
C) 50
D) 100 bags
E) 15 bags
3) Refer to the information above. What is the minimum inventory held in a given EOQ cycle?
A) 0 bags
B) 2500 bags
C) 50 bags
D) 25 bags
E) 100 bags
4) Refer to the information above. What is the total cost of ordering and carrying sugar?
A) $50
B) $100
C) $25
D) $1000
E) $500
5) Refer to the information above. What is the optimal number of orders per year?
A) 200
B) 100
C) 500
D) 300
E) 400
6) Refer to the information above. What is the average inventory held in a given cycle?
A) 0
B) 50
C) 25
D) 100
E) 75
7) Refer to the information above. What are the total annual holding costs?
A) $500
B) $1000
C) $20
D) $750
E) $250
8) Refer to the information above. What is the Reorder point (ROP)?
A) 20
B) 100
C) 5
D) 500
E) 15
Use this information to answer the following questions.
A cake factory can produce cakes at the rate of 500 per day. The factory supplies its cakes to local grocery
stores at a rate of 250 per day. The cost to prepare the equipment for producing the cakes is $20. Annual
holding costs are $2 per cake. Assume that the factory operates 250 days a year.
9) Refer to the information above. What is the optimal EPQ?
A) 1389
B) 1425.68
C) 1250.27
D) 1000
E) 1581.14
10) Refer to the information above. What is the optimal number of yearly setups?
A) 43.25
B) 37
C) 45
D) 47.94
E) 39.53
11) Refer to the information above. What is the maximum inventory held in a given cycle?
A) 825.56
B) 790.57
C) 800
D) 900.39
E) 750.44
12) Refer to the information above. What is the length of a production cycle in days?
A) 3.2
B) 4.1
C) 2.7
D) 5.3
E) 4.9
13) Refer to the information above. What are the total annual setup and holding costs?
A) $1267.83
B) $1456.12
C) $1581.14
D) $1390.78
E) $1100.45
14) Which of the following is NOT considered to be a part of carrying costs?
A) insurance
B) spoilage
C) obsolescence
D) theft
E) inspection
15) The Z-value for a desired service level of 0.95 is ________.
A) 1.28
B) 1.65
C) 1.96
D) 2.33
E) 2.58
16) If the standard deviation of demand is 10 and the desired service level is 0.90, then what is the safety stock?
A) 9
B) 10
C) 12.8
D) 16.5
E) 23.3
17) Processing and inspecting incoming inventory are considered ordering cost factors.
18) The optimal Economic Order Quantity (EOQ) minimizes the sum of ordering and purchasing costs.
19) Spoilage is considered to be a part of carrying cost.
20) The Economic Order Quantity (EOQ) formula assumes that all input data are known with certainty.
21) The Economic Production Quantity (EPQ) model assumes instantaneous replenishment.
22) The optimal Economic Production Quantity (EPQ) minimizes the sum of set up and carrying costs.
23) The C group items in ABC analysis require closer monitoring than the A group items.
24) In the Economic Order Quantity (EOQ) model, the maximum amount of inventory held in a given cycle is
the optimal order quantity Q*.
25) Inspection of purchased goods for quality upon arrival is an example of holding cost.
26) The EPQ model is primarily concerned with the timing of orders.
27) The average inventory level is inversely/negatively related to order size.
28) When demand is constant, the Reorder point (ROP) is a function of demand and lead time.
7
29) Safety stock is usually held only when demand is uncertain.
30) In a quantity discount model, the choice of order quantity must be the EOQ.
31) Quantity discounts give customers a price incentive to buy in larger quantities.
32) Loss of goodwill must be included in stockout costs.
33) In the ABC analysis, the A group items are the least critical.
12.2 Excel Problems
1) A local ice cream shop sells 10,000 cones of vanilla-flavored ice cream each year. The cones are ordered
from an outside supplier and it takes 5 days for each shipment of cones to arrive. Ordering costs are estimated
at $15 per order. Carrying costs are $5 per cone per year. Assume that the ice cream shop is open 250 days a
year.
a. What is the optimal EOQ for ice cream cones?
b. What is the total cost of ordering and carrying the ice cream cones?
c. What is the maximum inventory of cones held in a given ordering cycle?
d. What is the average inventory held in a given ordering cycle?
e. What is the reorder point (ROP)?
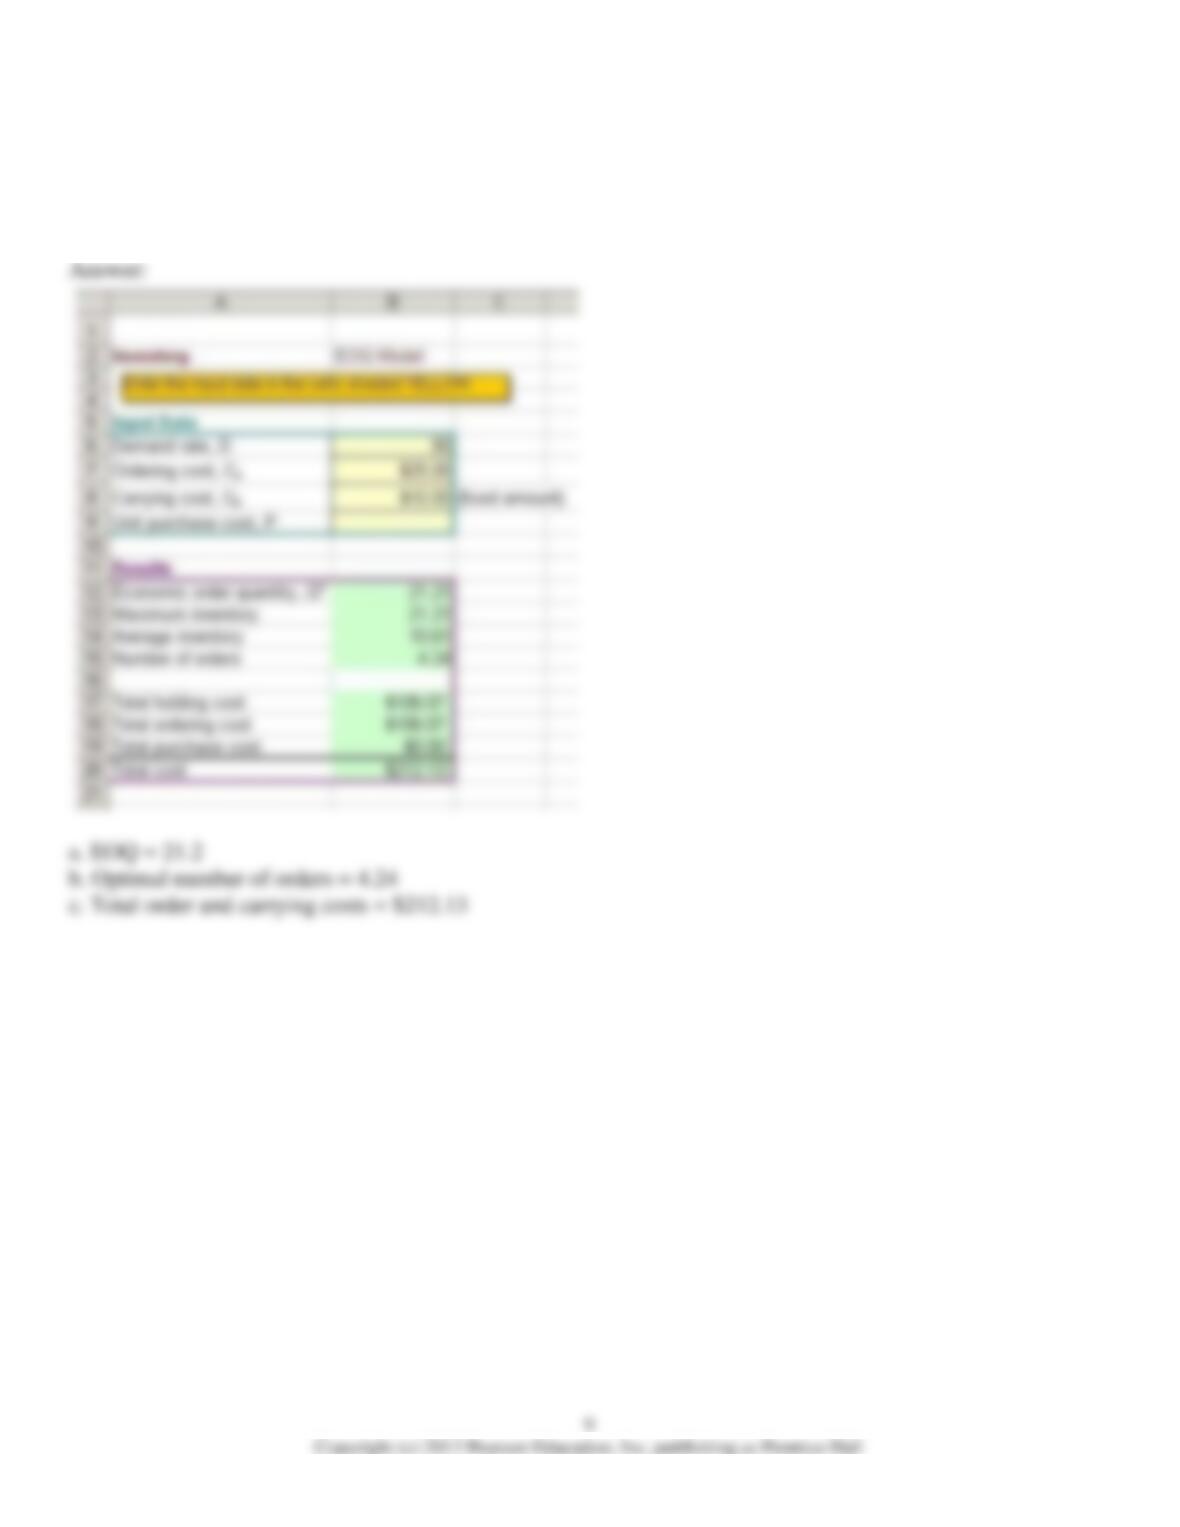
2) A shoe store sells 90 pairs of shoes each month. Each pair carried in stock incurs a holding cost of $10 per
month. Each order costs approximately $25 in shipping and receiving.
a. What is the optimal EOQ?
b. What is the optimal number of orders per month?
c. What are the total ordering and carrying costs?
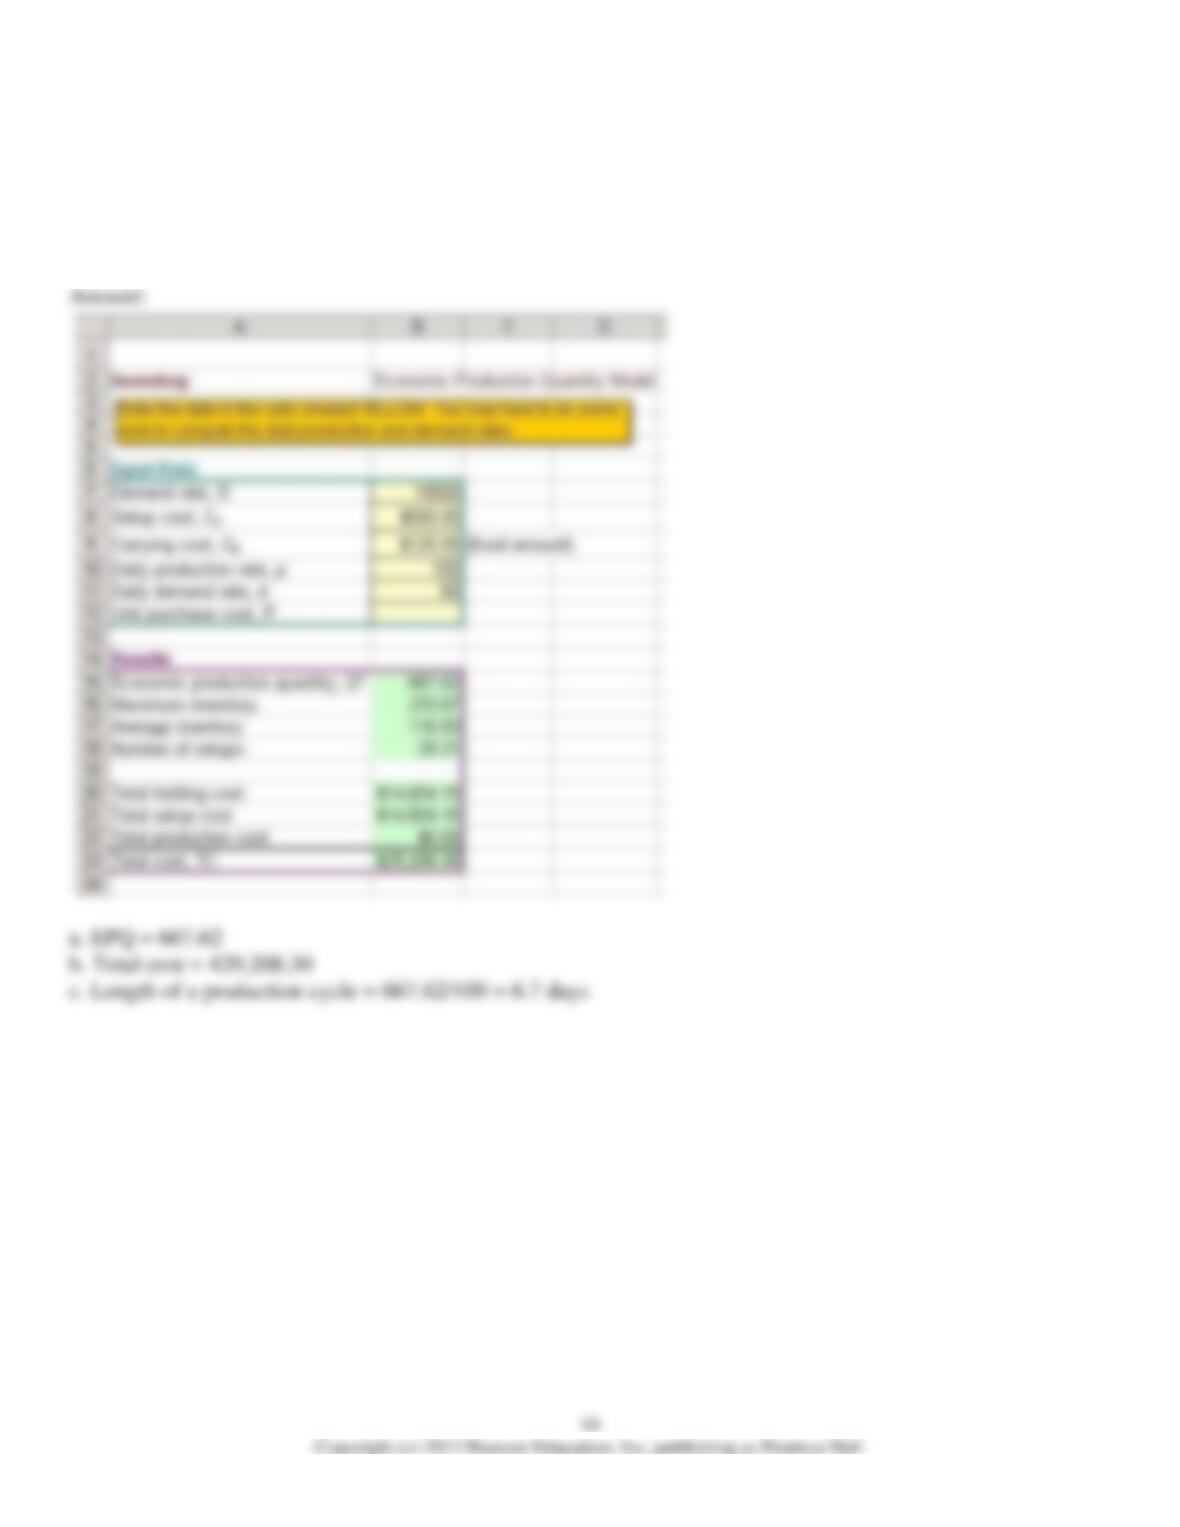
3) A computer manufacturer can produce laptops at the rate of 100 per day. The manufacturer supplies its
laptops to various computer retail outlets at a rate 65 per day. Set up cost for a production run is $500.
Carrying cost is $125 per laptop a year. Assume the manufacturer operates 300 days a year.
a. What is the optimal production run size?
b. What is the minimum total annual cost for carrying and set up?
c. What is the length of a production run?
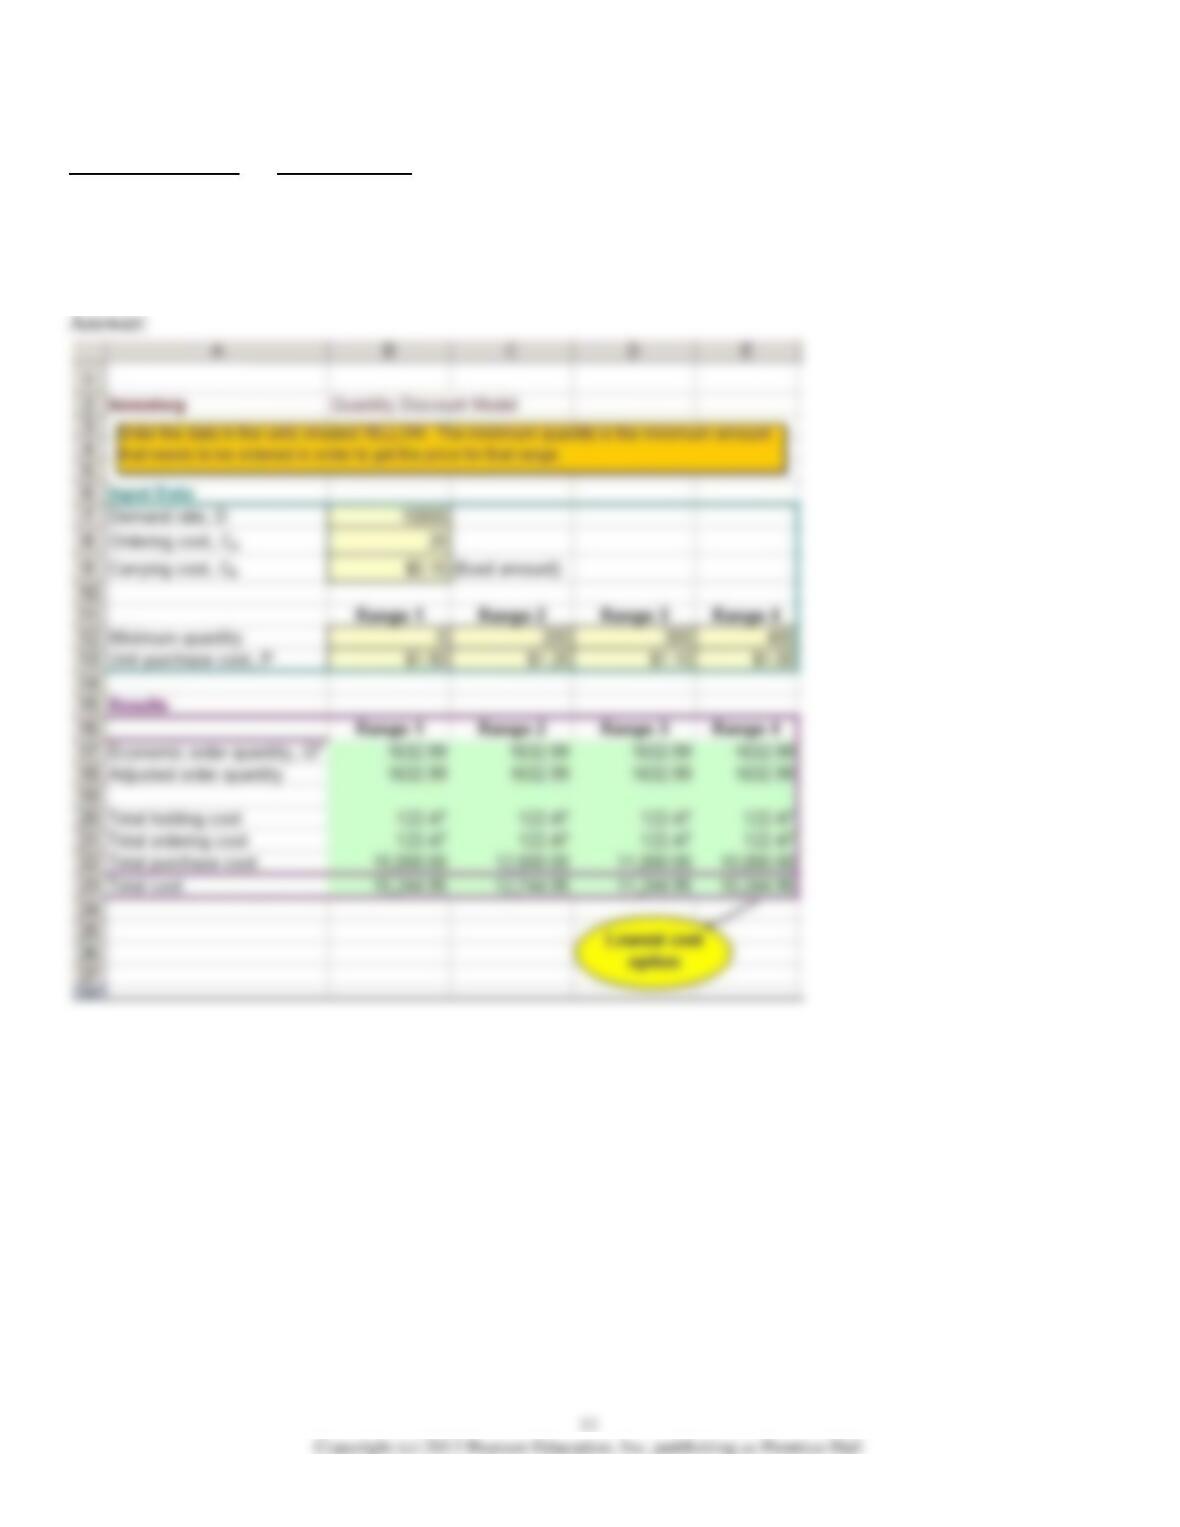
4) A local post office uses 10,000 boxes a year. Carrying costs are 15 cents per box a year, and ordering costs
are $20 per order. The following price schedule applies. What is the optimal order quantity?
Number of Boxes Price per Box
0 – 199 $1.50
200 – 299 $1.25
300 – 399 $1.10
400 or more $1.00
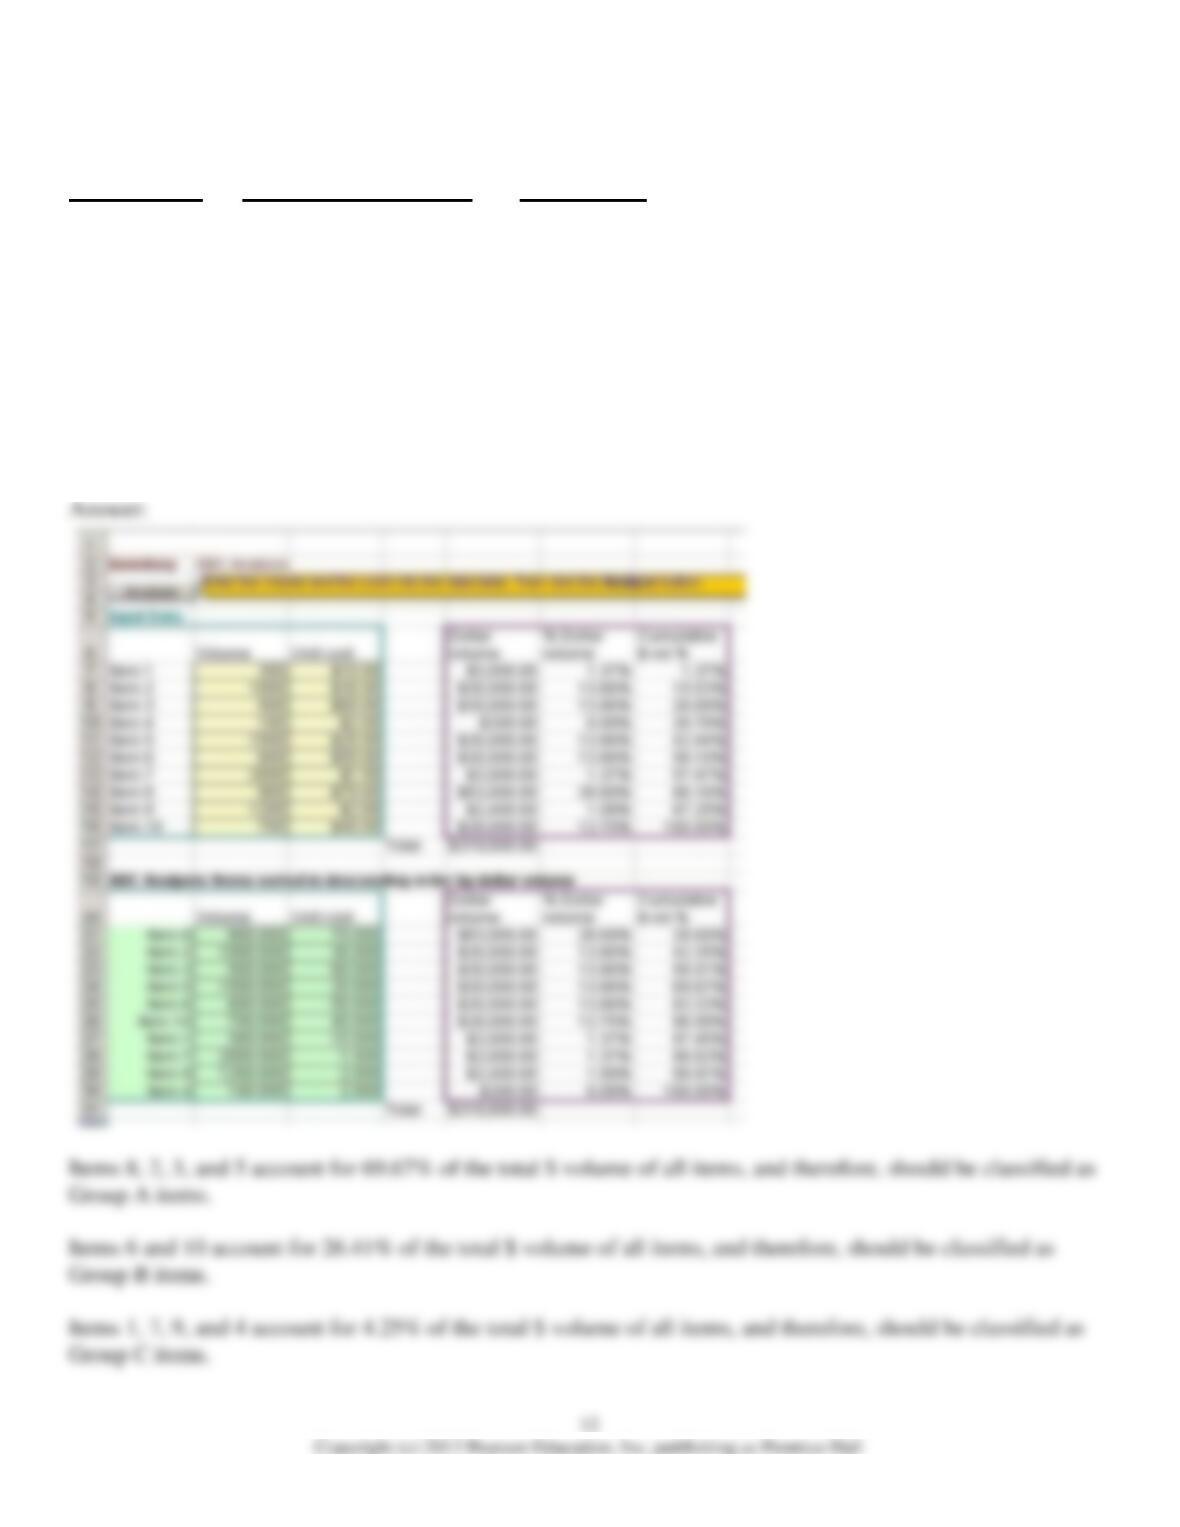
5) A small toy store has organized its 10 inventory items on an annual dollar-volume basis. The information
below shows the items, their annual demands, and unit costs. How should the store classify these items into
groups A, B, and C?
Item Number Annual Volume (Units) Unit Cost ($)
Item 1 300 $10
Item 2 1000 $30
Item 3 500 $60
Item 4 100 $2
Item 5 1500 $20
Item 6 600 $50
Item 7 2000 $1.50
Item 8 900 $70
Item 9 1200 $2.00
Item 10 700 $40
13
6) A grocery store is aiming for a 95% service level for 1 gallon bottles of whole milk. The mean demand
during lead time is 200 with a standard deviation of 40. Milk has a carrying cost of $0.50 per unit per year. How
much safety stock should the grocery store maintain in milk and what is the reorder point?
Answer: