The Costs of Production 3357
Scenario 13–22
Suppose that a small hair styling salon had revenues of $150,000 in a given year. The owner spent
$10,000 on
utilities, $60,000 on supplies (shampoo, conditioner, hair coloring and other chemicals,
etc.), and $50,000 on
equipment (mirrors, chairs, scissors, curling irons, etc.), including
maintenance. The owner could have earned $50,000 working at another salon.
11.
Refer to Scenario 13–22. What is the accounting profit for the hair styling salon?
12.
Refer to Scenario 13–22. What is the economic profit for the hair styling salon?
3358 The Costs of Production
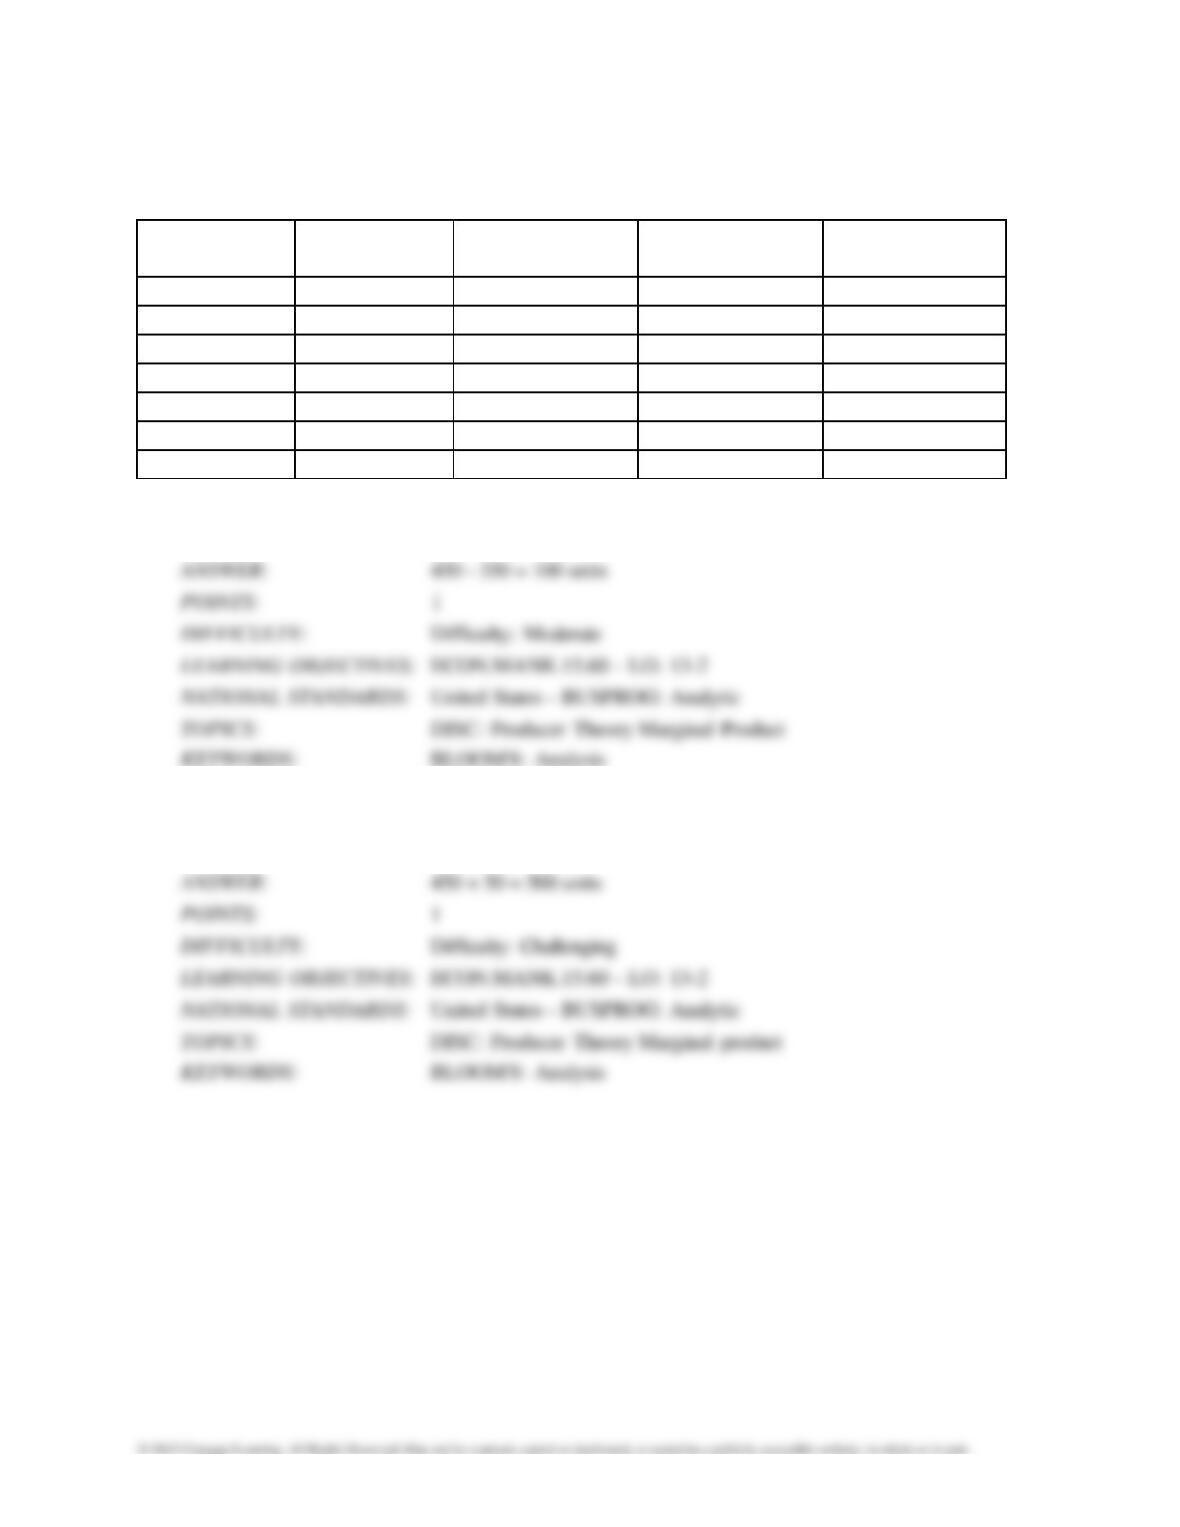
Table 13–18
Labor
Output
Marginal
Product
Variable
Cost
Fixed
Cost
0
0
—
$0
$10
1
200
200
$20
$10
2
350
$40
$10
3
450
$60
$10
4
50
$80
$10
5
25
$100
$10
6
530
$120
$10
13.
Refer to Table 13–18. What is the marginal product of the third worker?
14.
Refer to Table 13–18. What is the total output of four workers?
15.
Refer to Table 13–18. What is the total output of five workers?
16.
Refer to Table 13–18. What is the marginal product of the sixth worker?
17.
Refer to Table 13–18. What is the shape of the firm’s total-cost curve?
18.
Refer to Table 13–18. What is the average total cost of producing 525 units of output?
19.
Refer to Table 13–18. What is the average variable cost of producing 500 units of output?
20.
Refer to Table 13–18. What is the average fixed cost of producing 450 units of output?
21.
Refer to Table 13–18. What is the shape of the average-fixed-cost curve?
22.
Refer to Table 13–18. What is the shape of the average-variable-cost curve?
23.
Refer to Table 13–18. What is the shape of the average-total-cost curve?
24.
Refer to Table 13–18. What is the shape of the marginal-cost curve?
3362 The Costs of Production
Table 13–19
Labor
Output
Marginal
Product
Variable
Cost
Fixed
Cost
0
0
—
$0
$5
1
100
100
$5
$5
2
250
$10
$5
3
350
$15
$5
4
50
$20
$5
5
25
$25
$5
6
430
$30
$5
25.
Refer to Table 13–19. What is the marginal product of the second worker?
26.
Refer to Table 13–19. What is the total output of five workers?
27.
Refer to Table 13–19. What is the marginal product of the sixth worker?
28.
Refer to Table 13–19. What is the shape of the marginal-cost curve?
29.
Refer to Table 13–19. What is the shape of this firm’s total-cost curve?

30.
Refer to Table 13–19. What is the average total cost of producing 425 units of output?
31.
Refer to Table 13–19. What is the average variable cost of producing 400 units of output?
32.
Refer to Table 13–19. What is the average fixed cost of producing 430 units of output?
33.
Refer to Table 13–19. What is the shape of the average-fixed-cost curve?
34.
Refer to Table 13–19. What is the shape of the average-variable-cost curve?
35.
Refer to Table 13–19. What is the shape of the average-total-cost curve?
36.
Describe the relationship between average total cost and marginal cost.
37.
Describe the relationship between average variable cost and marginal cost.
38.
Describe the general shape of the average-fixed-cost curve.
39.
Describe the relationship between average variable cost and average total cost. How are the
general shapes of the
AVC and ATC curves related?
40.
Average variable cost will decrease if .
41.
Average total cost will increase if .
42.
How can the average-fixed-cost curve be declining when fixed cost is constant?
43.
The average-fixed-cost curve is always declining. How does this affect the relationship between
the AVC and ATC
curves?
44.
Describe the difference between the short run and the long run.
45.
What might cause economies of scale?
46.
What might cause diseconomies of scale?
47.
Suppose that Danita owns a cupcake bakery. In the short run, at least one of her inputs is fixed.
Provide one or two
examples of the types of inputs that could be fixed in the short run.
48.
Describe how an accounting firm could experience economies of scale.
49.
Describe how a study group of economics students could experience economies of scale as they
study for an
economics exam.
50.
Describe how an accounting firm could experience diseconomies of scale.