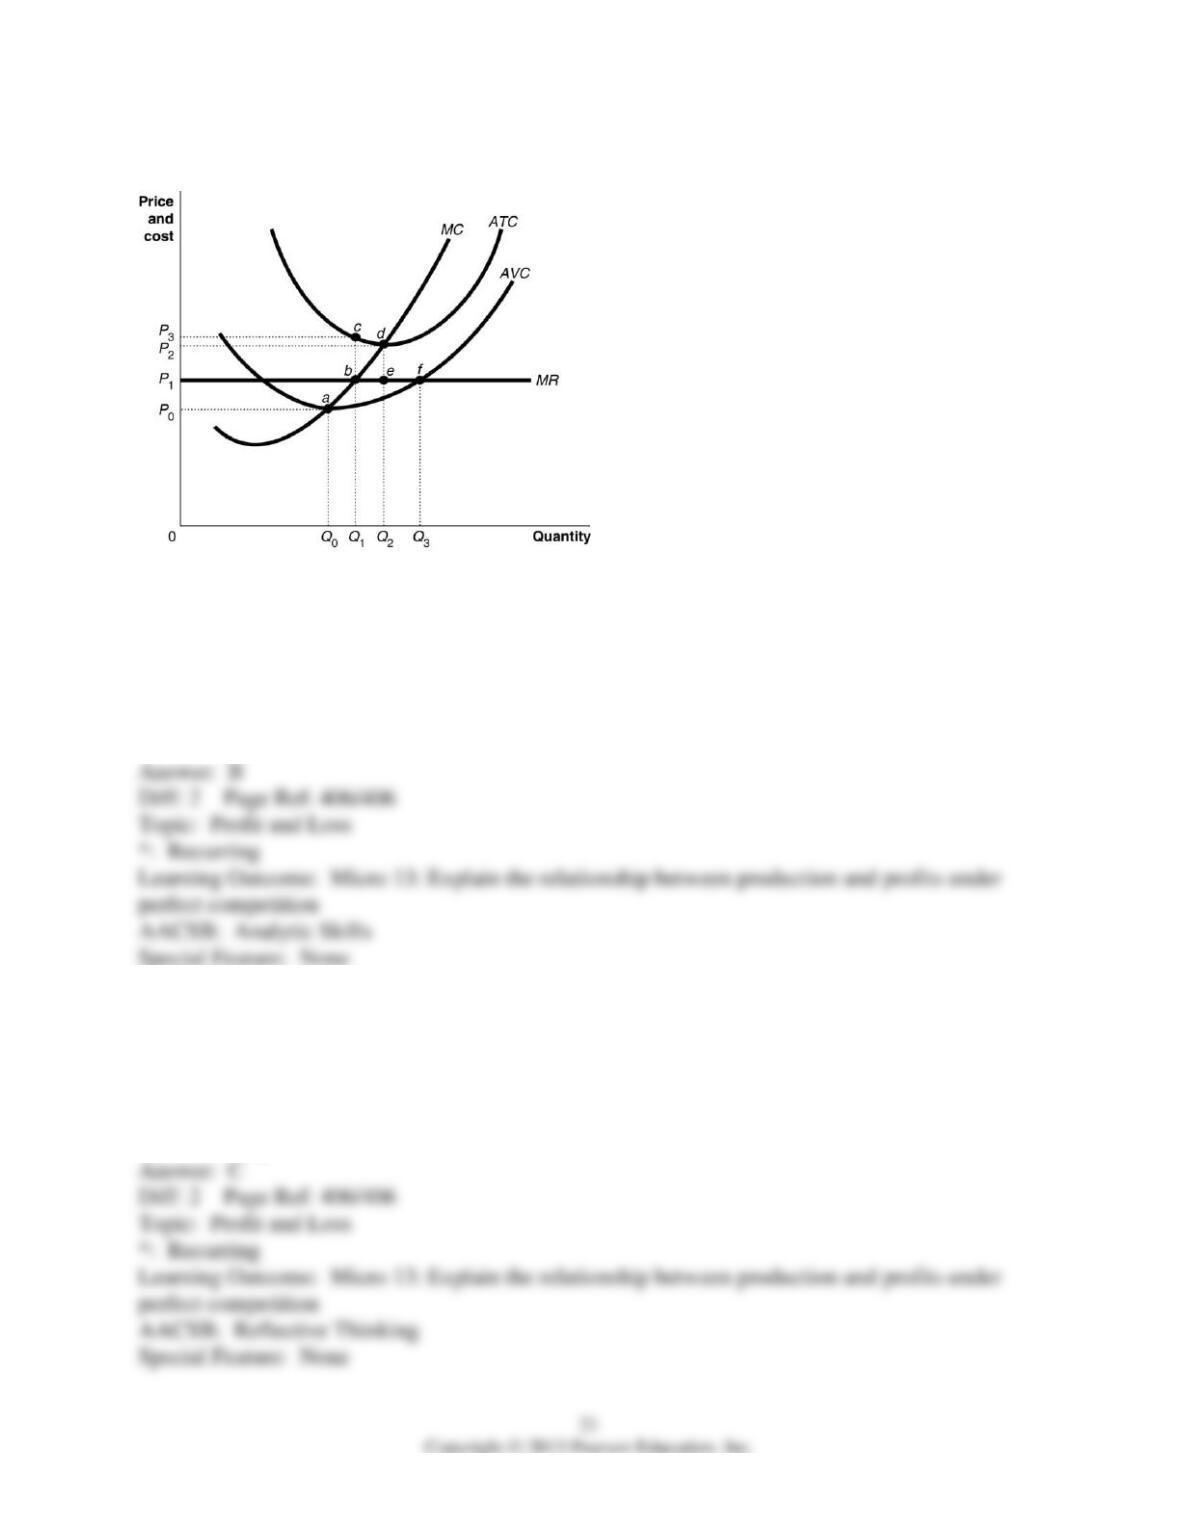
Figure 12-3
3) Refer to Figure 12-3. Suppose the prevailing price is P1 and the firm is currently producing
its loss-minimizing quantity. Identify the area that represents the loss.
A) P2 deP1
B) P3cbP1
C) P3caP0
D) 0P1 bQ1
4) If a perfectly competitive firm’s price is less than its average total cost but greater than its
average variable cost, the firm
A) is earning a profit.
B) should shut down.
C) is incurring a loss.
D) is breaking even.
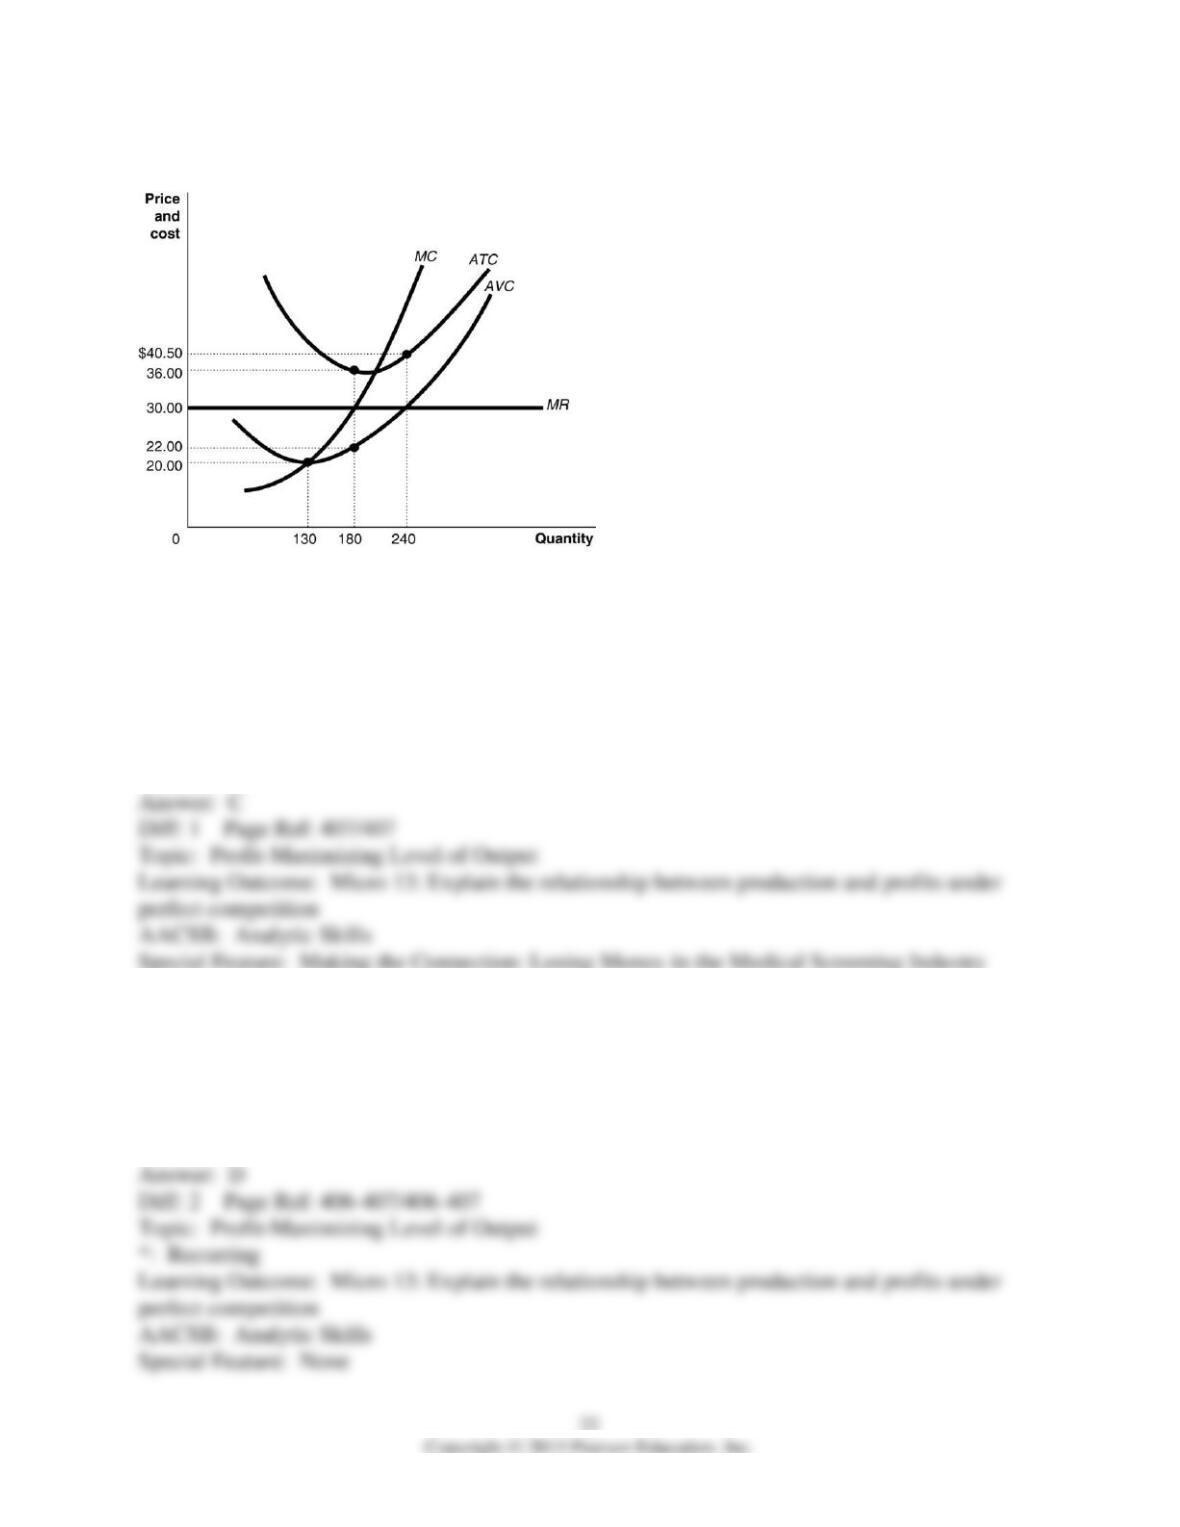
Figure 12-4
Figure 12-4 shows the cost and demand curves for a profit-maximizing firm in a perfectly
competitive market.
5) Refer to Figure 12-4. If the market price is $30, the firm’s profit-maximizing output level is
A) 0.
B) 130.
C) 180.
D) 240.
6) Refer to Figure 12-4. If the market price is $30 and if the firm is producing output, what is the
amount of its total variable cost?
A) $7,200
B) $6,480
C) $5,400
D) $3,960
7) Refer to Figure 12-4. What is the amount of its total fixed cost?
A) $1,080
B) $1,440
C) $2,520
D) It cannot be determined.
8) Refer to Figure 12-4. If the market price is $30 and the firm is producing output, what is the
amount of the firm’s profit or loss?
A) loss of $1,080
B) profit of $1,440
C) loss of $2,520
D) profit of $1,300
9) Refer to Figure 12-4. If the market price is $30, should the firm represented in the diagram
continue to stay in business?
A) No, it should shut down because it is making a loss.
B) No, it should shut down because it cannot cover its variable cost.
C) Yes, because it is covering part of its fixed cost.
D) Yes, because it is making a profit.
10) A perfectly competitive firm earns a profit when price is
A) equal to minimum average total cost.
B) above minimum average total cost.
C) equal to minimum average variable cost.
D) equal to minimum average fixed cost.
11) All of the following can be used to compute average profit except
A) marginal profit minus marginal cost.
B) total profit divided by quantity.
C) average revenue minus average total cost
D) price minus average total cost.
12) An increase in demand for U.S. farm exports will ________ the market prices for these
exports and ________ economic profit in these markets.
A) increase; decrease
B) increase; decrease
C) increase; increase
D) decrease; decrease
13) Assume that after a banner year in U.S. farm exports in 2011, farmers are expected to break
even in 2012. This means that at the quantity being produced in 2012,
A) MC =AVC.
B) MR =MC.
C) MR =ATC.
D) AVC =ATC.
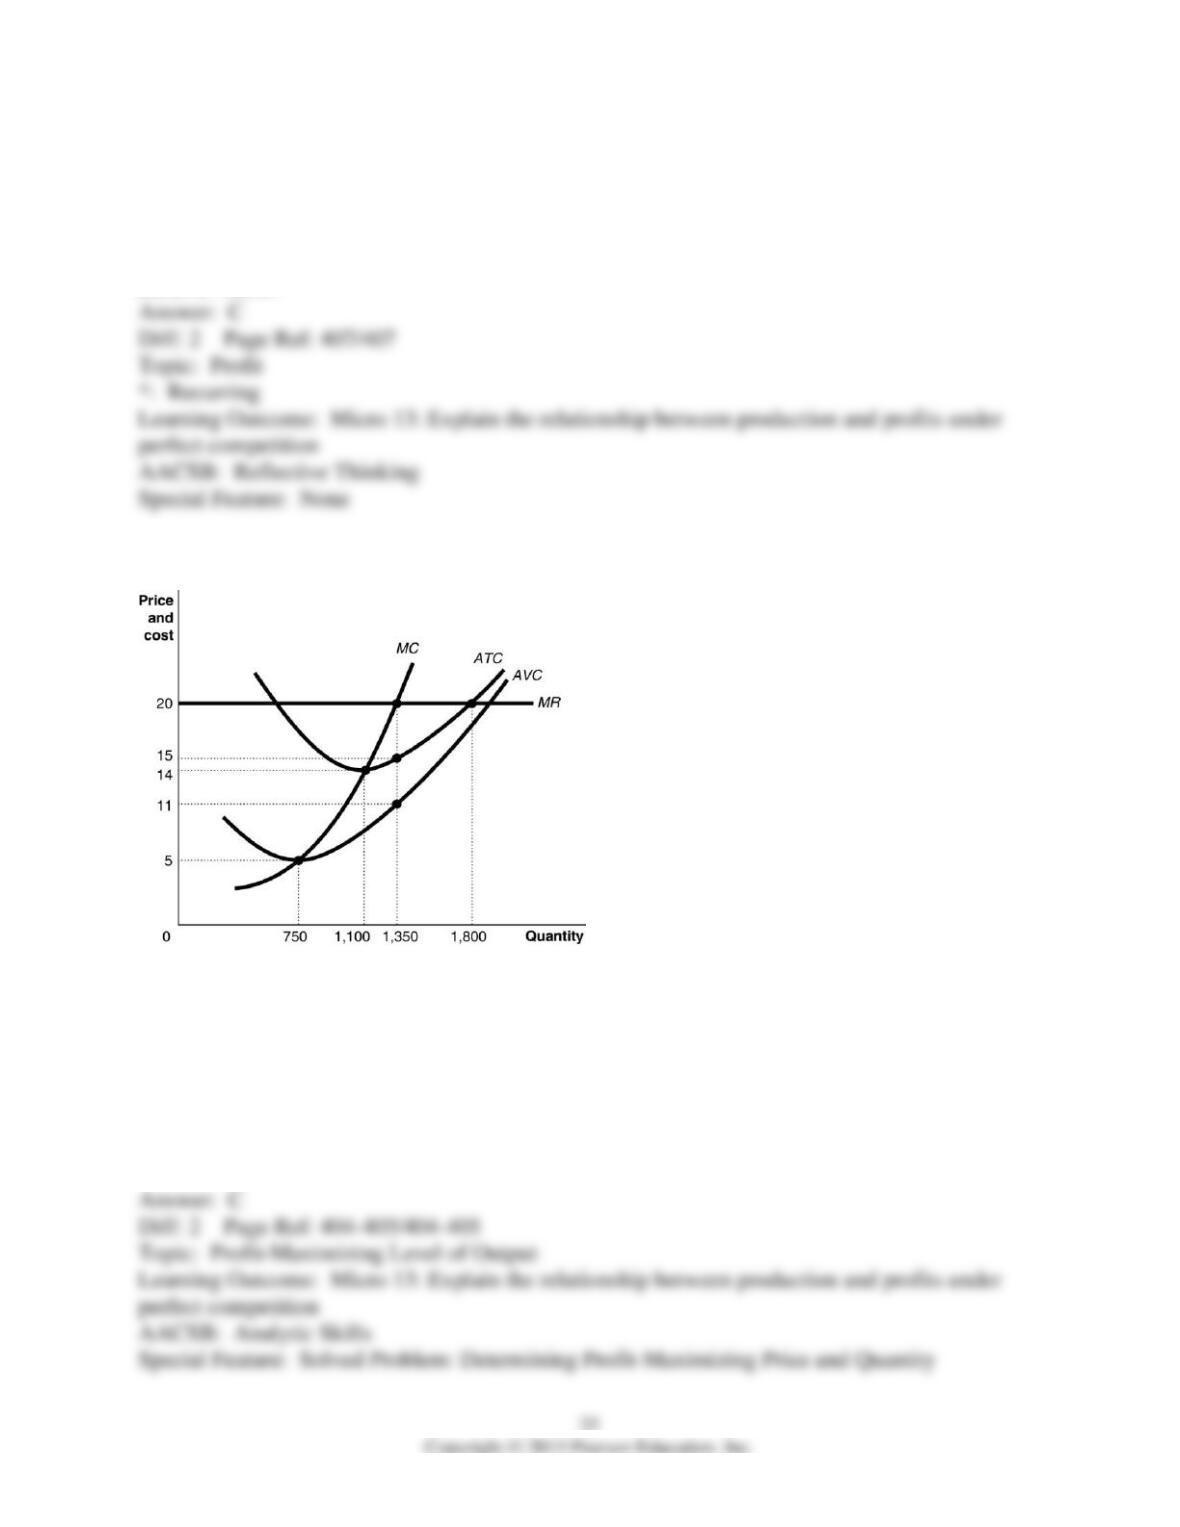
Figure 12-5
Figure 12-5 shows cost and demand curves facing a typical firm in a constant-cost, perfectly
competitive industry.
14) Refer to Figure 12-5. If the market price is $20, what is the firm’s profit-maximizing output?
A) 750 units
B) 1,100 units
C) 1,350 units
D) 1,800 units
15) Refer to Figure 12-5. If the market price is $20, what is the amount of the firm’s profit?
A) $5,400
B) $6,750
C) $8,100
D) $16,200
16) Refer to Figure 12-5. If the market price is $20, what is the average profit at the profit-
maximizing quantity?
A) $5
B) $6
C) $9
D) $20
17) Refer to Figure 12-5. The firm’s manager suggests that the firm’s goal should be to
maximize average profit. In that case, what is the output level and what is the average profit that
will achieve the manager’s goal?
A) Q = 1,350 units, average profit =$5
B) Q = 1,100 units, average profit =$6
C) Q = 1,350 units, average profit =$9
D) Q = 1,800 units, average profit =$20
18) Refer to Figure 12-5. The firm’s manager suggests that the firm’s goal should be to
maximize average profit. If the firm does this, what is the amount of profit that it will earn?
A) $6,600
B) $6,750
C) $12,150
D) $36,000
19) Refer to Figure 12-5. What is the amount of the firm’s fixed cost of production?
A) $5,400
B) $6,750
C) $8,100
D) It cannot be determined.
20) Refer to Figure 12-5. If the firm’s fixed cost increases by $1,000 due to a new environmental
regulation, what happens in the diagram above?
A) All the cost curves shift upward.
B) Only the average variable cost and average total cost curves shift upward; marginal cost is not
affected.
C) Only the average total cost curve shifts upward; the marginal cost and average variable cost
curves are not affected.
D) None of the curves shifts; only the fixed cost curve, which is not shown here, is affected.
21) Refer to Figure 12-5. The figure shows the cost structure of a firm in a perfectly competitive
market. If the firm’s fixed cost increases by $1,000 due to a new environmental regulation, what
happens to its profit-maximizing output level?
A) It increases.
B) It decreases.
C) It remains the same.
D) It could increase, decrease or remain constant, depending on whether the firm is able to cut
costs somewhere else.
22) Refer to Figure 12-5. What is the minimum price the firm requires to produce output?
A) $20
B) $14
C) $5
D) It cannot be determined
23) A perfectly competitive firm breaks even at a price equal to its minimum average total cost.
24) Maximizing average profit is equivalent to maximizing total profit.
25) In the short run, if price falls below a firm’s minimum average total cost, the firm should shut
down.
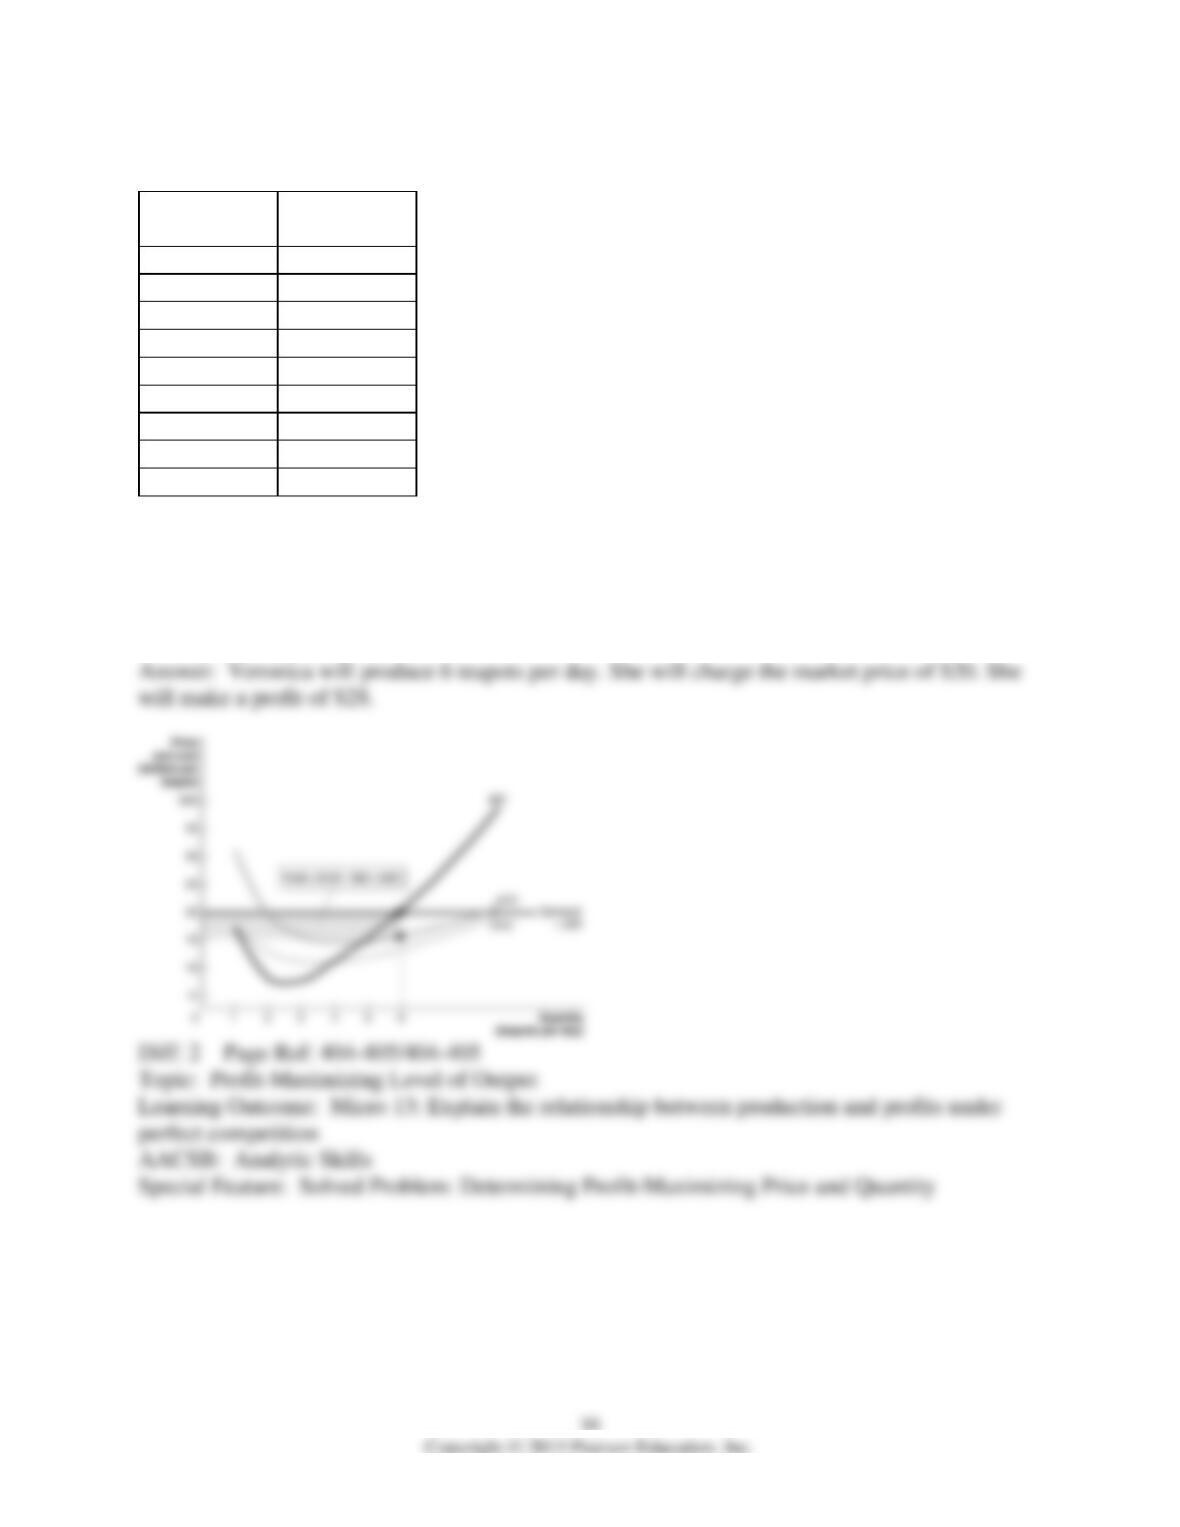
26) Suppose Veronica sells teapots in the perfectly competitive teapot market. Her output per
day and her costs are as follows:
Output per
Day
Total Cost
0
$20
1
32
2
37
3
48
4
61
5
75
6
92
7
113
8
136
Suppose the current equilibrium price in the teapot market is $20. To maximize profit, how many
teapots will Veronica produce, what price will she charge, and how much profit (or loss) will she
make? Draw a graph to illustrate your answer. Your graph should include Veronica’s demand,
ATC, AVC, MC, and MR curves, the price she is charging, the quantity she is producing, and the
area representing her profit (or loss).
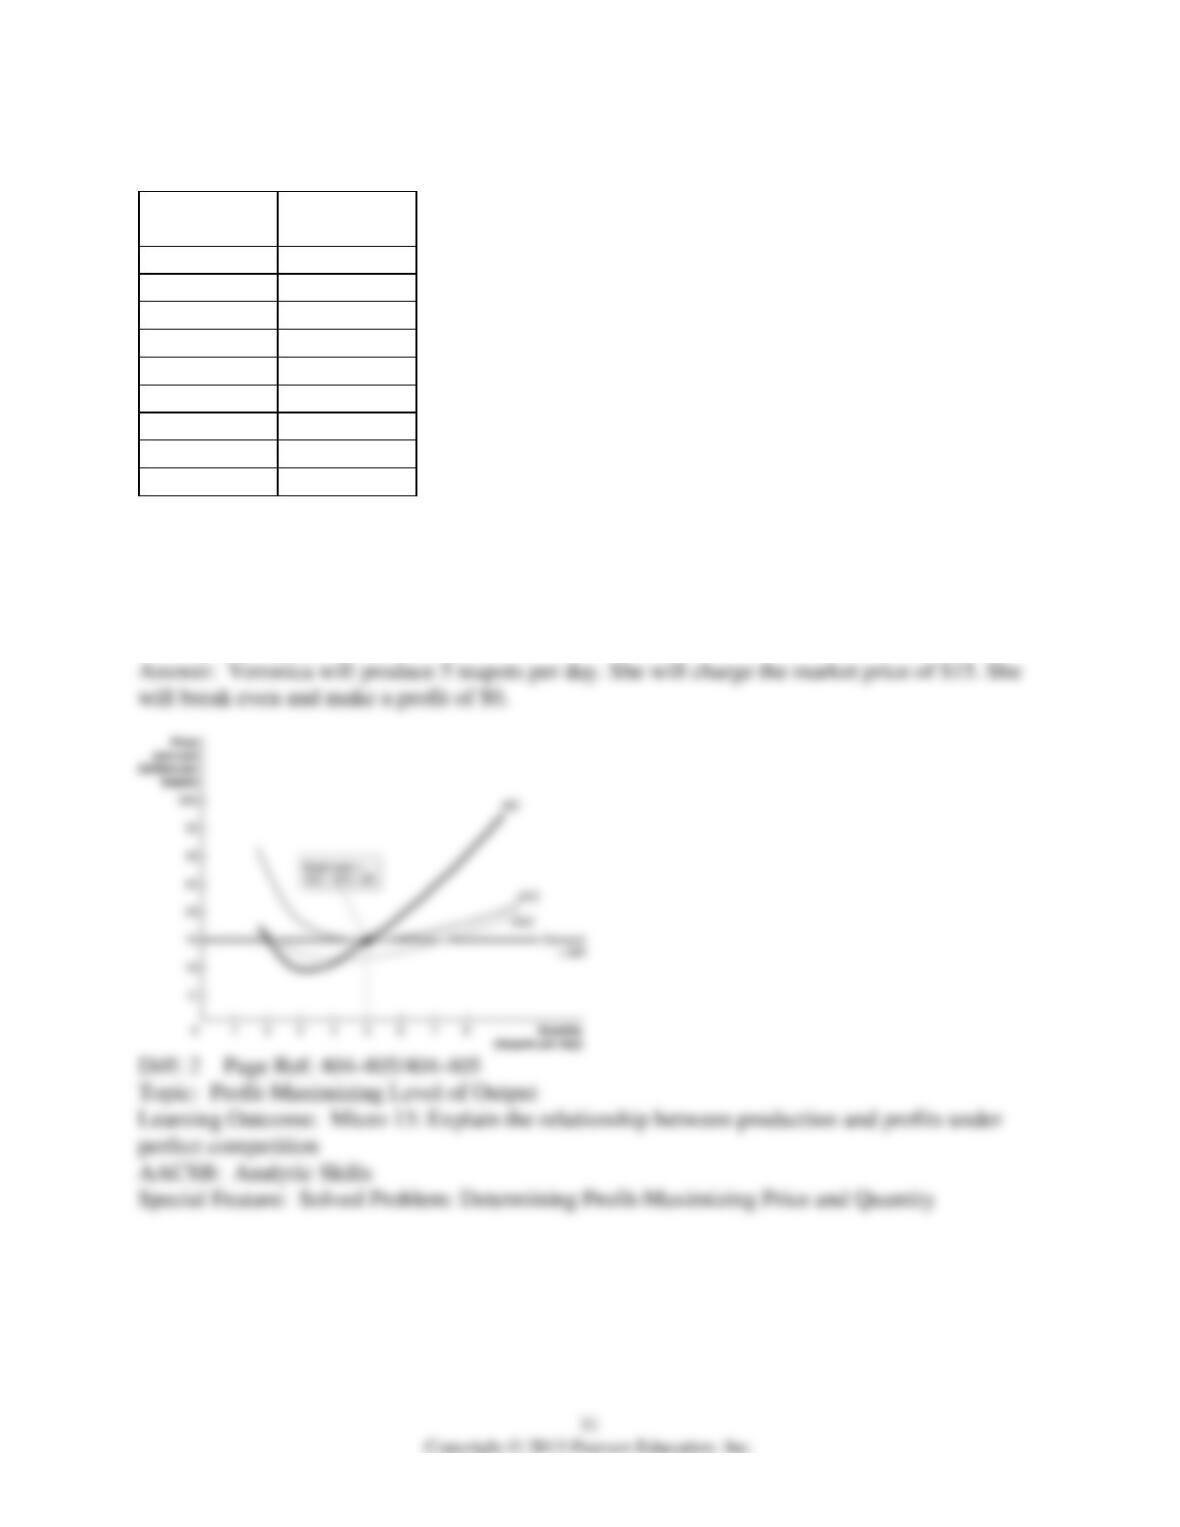
27) Suppose Veronica sells teapots in the perfectly competitive teapot market. Her output per
day and her costs are as follows:
Output per
Day
Total Cost
0
$20
1
32
2
37
3
48
4
61
5
75
6
92
7
113
8
136
Suppose the current equilibrium price in the teapot market is $15. To maximize profit, how many
teapots will Veronica produce, what price will she charge, and how much profit (or loss) will she
make? Draw a graph to illustrate your answer. Your graph should include Veronica’s demand,
ATC, AVC, MC, and MR curves, the price she is charging, the quantity she is producing, and the
area representing her profit (or loss).
12.4 Deciding Whether to Produce or to Shut Down in the Short Run
1) If, for a given output level, a perfectly competitive firm’s price is less than its average variable
cost, the firm
A) is earning a profit.
B) should shut down.
C) should increase output.
D) should increase price.
2) A perfectly competitive firm’s supply curve is its
A) marginal cost curve.
B) marginal cost curve above its minimum average total cost.
C) marginal cost curve above its minimum average variable cost.
D) marginal cost curve above its minimum average fixed cost.
3) When a perfectly competitive firm finds that its market price is below its minimum average
variable cost, it will sell
A) the output where marginal revenue equals marginal cost.
B) any positive output the entrepreneur decides upon because all of it can be sold.
C) nothing at all; the firm shuts down.
D) the output where average total cost equals price.
4) Max Shreck, an accountant, quit his $80,000-a-year job and bought an existing tattoo parlor
from its previous owner, Sylvia Sidney. The lease has five years remaining and requires a
monthly payment of $4,000. The lease
A) is a fixed cost of operating the tattoo parlor.
B) is a variable cost of operating the tattoo parlor.
C) is an implicit cost of operating the tattoo parlor.
D) is part of the marginal cost of operating the tattoo parlor.
5) Max Shreck, an accountant, quit his $80,000-a-year job and bought an existing tattoo parlor
from its previous owner, Sylvia Sidney. The lease has five years remaining and requires a
monthly payment of $4,000. Max’s explicit cost amounts to $3,000 per month more than his
revenue. Should Max continue operating his business?
A) Max’s explicit cost exceeds his total revenue. He should shut down his tattoo parlor.
B) Max should continue to run the tattoo parlor until his lease runs out.
C) If Max’s marginal revenue is greater than or equal to his marginal cost, then he should stay in
business.
D) This cannot be determined without information on his revenue.
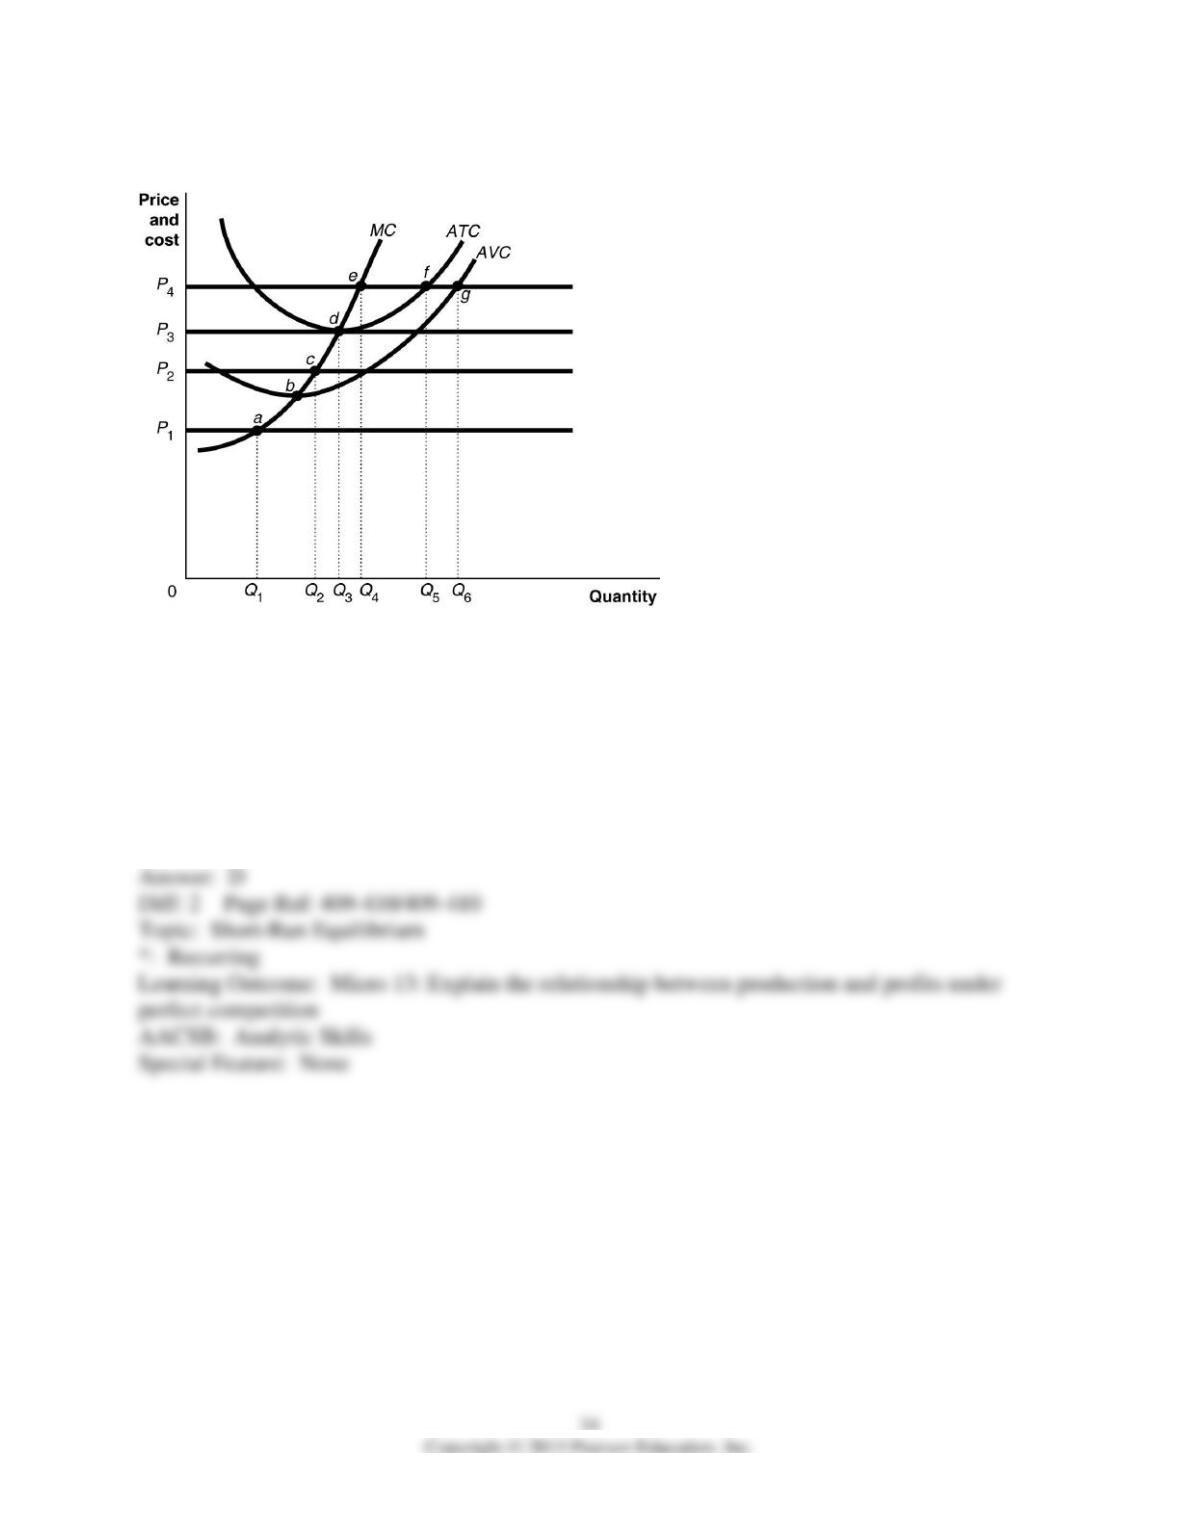
Figure 12-6
Figure 12-6 shows cost and demand curves facing a profit-maximizing, perfectly competitive
firm.
6) Refer to Figure 12-6. At price P1, the firm would produce
A) Q1 units
B) Q3 units.
C) Q5 units.
D) zero units.

7) Refer to Figure 12-6. At price P1, the firm would
A) lose an amount equal to its fixed cost.
B) lose an amount more than fixed cost.
C) lose an amount less than fixed cost.
D) break even.
8) Refer to Figure 12-6. At price P2, the firm would produce
A) Q2 units.
B) Q3 units.
C) Q4 units.
D) zero units.
9) Refer to Figure 12-6. At price P2, the firm would
A) lose an amount equal to its fixed cost.
B) lose an amount more than fixed cost.
C) lose an amount less than fixed cost.
D) break even.
10) Refer to Figure 12-6. At price P3, the firm would produce
A) Q2 units
B) Q3 units.
C) Q4 units.
D) Q5 units.
11) Refer to Figure 12-6. At price P3, the firm would
A) lose an amount equal to its fixed cost.
B) lose an amount more than fixed cost.
C) lose an amount less than fixed cost.
D) break even.
12) Refer to Figure 12-6. At price P4, the firm would produce
A) Q3 units.
B) Q4 units.
C) Q5 units.
D) Q6 units.
13) Refer to Figure 12-6. At price P4, the firm would
A) lose an amount equal to its fixed cost.
B) make a profit.
C) lose an amount less than fixed cost.
D) make a normal profit.
14) Refer to Figure 12-6. Identify the short-run shut down point for the firm.
A) a
B) b
C) c
D) d
15) Refer to Figure 12-6. Identify the firm’s short-run supply curve.
A) the marginal cost curve
B) the marginal cost curve from a and above
C) the marginal cost curve from b and above
D) the marginal cost curve from d and above
16) Market supply is found by
A) vertically summing the relevant part of each individual producer’s marginal cost curve.
B) horizontally summing the relevant part of each individual producer’s marginal cost curve.
C) vertically summing each individual producer’s average total cost curve.
D) horizontally summing each individual producer’s average total cost curve.
17) If total variable cost exceeds total revenue at all output levels, a perfectly competitive firm
A) should produce in the short run.
B) is making short-run profits.
C) should shut down in the short run.
D) has covered its fixed cost.
18) If total revenue exceeds fixed cost, a firm
A) should produce in the short run.
B) has covered its variable cost.
C) is making short-run profits.
D) may or may not produce in the short run, depending on whether total revenue covers variable
cost.
19) If a firm shuts down in the short run,
A) its loss equals zero.
B) its loss equals its fixed cost.
C) is makes zero economic profit.
D) its total revenue is not large enough to cover its fixed cost.
20) A perfectly competitive firm produces 3,000 units of a good at a total cost of $36,000. The
fixed cost of production is $20,000. The price of each good is $10. Should the firm continue to
produce in the short run?
A) No, it should shut down because it is making a loss.
B) Yes, it should continue to produce because its price exceeds its average fixed cost.
C) Yes, it should continue to produce because it is minimizing its loss.
D) There is insufficient information to answer the question.
21) In the short run, a firm that incurs losses might choose to produce rather than shut down if
the amount of its revenue is less than its fixed cost.
22) In the short run, if a firm shuts down it avoids its variable cost but not its fixed cost.
23) In the short run, if a firm shuts down its maximum loss equals the amount of its fixed cost.
24) The minimum point on the average variable cost curve is called the loss-minimizing point.
25) If a firm’s fixed cost exceeds its total revenue, the firm should stop production by shutting
down temporarily.