71. The ability of a business to pay its debts as they come due and to earn a reasonable amount of income is
referred to as:
72. Drucker Dynamics, Inc.
The current assets section of the balance sheets of Drucker Dynamics as of December 31, 2012 and 2011, is
presented below.
2012
2011
Cash
$ 80,800
$ 64,600
Account
s
receivabl
e, net
163,600
199,300
Inventor
y
216,000
261,200
Other
current
assets
20,700
17,800
Total Current Assets
481,100
542,900
Total Assets
$3,167,000
$3,947,000
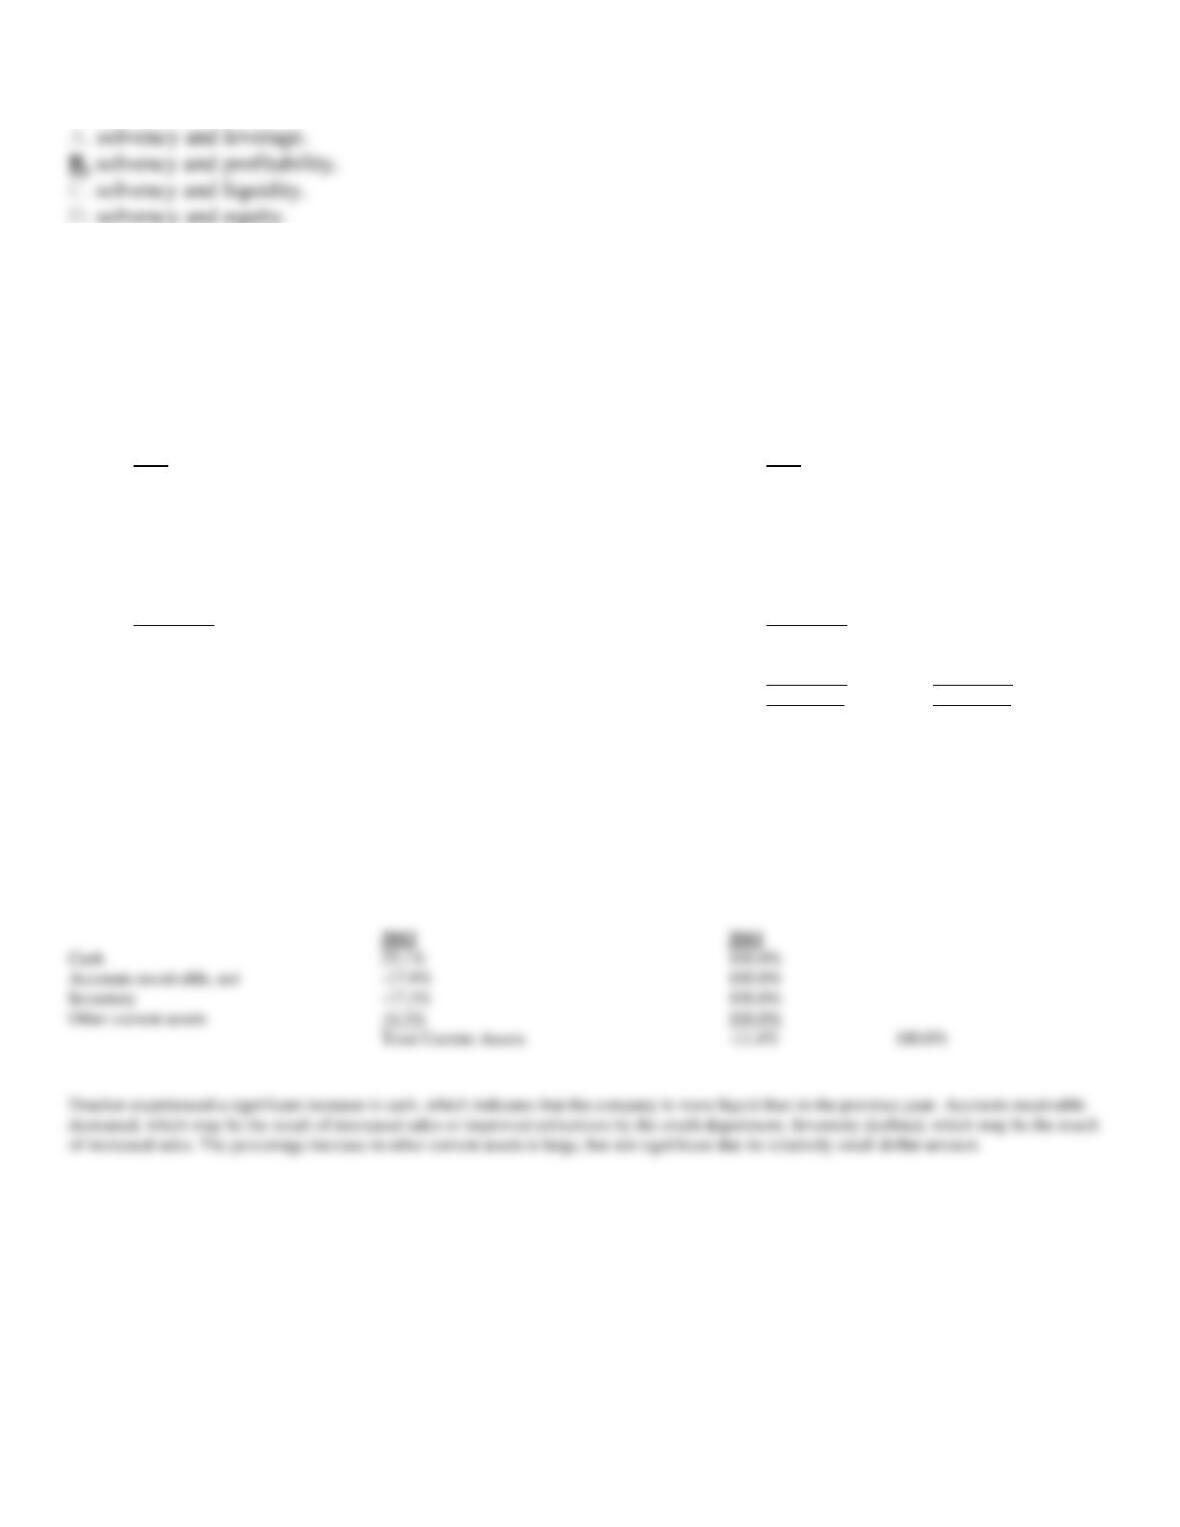
Refer to the information provided for Drucker Dynamics. Complete a common-size horizontal analysis of the current assets section of Drucker’s
balance sheet for 2012. Your answers should be expressed as percentages and rounded to one decimal place. Provide a short explanation of this
analysis.
2012
2011
Cash
25.1%
100.0%
Inventory
-17.3%
100.0%
Other current assets
16.3%
100.0%
Total Current Assets
-11.4%
100.0%
73. Drucker Dynamics, Inc.
The current assets section of the balance sheets of Drucker Dynamics as of December 31, 2012 and 2011, is
presented below.
2012
2011
Cash
$ 80,800
$ 64,600
Accounts receivable, net
163,600
199,300
Inventory
216,000
261,200
Other current assets
20,700
17,800
Total Current Assets
481,100
542,900
Total Assets
$3,167,000
$3,947,000
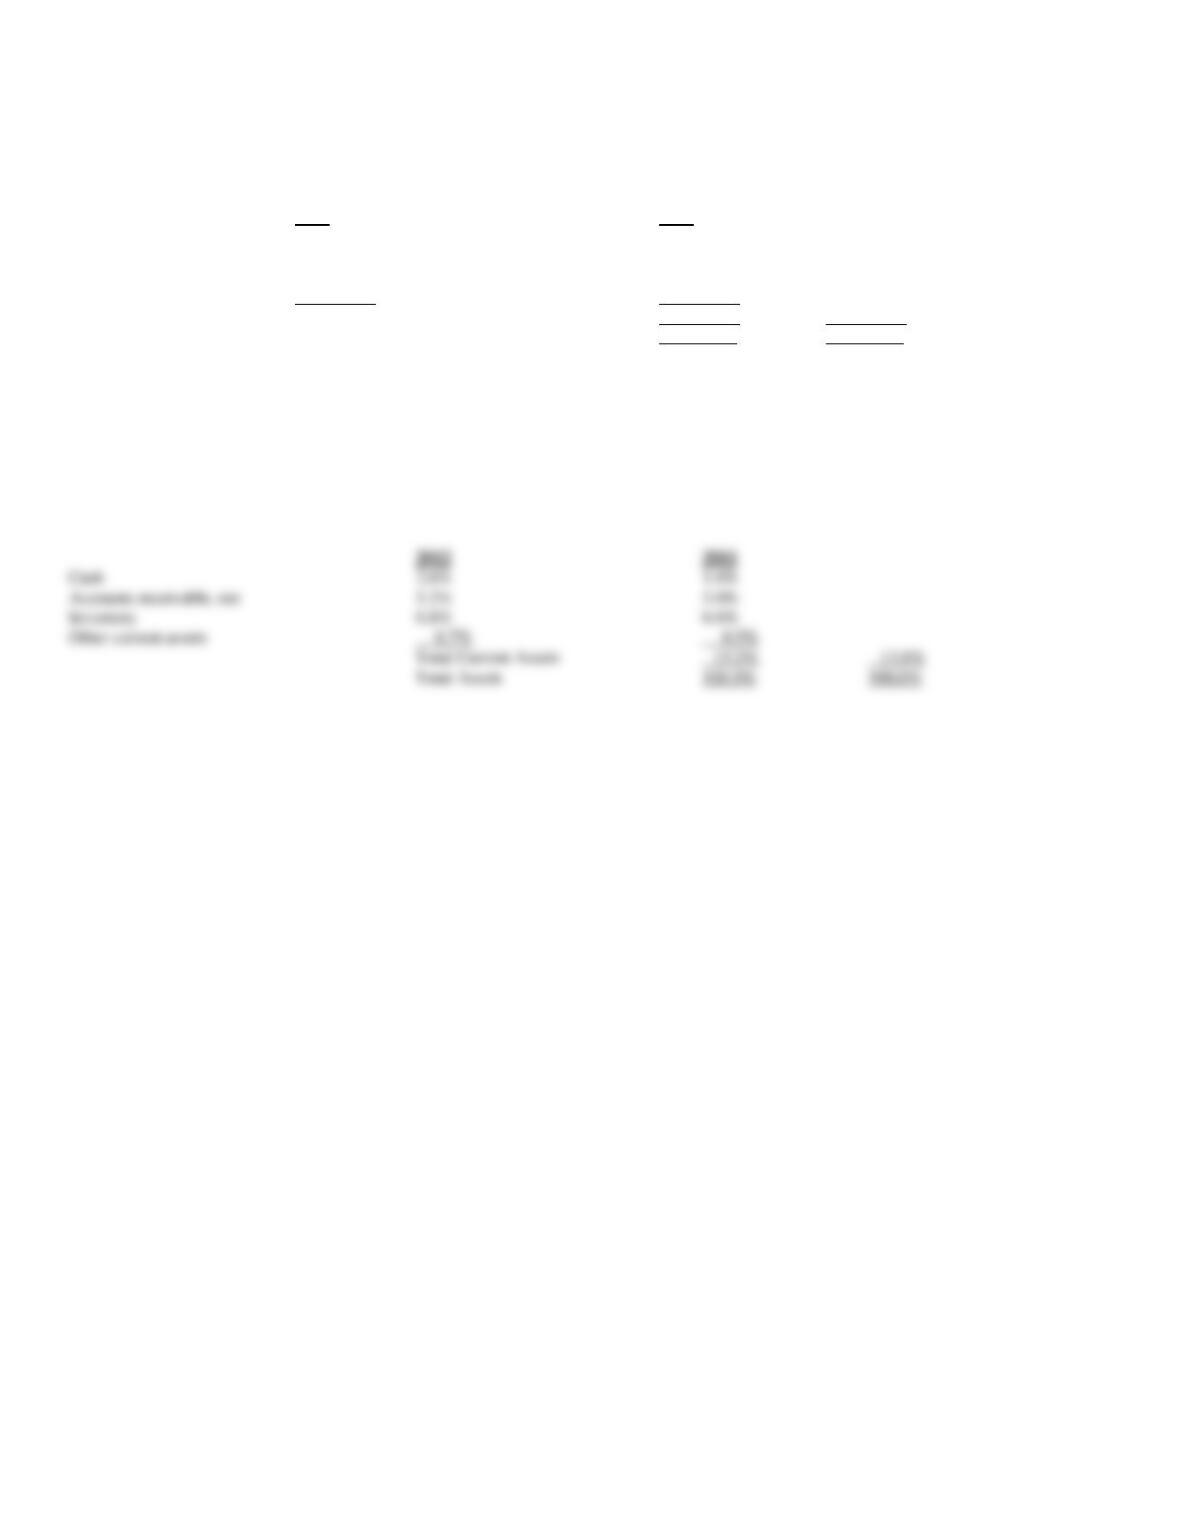
Refer to the information provided for Drucker Dynamics. Complete a common-size vertical analysis of the current assets section of Drucker’s
balance sheet for 2012. Your answers should be expressed as percentages and rounded to one decimal place.
2012
2011
Cash
2.6%
1.6%
Accounts receivable, net
5.2%
5.0%
Inventory
6.8%
6.6%
Other current assets
0.7%
0.5%
Total Current Assets
15.2%
13.8%
Total Assets
100.0%
100.0%

74. Harbinger Enterprises, Inc.
The balance sheet taken from the 2012 10-K of Harbinger Enterprises is provided below.
December 31
Assets:
2012
2011
Current Assets:
Cash
$ 122,200
$108,000
Accounts receivable
45,000
35,000
Inventory
17,000
14,000
Other current assets
13,000
11,000
Total current assets
197,200
168,000
Long-term Assets:
Property, plant & equipment, net
1,489,800
50,000
Intangible assets
422,500
450,000
Total Assets
$2,109,500
$668,000
Liabilities and Stockholders’ Equity
Current Liabilities:
Accounts payable
$ 11,000
$ 9,000
Interest payable
1,000
1,000
Current portion of long-term debt
30,000
0
Income tax payable
37,000
46,000
Total current liabilities
$ 79,000
56,000
Long-term Liabilities:
Notes payable
492,500
30,000
Total liabilities
571,500
86,000
Stockholders’ Equity
Common stock
120,000
70,000
Additional paid-in capital
1,308,000
372,000
Retained earnings
185,000
140,000
Treasury stock
(75,000)
0
Total stockholders’ equity
1,538,000
582,000
Total Liabilities and Stockholders’ Equity
$2,109,500
$668,000
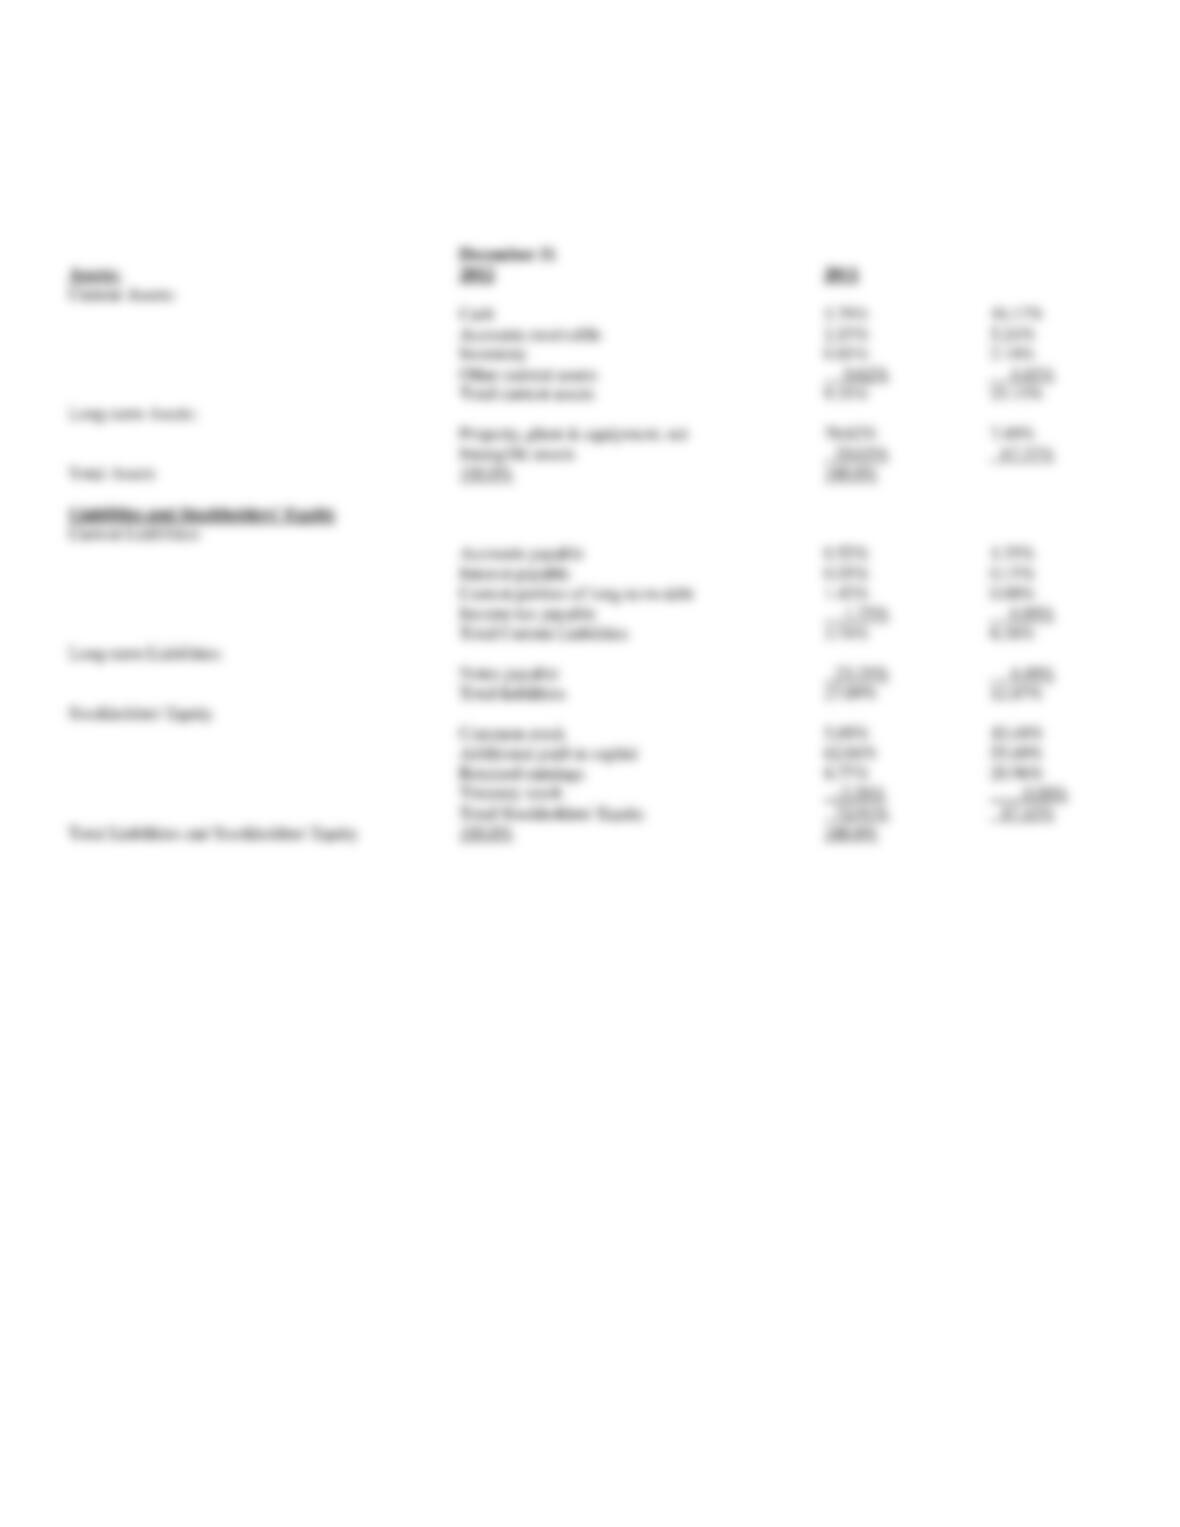
Refer to the balance sheet for Harbinger Enterprises. Prepare Harbinger’s common-size balance sheet to be used in vertical analysis. Your answers
should be expressed as percentages and rounded to two decimal places.
75. Harbinger Enterprises, Inc.
The balance sheet taken from the 2012 10-K of Harbinger Enterprises is provided below.
December 31
Assets:
2012
2011
Current Assets:
Cash
$ 122,200
$108,000
Accounts receivable
45,000
35,000
Inventory
17,000
14,000
Other current assets
13,000
11,000
Total current assets
197,200
168,000
Long-term Assets:
Property, plant & equipment, net
1,489,800
50,000
Intangible assets
422,500
450,000
Total Assets
$2,109,500
$668,000
Liabilities and Stockholders’ Equity
Current Liabilities:
Accounts payable
$ 11,000
$ 9,000
Interest payable
1,000
1,000
Current portion of long-term debt
30,000
0
Income tax payable
37,000
46,000
Total current liabilities
$ 79,000
56,000
Long-term Liabilities:
Notes payable
492,500
30,000
Total liabilities
571,500
86,000
Stockholders’ Equity
Common stock
120,000
70,000
Additional paid-in capital
1,308,000
372,000
Retained earnings
185,000
140,000
Treasury stock
(75,000)
0
Total stockholders’ equity
1,538,000
582,000
Total Liabilities and Stockholders’ Equity
$2,109,500
$668,000
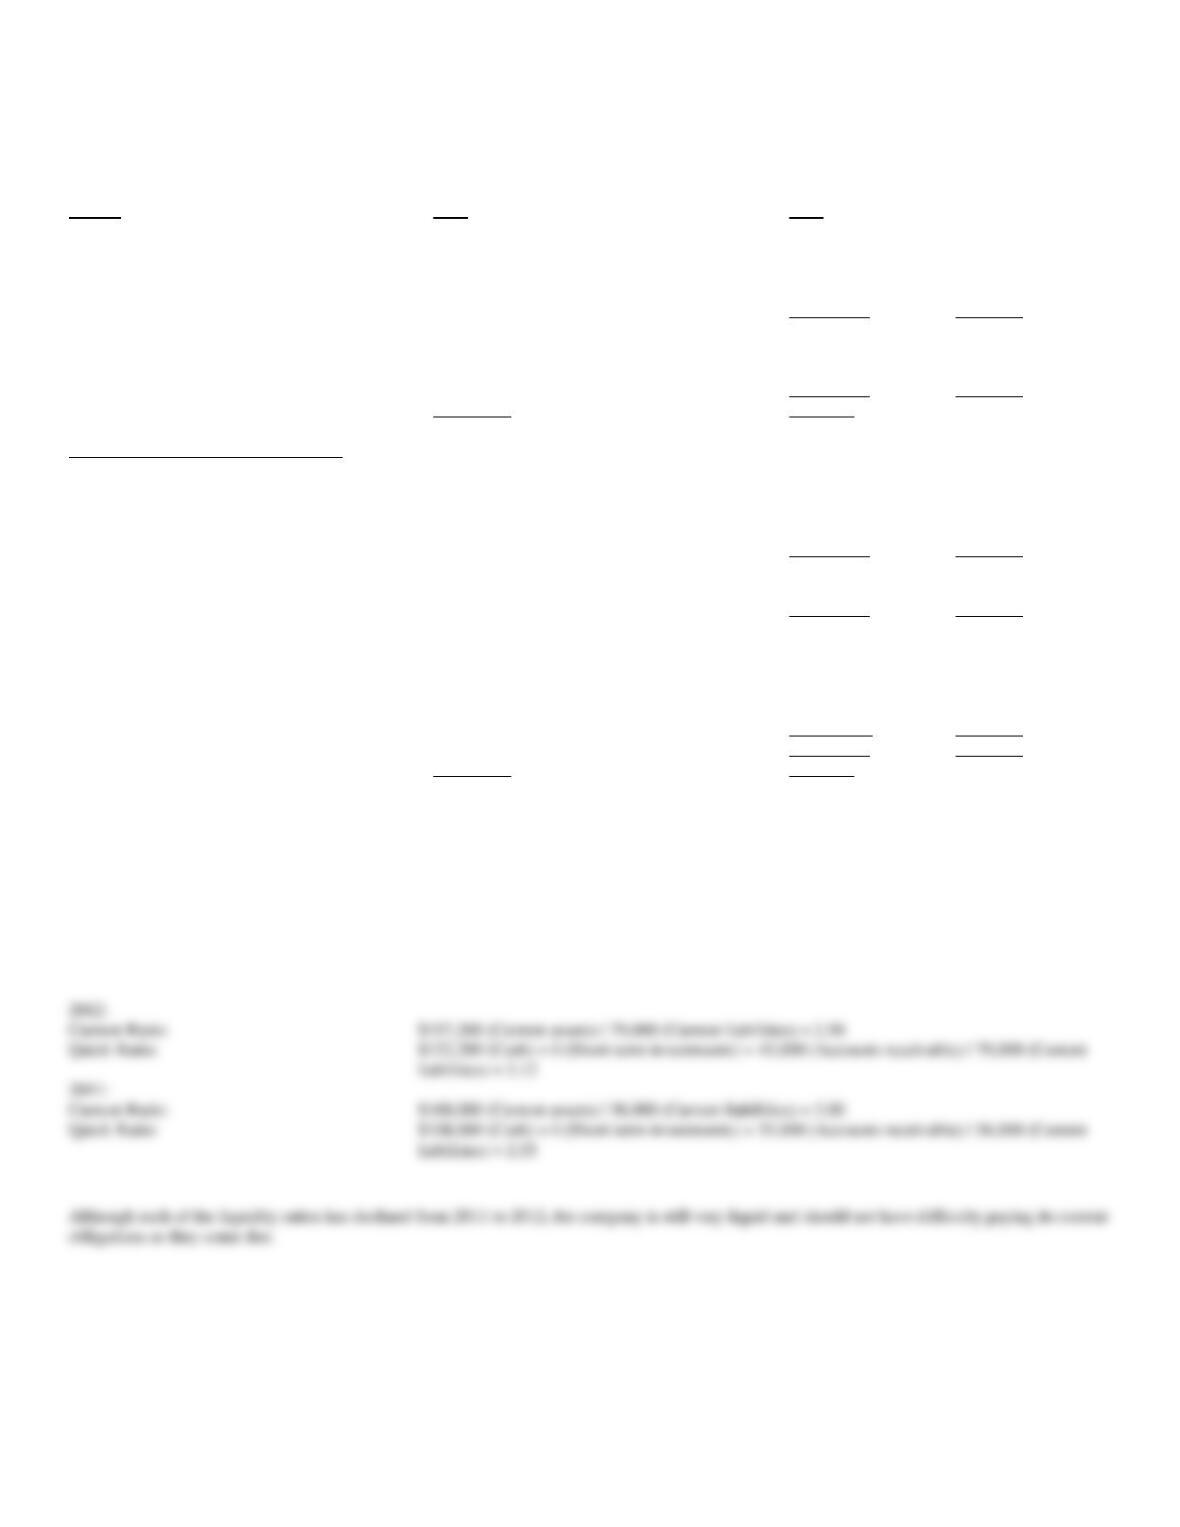
Refer to the balance sheet for Harbinger Enterprises. Calculate Harbinger’s short-term liquidity ratios for 2012 and 2011, including the Current Ratio
and Quick Ratio. Harbinger’s cash flows from operations were $151,000 and $101,000 for 2012 and 2011, respectively. Round your answers to two
decimal places, then comment on Harbinger’s short-term liquidity.
2012:
Current Ratio:
$197,200 (Current assets) / 79,000 (Current liabilities) = 2.50
2011:
Current Ratio:
$168,000 (Current assets) / 56,000 (Current liabilities) = 3.00
76. Harbinger Enterprises, Inc.
The balance sheet taken from the 2012 10-K of Harbinger Enterprises is provided below.
December 31
Assets:
2012
2011
Current Assets:
Cash
$ 122,200
$108,000
Accounts receivable
45,000
35,000
Inventory
17,000
14,000
Other current assets
13,000
11,000
Total current assets
197,200
168,000
Long-term Assets:
Property, plant & equipment, net
1,489,800
50,000
Intangible assets
422,500
450,000
Total Assets
$2,109,500
$668,000
Liabilities and Stockholders’ Equity
Current Liabilities:
Accounts payable
$ 11,000
$ 9,000
Interest payable
1,000
1,000
Current portion of long-term debt
30,000
0
Income tax payable
37,000
46,000
Total current liabilities
$ 79,000
56,000
Long-term Liabilities:
Notes payable
492,500
30,000
Total liabilities
571,500
86,000
Stockholders’ Equity
Common stock
120,000
70,000
Additional paid-in capital
1,308,000
372,000
Retained earnings
185,000
140,000
Treasury stock
(75,000)
0
Total stockholders’ equity
1,538,000
582,000
Total Liabilities and Stockholders’ Equity
$2,109,500
$668,000
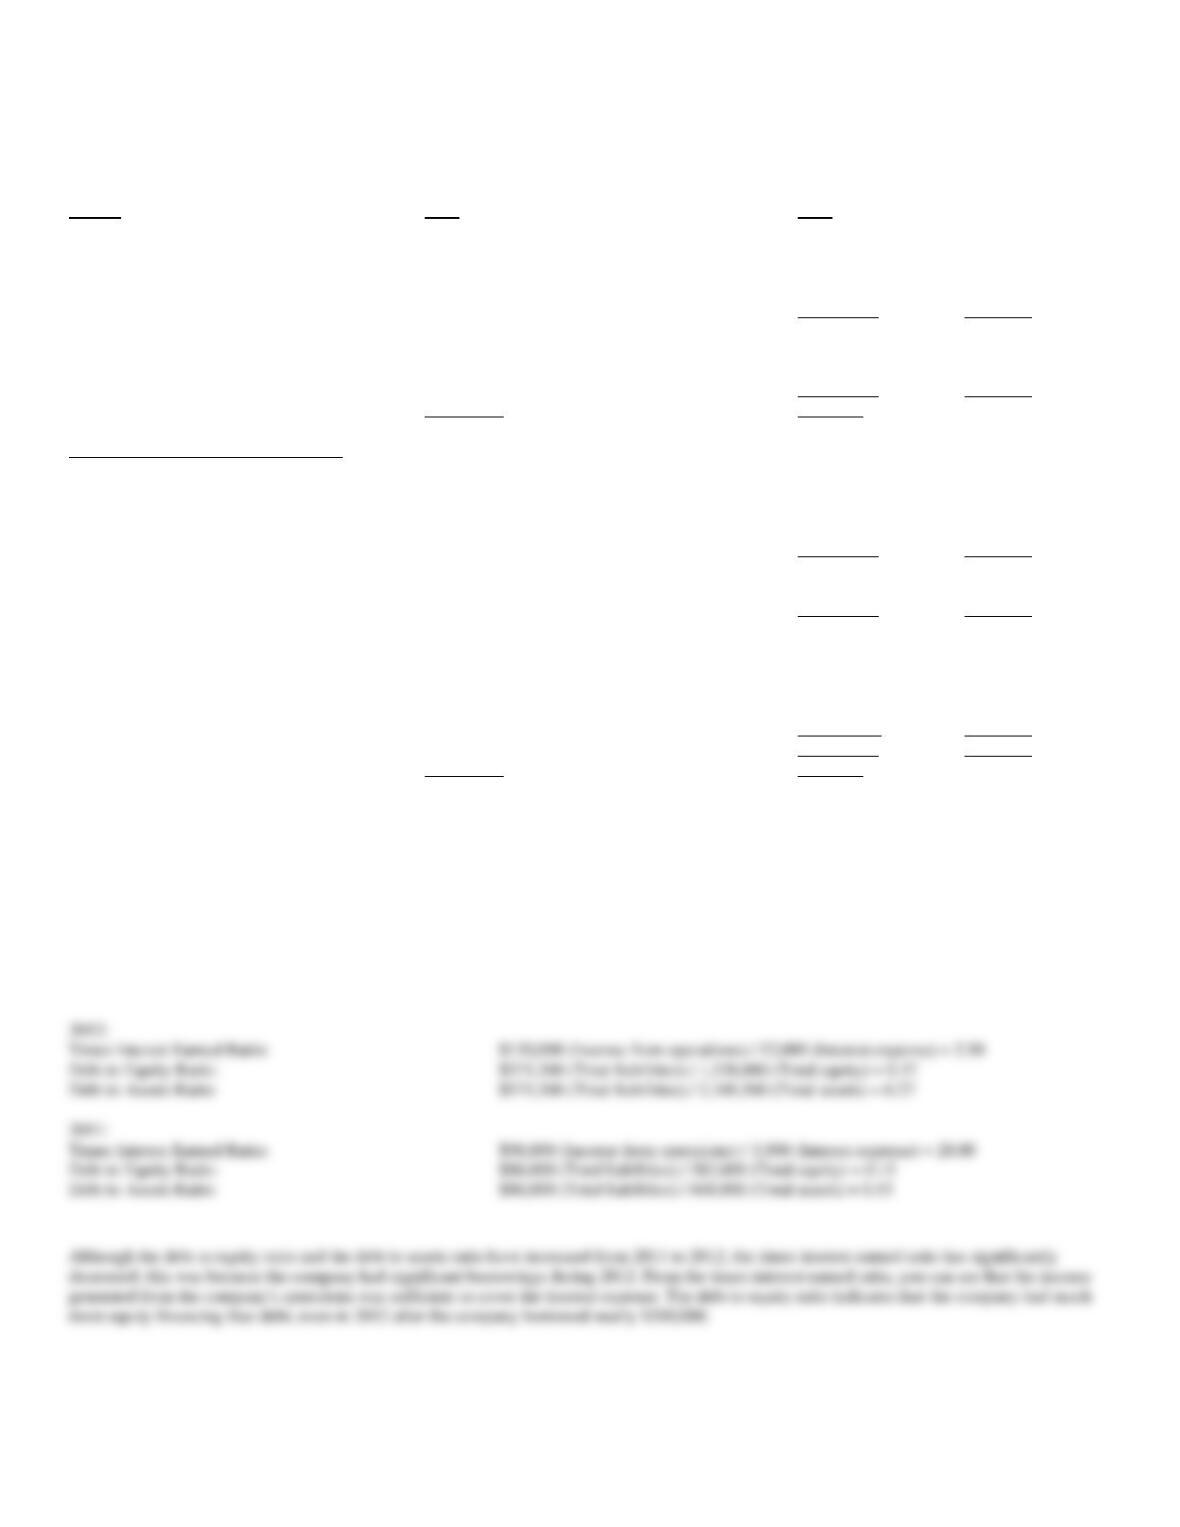
Refer to the balance sheet for Harbinger Enterprises. Calculate Harbinger’s debt management ratios for 2012 and 2011, including the Times Interest
Earned Ratio, Debt to Equity Ratio, and Debt to Assets Ratio. Harbinger’s incomes from operations were $130,000 and $98,000 and interest expenses
were $52,000 and $3,500 for 2012 and 2011, respectively. Round your answers to two decimal places, then comment on Harbinger’s debt
management.
2012:
Times Interest Earned Ratio:
$130,000 (Income from operations) / 52,000 (Interest expense) = 2.50
Debt to Equity Ratio:
$571,500 (Total liabilities) / 1,538,000 (Total equity) = 0.37
Debt to Assets Ratio:
$571,500 (Total liabilities) / 2,109,500 (Total assets) = 0.27
2011:
Times Interest Earned Ratio:
$98,000 (Income from operations) / 3,500 (Interest expense) = 28.00
Debt to Equity Ratio:
$86,000 (Total liabilities) / 582,000 (Total equity) = 0.15
Debt to Assets Ratio:
$86,000 (Total liabilities) / 668,000 (Total assets) = 0.13

77. Harbinger Enterprises, Inc.
The balance sheet taken from the 2012 10-K of Harbinger Enterprises is provided below.
December 31
Assets:
2012
2011
Current Assets:
Cash
$ 122,200
$108,000
Accounts receivable
45,000
35,000
Inventory
17,000
14,000
Other current assets
13,000
11,000
Total current assets
197,200
168,000
Long-term Assets:
Property, plant & equipment, net
1,489,800
50,000
Intangible assets
422,500
450,000
Total Assets
$2,109,500
$668,000
Liabilities and Stockholders’ Equity
Current Liabilities:
Accounts payable
$ 11,000
$ 9,000
Interest payable
1,000
1,000
Current portion of long-term debt
30,000
0
Income tax payable
37,000
46,000
Total current liabilities
$ 79,000
56,000
Long-term Liabilities:
Notes payable
492,500
30,000
Total liabilities
571,500
86,000
Stockholders’ Equity
Common stock
120,000
70,000
Additional paid-in capital
1,308,000
372,000
Retained earnings
185,000
140,000
Treasury stock
(75,000)
0
Total stockholders’ equity
1,538,000
582,000
Total Liabilities and Stockholders’ Equity
$2,109,500
$668,000
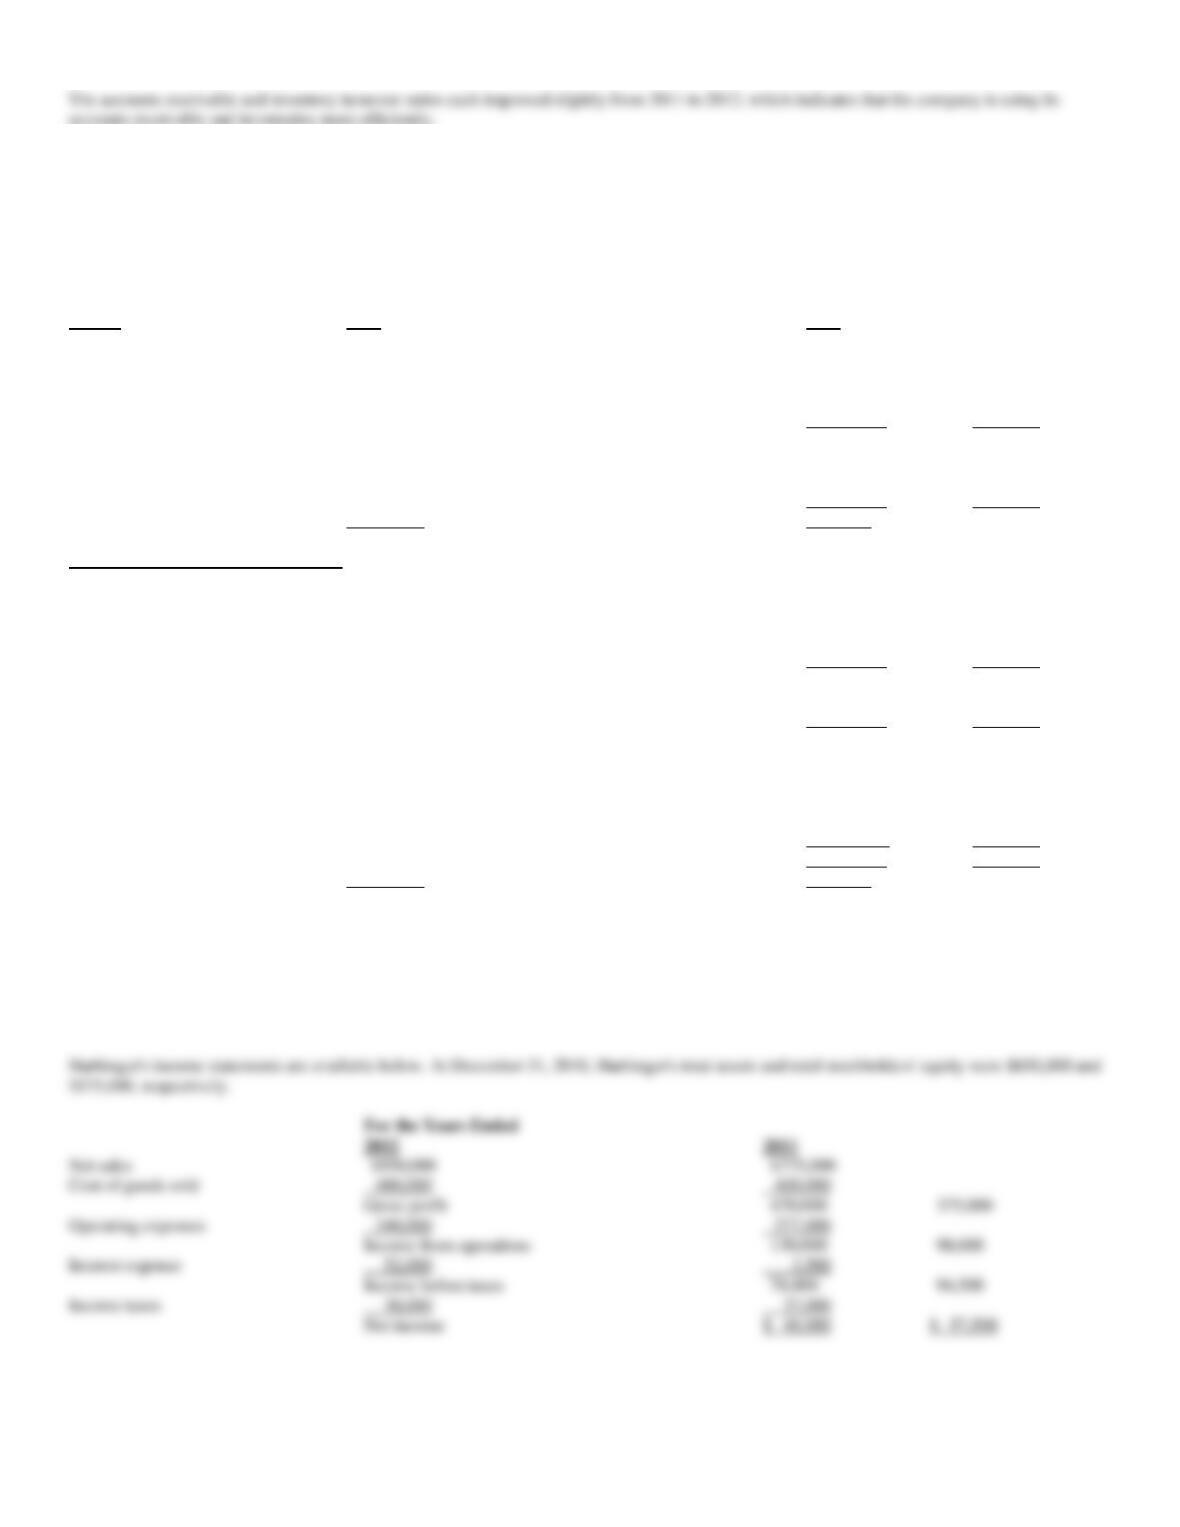
Refer to the balance sheet for Harbinger Enterprises. Calculate Harbinger’s asset efficiency ratios for 2012 and 2011, including the Receivable
Turnover Ratio, and Inventory Turnover Ratio. Also calculate Harbinger’s Operating Cycle. Round your answers to two decimal places, then
comment on Harbinger’s asset efficiency ratios.
A portion of Harbinger’s income statements are shown below. At December 31, 2010, Harbinger’s Accounts Receivable, Inventories, and Total
Assets were $37,000, $13,000, and $650,000, respectively.
For the Years Ended
2012
2011
Net sales
$950,000
$775,000
Cost of goods sold
480,000
400,000
Gross profit
470,000
375,000
2012:
Receivable Turnover:
$950,000 (Net sales) / ((45,000 + 35,000) / 2) (Average accounts receivable) = 23.75
2011:
29.63
78. Harbinger Enterprises, Inc.
The balance sheet taken from the 2012 10-K of Harbinger Enterprises is provided below.
December 31
Assets:
2012
2011
Current Assets:
Cash
$ 122,200
$108,000
Accounts receivable
45,000
35,000
Inventory
17,000
14,000
Other current assets
13,000
11,000
Total current assets
197,200
168,000
Long-term Assets:
Property, plant & equipment, net
1,489,800
50,000
Intangible assets
422,500
450,000
Total Assets
$2,109,500
$668,000
Liabilities and Stockholders’ Equity
Current Liabilities:
Accounts payable
$ 11,000
$ 9,000
Interest payable
1,000
1,000
Current portion of long-term debt
30,000
0
Income tax payable
37,000
46,000
Total current liabilities
$ 79,000
56,000
Long-term Liabilities:
Notes payable
492,500
30,000
Total liabilities
571,500
86,000
Stockholders’ Equity
Common stock
120,000
70,000
Additional paid-in capital
1,308,000
372,000
Retained earnings
185,000
140,000
Treasury stock
(75,000)
0
Total stockholders’ equity
1,538,000
582,000
Total Liabilities and Stockholders’
Equity
$2,109,500
$668,000
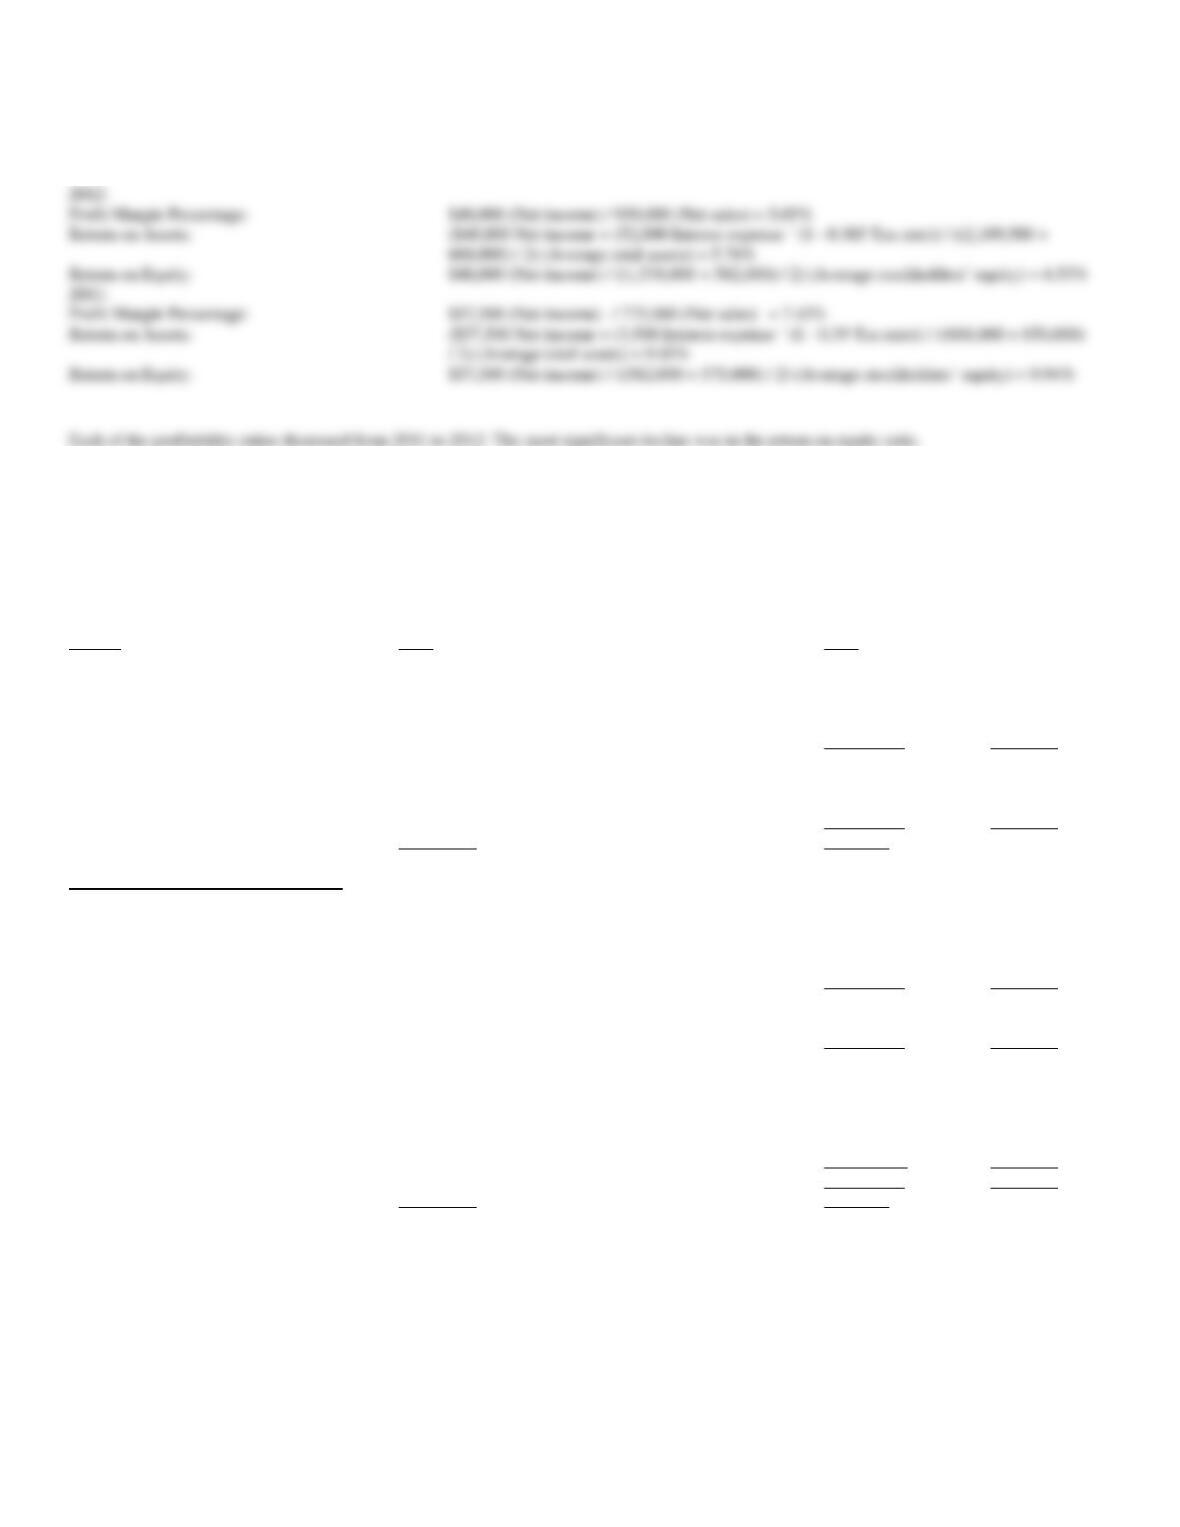
Refer to the balance sheet for Harbinger Enterprises. Calculate Harbinger’s profitability ratios for 2012 and 2011, including the Profit Margin
Percentage, Return on Assets, and Return on Equity. Express each ratio as a percentage and round your answers to two decimal places, then comment
on Harbinger’s performance in terms of profitability.
2012
2011
Net sales
$950,000
$775,000
Cost of goods sold
480,000
400,000
Gross profit
470,000
375,000
Operating expenses
340,000
277,000
Income from operations
130,000
98,000
Interest expense
52,000
3,500
Income before taxes
78,000
94,500
Income taxes
30,000
37,000
79. Harbinger Enterprises, Inc.
The balance sheet taken from the 2012 10-K of Harbinger Enterprises is provided below.
December 31
Assets:
2012
2011
Current Assets:
Cash
$ 122,200
$108,000
Accounts receivable
45,000
35,000
Inventory
17,000
14,000
Other current assets
13,000
11,000
Total current assets
197,200
168,000
Long-term Assets:
Property, plant & equipment, net
1,489,800
50,000
Intangible assets
422,500
450,000
Total Assets
$2,109,500
$668,000
Liabilities and Stockholders’ Equity
Current Liabilities:
Accounts payable
$ 11,000
$ 9,000
Interest payable
1,000
1,000
Current portion of long-term debt
30,000
0
Income tax payable
37,000
46,000
Total current liabilities
$ 79,000
56,000
Long-term Liabilities:
Notes payable
492,500
30,000
Total liabilities
571,500
86,000
Stockholders’ Equity
Common stock
120,000
70,000
Additional paid-in capital
1,308,000
372,000
Retained earnings
185,000
140,000
Treasury stock
(75,000)
0
Total stockholders’ equity
1,538,000
582,000
Total Liabilities and Stockholders’ Equity
$2,109,500
$668,000
2012:
Profit Margin Percentage:
$48,000 (Net income) / 950,000 (Net sales) = 5.05%
Return on Equity:
$48,000 (Net income) / ((1,538,000 + 582,000) / 2) (Average stockholders’ equity) = 4.53%
2011:
Profit Margin Percentage:
$57,500 (Net income) / 775,000 (Net sales) = 7.42%
Return on Equity:
$57,500 (Net income) / ((582,000 + 575,000) / 2) (Average stockholders’ equity) = 9.94%
80. Use the following selected financial information to compare these two companies at December 31, 2012,
and to answer the questions that follow.
Sweet Co.
Sour Co.
Cash
$ 2,600
$ 630
Short-term investments
200
1,890
Accounts and notes receivable
23,400
26,000
Inventories
2,100
2,300
Prepaid expenses
2,700
1,260
Total current assets
31,000
31,920
Total current liabilities
11,000
8,400
Long-term liabilities
5,600
25,200
Stockholders’ equity
13,000
21,000
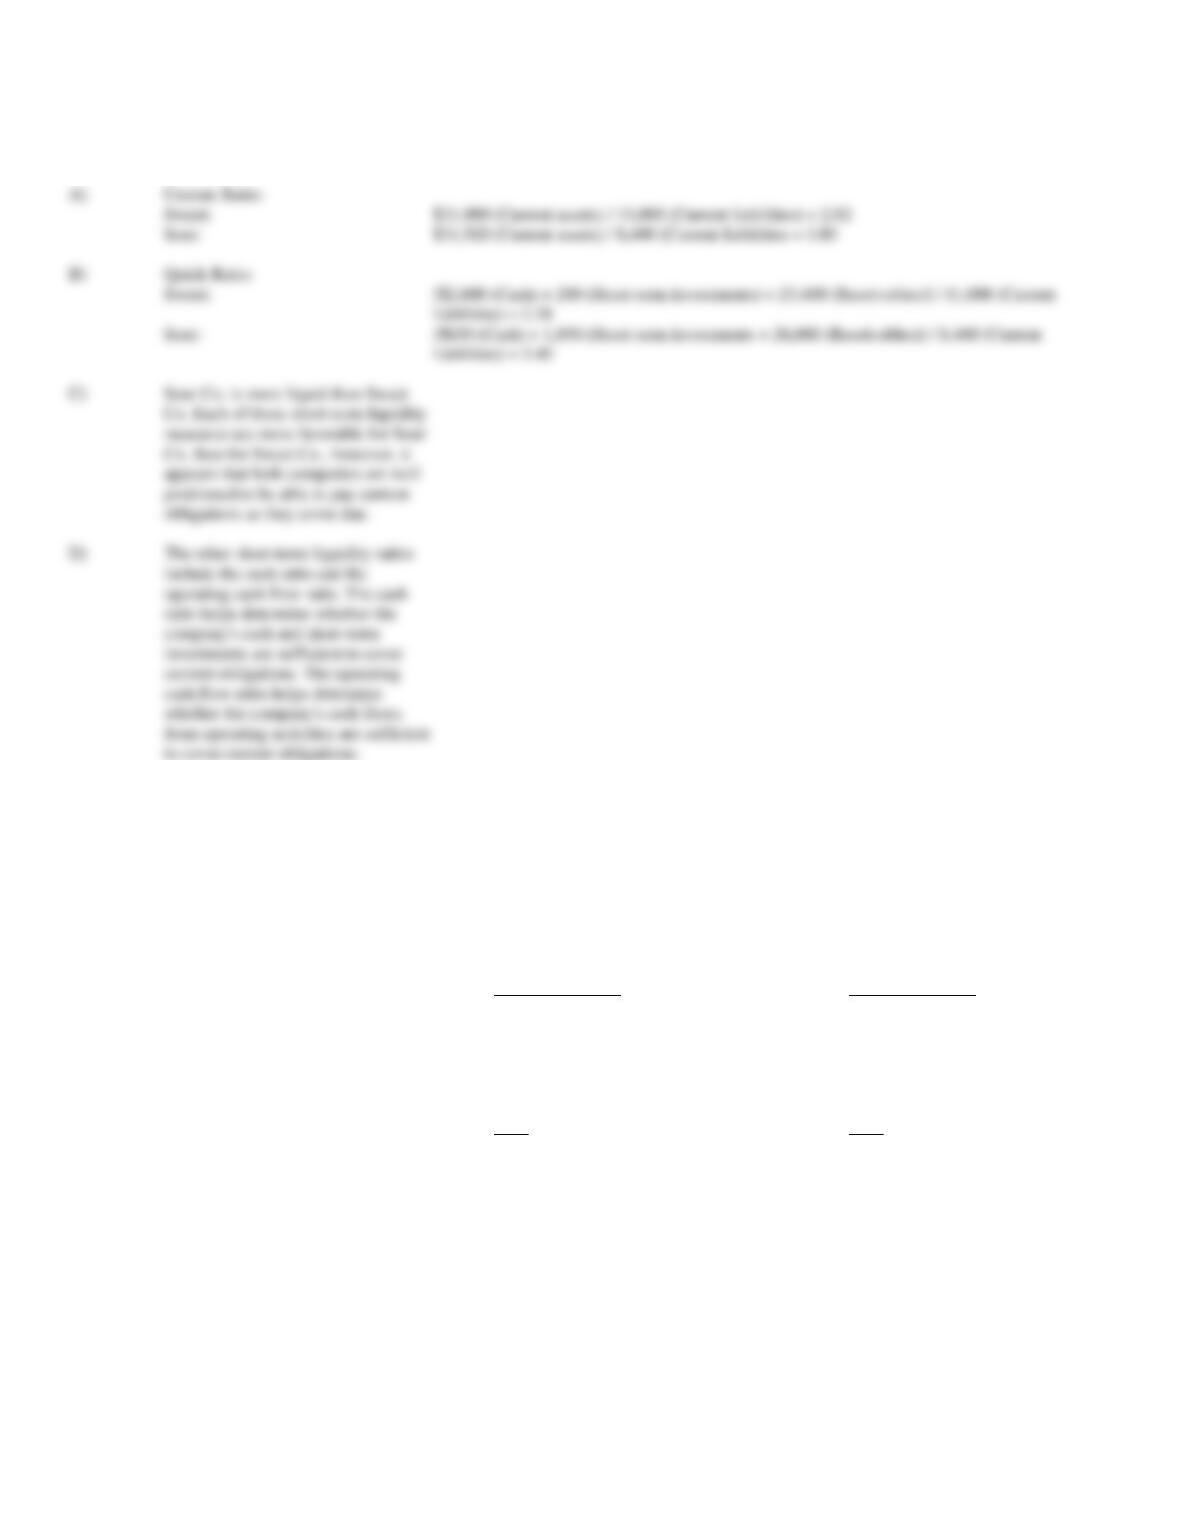
A)
Compute the current ratios for the two companies.
B)
Compute the quick ratios for the two companies.
C)
Which company appears to be more liquid?
D)
What other ratios would help to more fully assess the liquidity of these two companies?
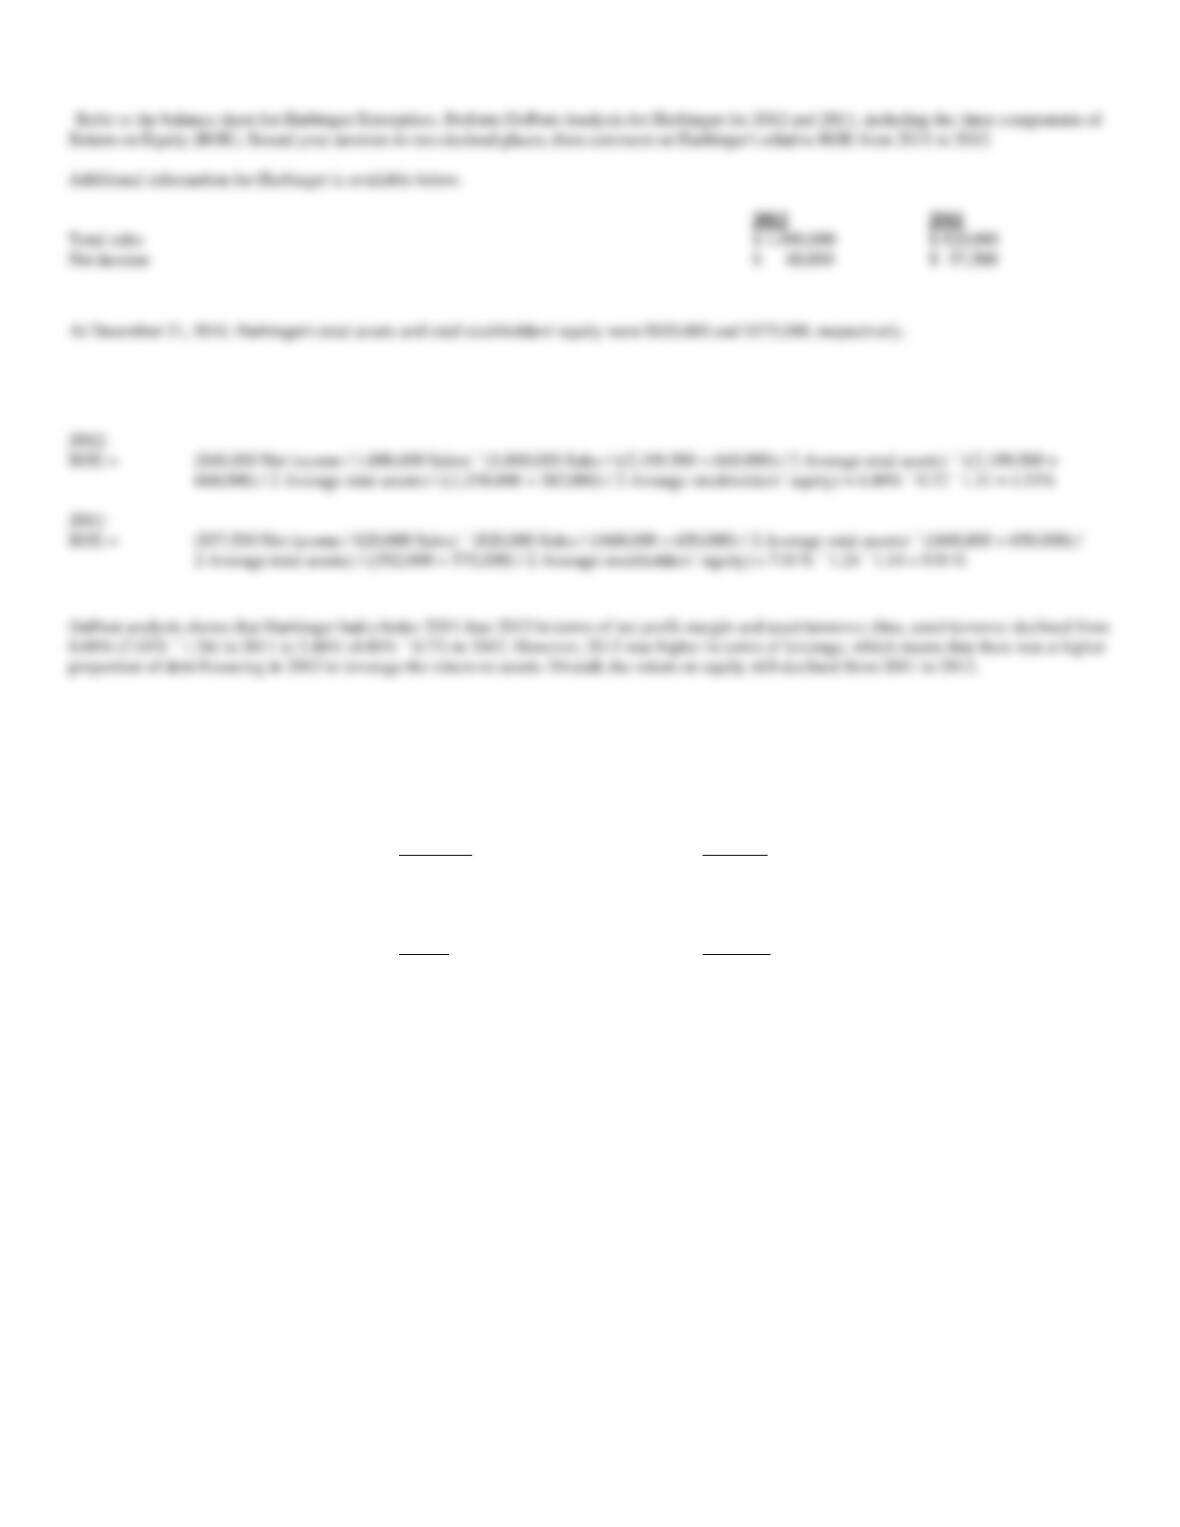
2012
2011
Total sales
$ 1,000,000
$ 820,000
Net income
$ 48,000
$ 57,500
2012:
668,000) / 2 Average total assets) / ((1,538,000 + 582,000) / 2 Average stockholders’ equity) = 4.80% ´ 0.72 ´ 1.31 = 4.53%
2011:
81. Bathing Beauties Swimwear Company (BBSC) is a retailer of specialty swimwear. During 2012, BBSC
expanded its retail business by adding 30 new retail stores. The following information is obtained from the
comparative financial statements included in the company’s 2012 Form 10-K (all amounts are in $ thousands).
January 31, 2012
January 31, 2011
Current liabilities
$ 6,000
$ 8,000
Total liabilities
26,000
18,000
Total stockholders’ equity
34,000
38,000
Total assets
60,000
56,000
For the fiscal years ended January 31
2012
2011
Depreciation expense
$ 2,000
$ 6,000
Interest expense
3,400
3,200
Income tax expense
12,600
18,100
Net income
6,000
15,000
Net cash flows from operations
41,000
(400)
Total dividends paid
2,000
12,000
Current Ratio:
Sweet:
$31,000 (Current assets) / 11,000 (Current liabilities) = 2.82
Sour:
$31,920 (Current assets) / 8,400 (Current liabilities = 3.80
Quick Ratio:
Using the information provided, address the following questions for each fiscal year-end:
A)
What is BBSC’s debt to equity ratio?
B)
What is BBSC’s times interest earned ratio?
C)
What is BBSC’s debt to total assets ratio?
D)
Comment briefly on the company’s debt management position.
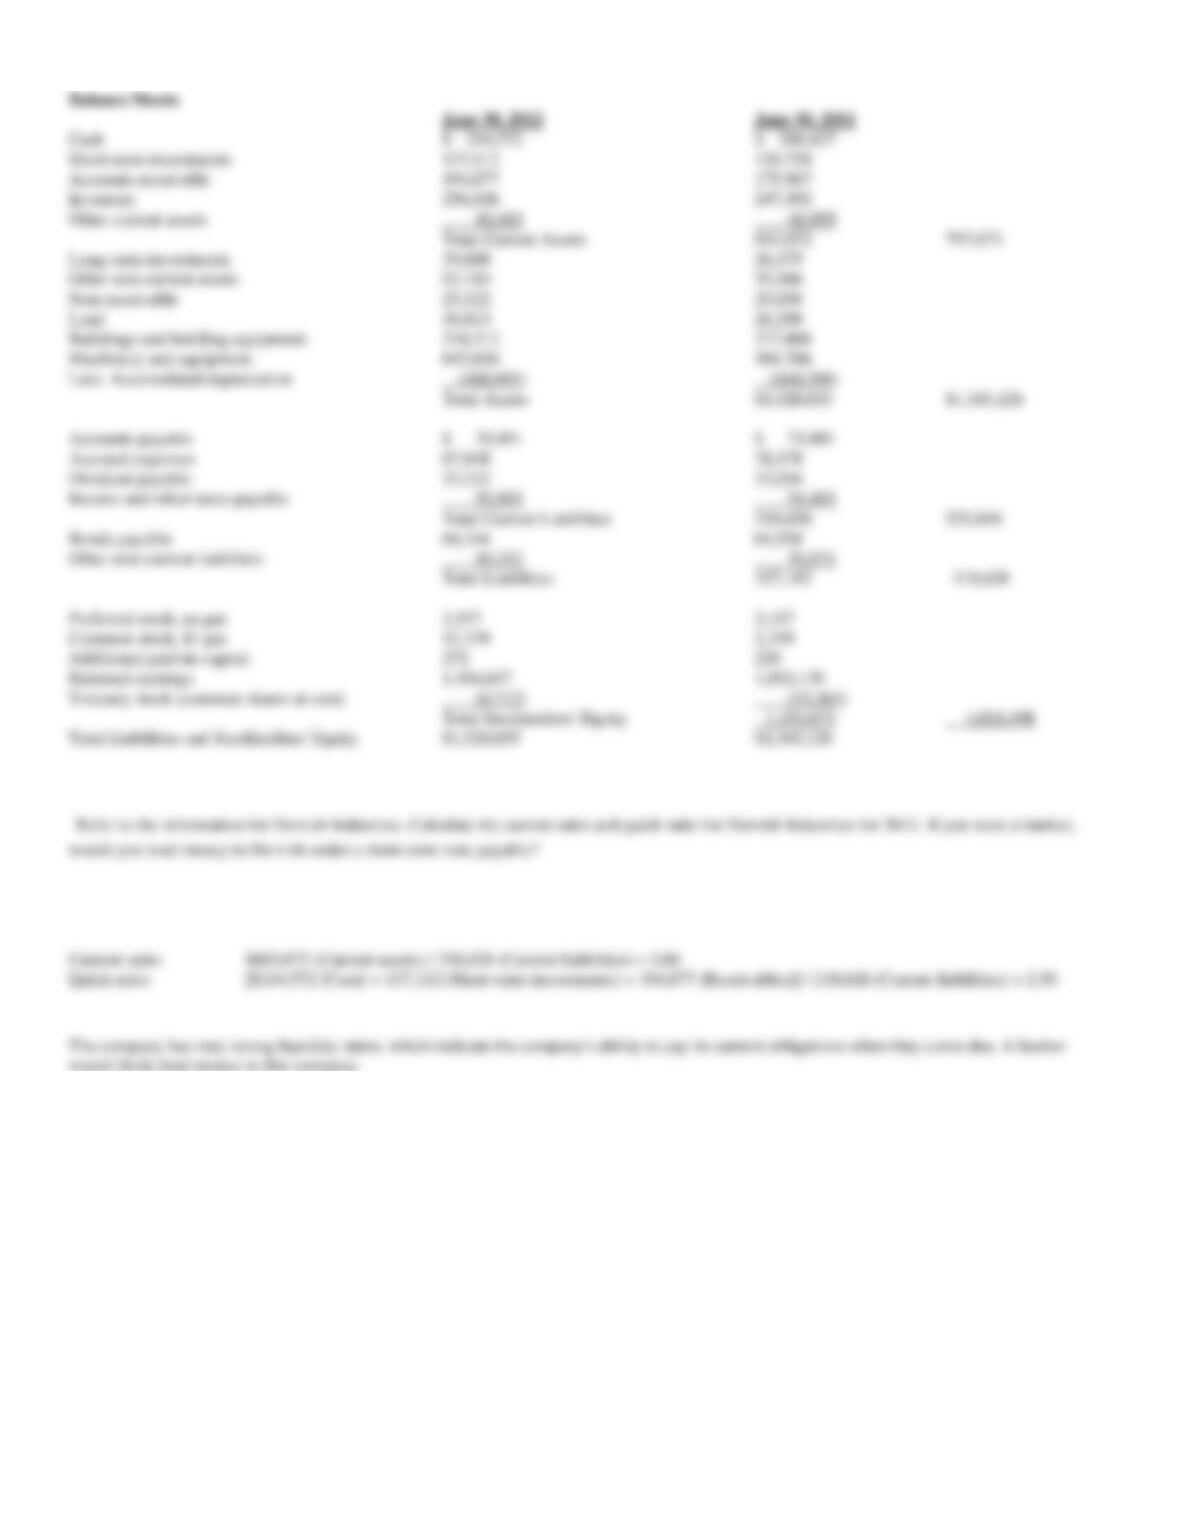
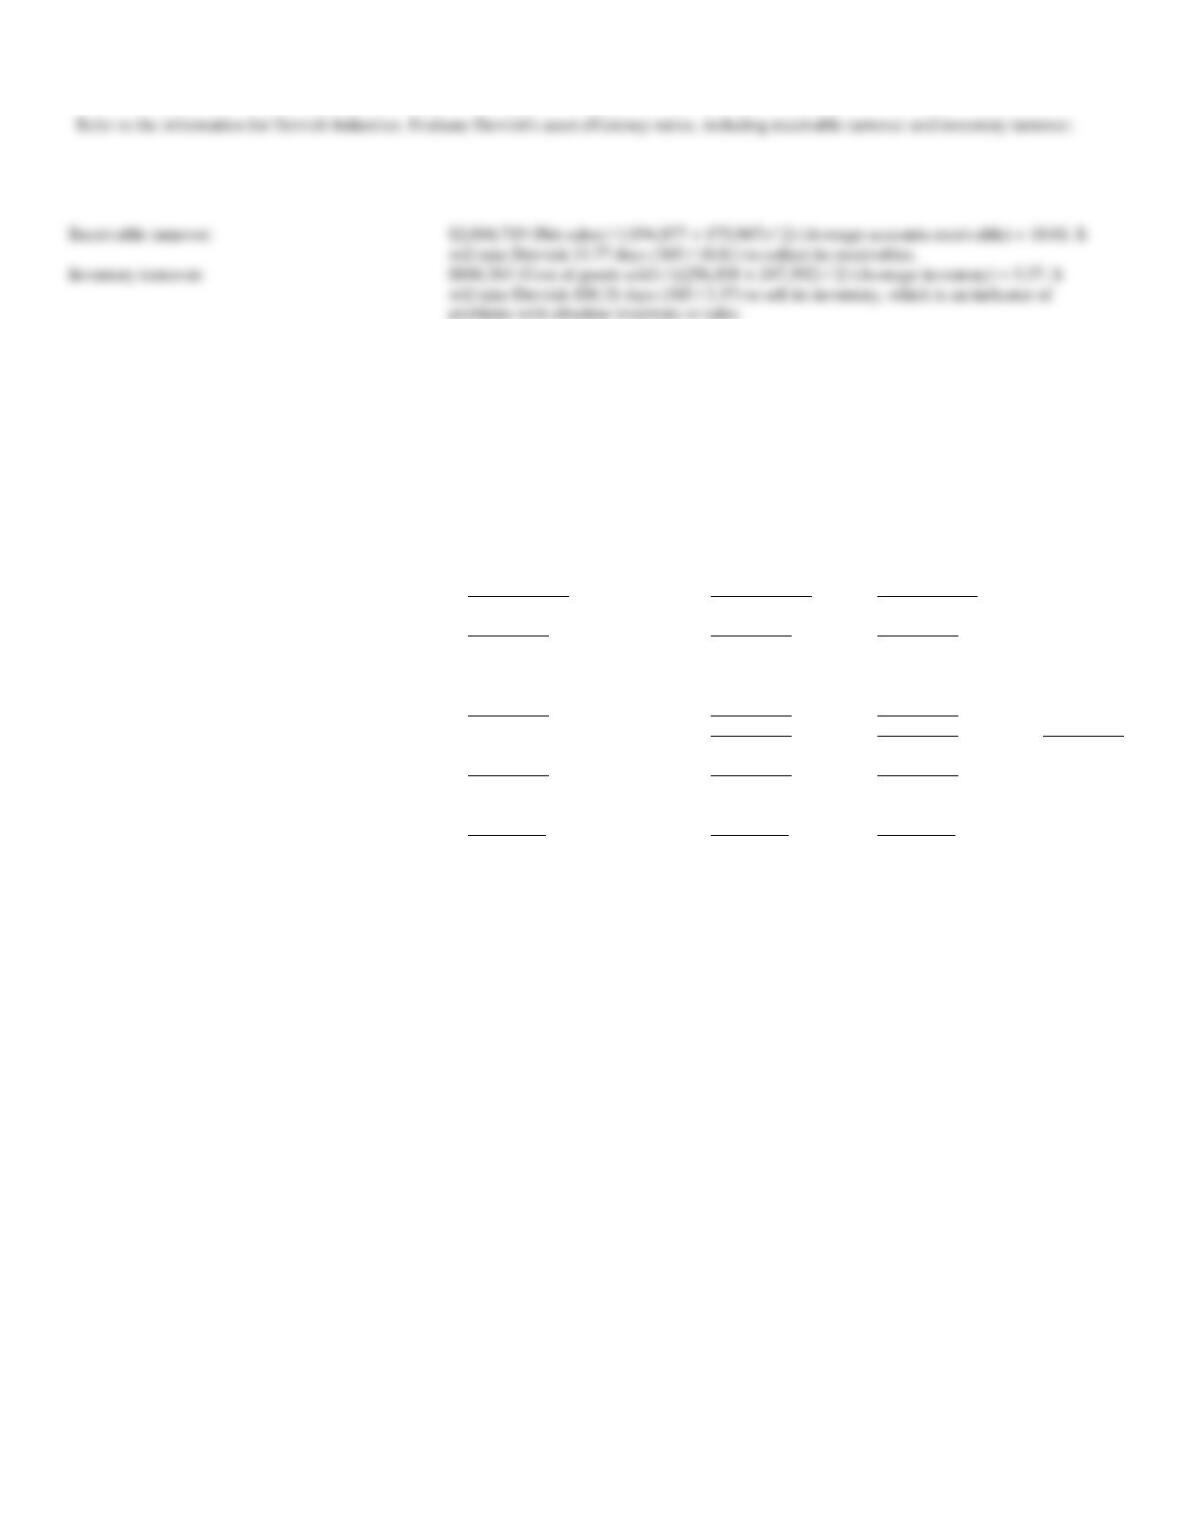
82. Dervish Industries, Inc.
The comparative financial statements for Dervish Industries, Inc. are provided below. All amounts are in
thousands except for per share amounts.
Statements of Income and Retained Earnings for the
Fiscal Years Ended:
June 30, 2012
June 30, 2011
June 30, 2010
Net sales
$2,004,719
$1,937,021
$1,835,987
Other income
18,636
17,153
14,614
Total revenues
2,023,355
1,954,174
1,850,601
Cost of goods sold
848,363
847,366
814,483
Selling, general, & administrative expenses
733,498
711,610
666,909
Interest expense
615
958
1,097
Total costs and expenses
1,582,476
1,559,934
1,482,489
Income before taxes
440,879
394,240
368,112
Income taxes
136,378
122,614
128,840
Net income
304,501
271,626
239,272
Retained earnings at beginning of year
1,032,139
898,512
497,481
Dividends declared
(152,023)
(137,999)
(87,301)
Retained earnings at end of year
$1,184,617
$1,032,139
$ 649,452
Per average share amounts:
Net income per share of common stock
$2.63
$2.34
$1.99
Dividends per share of common stock
$1.30
$1.17
$1.02
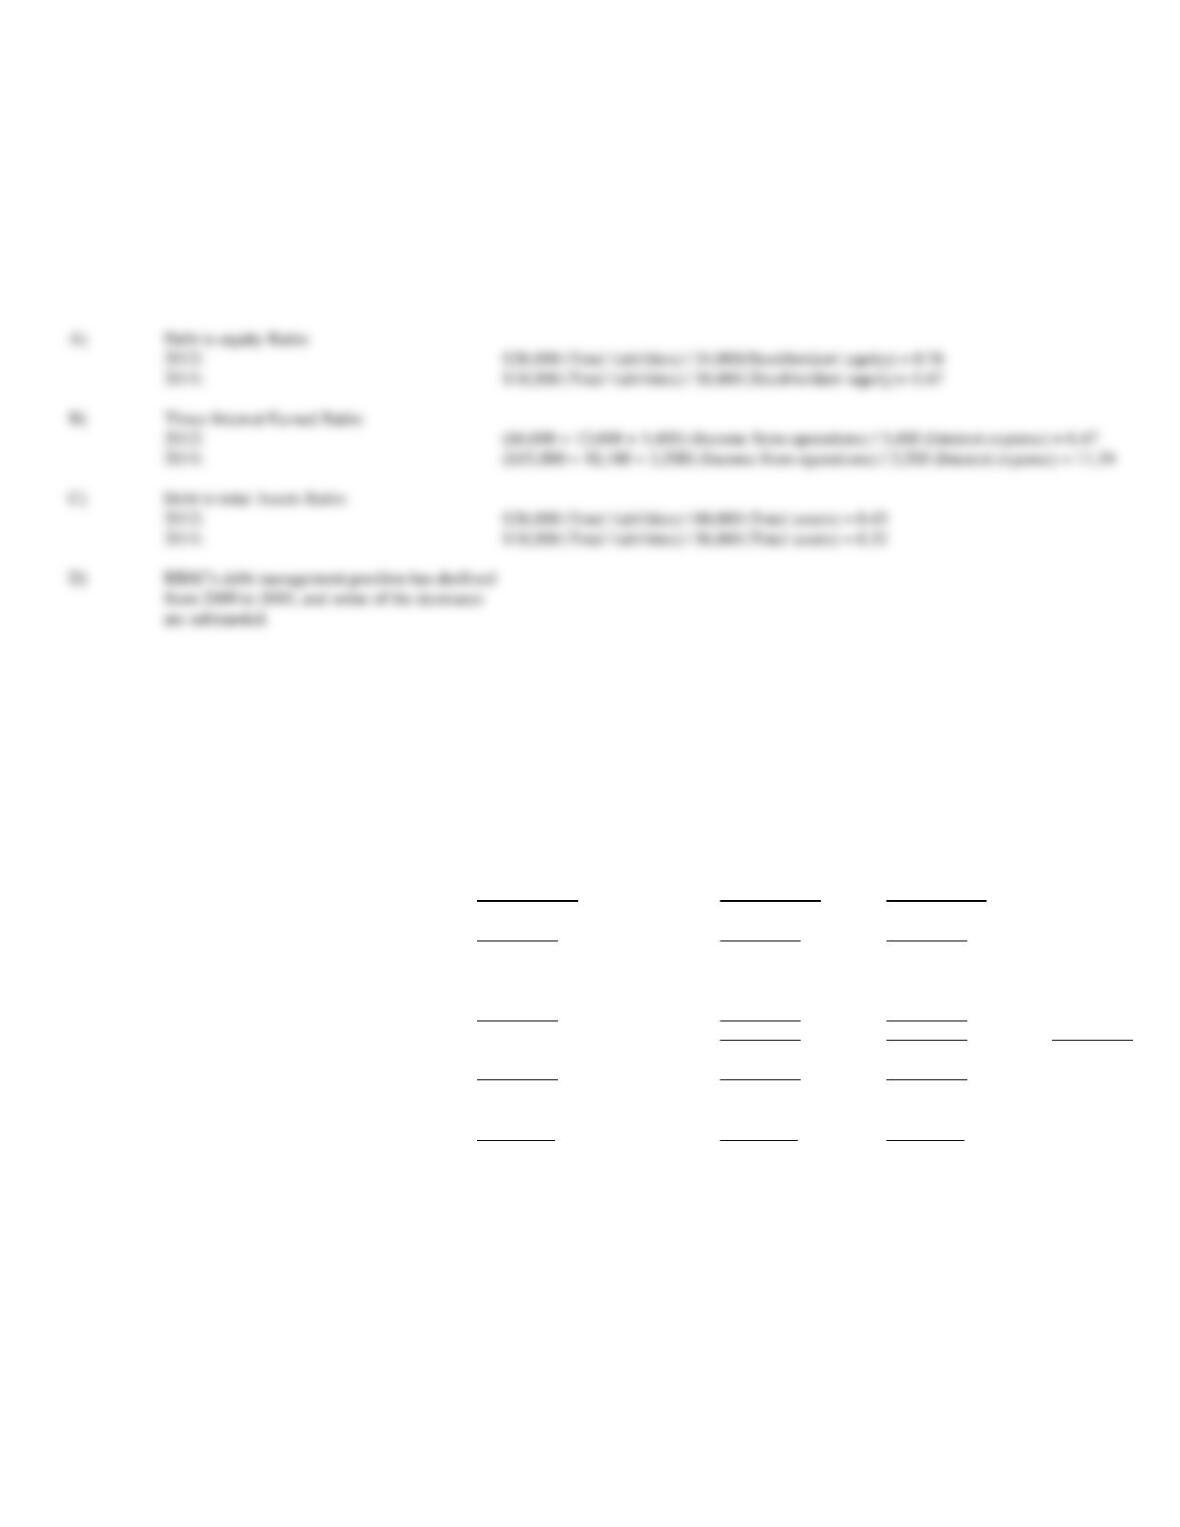
A)
Debt to equity Ratio:
2012:
$26,000 (Total liabilities) / 34,000(Stockholders’ equity) = 0.76
2011:
B)
Times Interest Earned Ratio:
2012:
($6,000 + 12,600 + 3,400) (Income from operations) / 3,400 (Interest expense) = 6.47
2011:
C)
Debt to total Assets Ratio:
2012:
2011:
$18,000 (Total liabilities) / 56,000 (Total assets) = 0.32
83. Dervish Industries, Inc.
The comparative financial statements for Dervish Industries, Inc. are provided below. All amounts are in
thousands except for per share amounts.
Statements of Income and Retained Earnings for the
Fiscal Years Ended:
June 30, 2012
June 30, 2011
June 30, 2010
Net sales
$2,004,719
$1,937,021
$1,835,987
Other income
18,636
17,153
14,614
Total revenues
2,023,355
1,954,174
1,850,601
Cost of goods sold
848,363
847,366
814,483
Selling, general, & administrative expenses
733,498
711,610
666,909
Interest expense
615
958
1,097
Total costs and expenses
1,582,476
1,559,934
1,482,489
Income before taxes
440,879
394,240
368,112
Income taxes
136,378
122,614
128,840
Net income
304,501
271,626
239,272
Retained earnings at beginning of year
1,032,139
898,512
497,481
Dividends declared
(152,023)
(137,999)
(87,301)
Retained earnings at end of year
$1,184,617
$1,032,139
$ 649,452
Per average share amounts:
Net income per share of common stock
$2.63
$2.34
$1.99
Dividends per share of common stock
$1.30
$1.17
$1.02
Cash
$ 214,572
$ 206,627
Short-term investments
137,112
120,728
Accounts receivable
194,877
175,967
Inventory
256,108
247,392
Other current assets
40,403
46,959
Long-term investments
39,888
26,375
Other non-current assets
92,183
59,566
Note receivable
25,522
29,038
Land
36,013
26,298
Buildings and building equipment
310,212
277,808
Machinery and equipment
642,656
566,766
Less: Accumulated depreciation
(468,691)
(440,398)
Total Assets
$1,520,855
$1,343,126
Accounts payable
$ 76,691
$ 71,001
Accrued expenses
67,848
78,378
Dividend payable
23,222
22,034
Income and other taxes payable
50,865
54,403
Total Current Liabilities
218,626
225,816
Bonds payable
68,244
61,938
Other non-current liabilities
40,312
30,874
Total Liabilities
327,182
318,628
Preferred stock, no par
3,157
3,157
Common stock, $1 par
12,339
2,339
Additional paid-in-capital
Retained earnings
1,184,617
1,032,139
Treasury stock (common shares at cost)
(6,712)
(13,363)
Total Stockholders’ Equity
1,193,673
1,024,498
Total Liabilities and Stockholders’ Equity
$1,520,855
$1,343,126
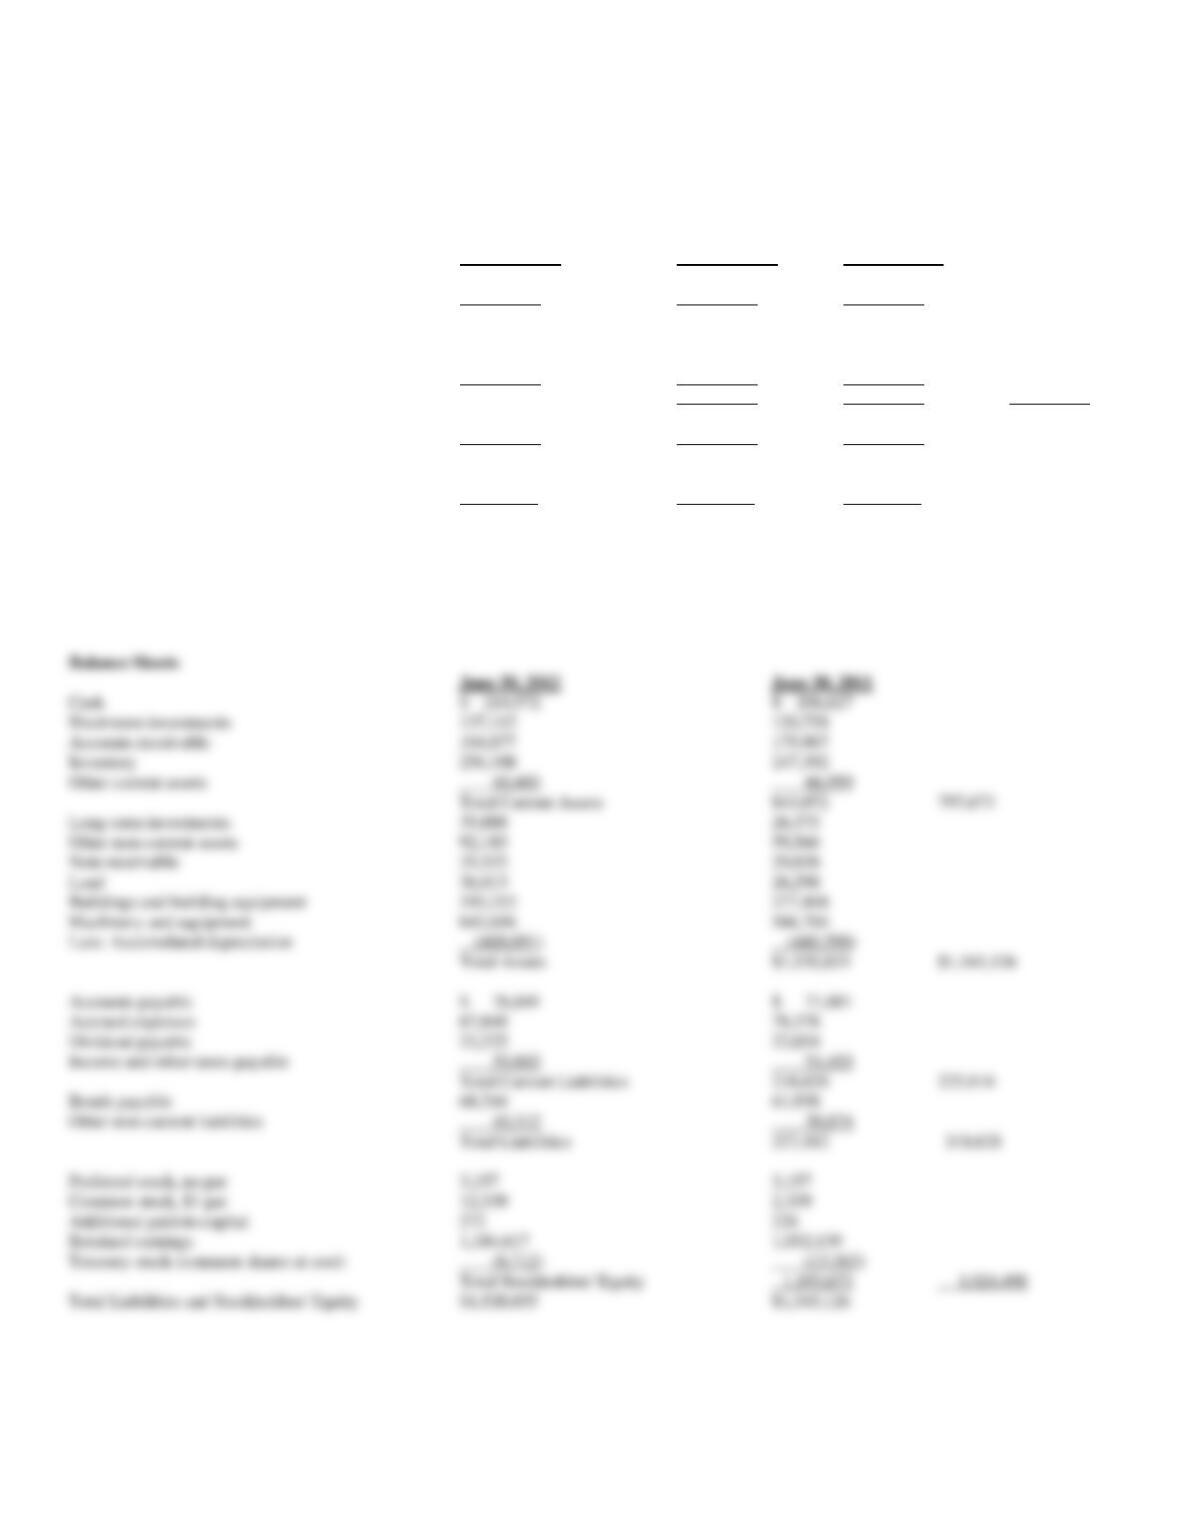
84. Dervish Industries, Inc.
The comparative financial statements for Dervish Industries, Inc. are provided below. All amounts are in
thousands except for per share amounts.
Statements of Income and Retained Earnings for the
Fiscal Years Ended:
June 30, 2012
June 30, 2011
June 30, 2010
Net sales
$2,004,719
$1,937,021
$1,835,987
Other income
18,636
17,153
14,614
Total revenues
2,023,355
1,954,174
1,850,601
Cost of goods sold
848,363
847,366
814,483
Selling, general, & administrative expenses
733,498
711,610
666,909
Interest expense
615
958
1,097
Total costs and expenses
1,582,476
1,559,934
1,482,489
Income before taxes
440,879
394,240
368,112
Income taxes
136,378
122,614
128,840
Net income
304,501
271,626
239,272
Retained earnings at beginning of year
1,032,139
898,512
497,481
Dividends declared
(152,023)
(137,999)
(87,301)
Retained earnings at end of year
$1,184,617
$1,032,139
$ 649,452
Per average share amounts:
Net income per share of common stock
$2.63
$2.34
$1.99
Dividends per share of common stock
$1.30
$1.17
$1.02
Balance Sheets
June 30, 2012
June 30, 2011
Cash
$ 214,572
$ 206,627
Short-term investments
137,112
120,728
Accounts receivable
194,877
175,967
Inventory
256,108
247,392
Other current assets
40,403
46,959
Total Current Assets
843,072
797,673
Long-term investments
39,888
26,375
Other non-current assets
92,183
59,566
Note receivable
25,522
29,038
Land
36,013
26,298
Buildings and building equipment
310,212
277,808
Machinery and equipment
642,656
566,766
Less: Accumulated depreciation
(468,691)
(440,398)
Total Assets
$1,520,855
$1,343,126
Accounts payable
$ 76,691
$ 71,001
Accrued expenses
67,848
78,378
Dividend payable
23,222
22,034
Income and other taxes payable
50,865
54,403
Total Current Liabilities
218,626
225,816
Bonds payable
68,244
61,938
Other non-current liabilities
40,312
30,874
Total Liabilities
327,182
318,628
Preferred stock, no par
3,157
3,157
Common stock, $1 par
12,339
2,339
Additional paid-in-capital
272
226
Retained earnings
1,184,617
1,032,139
Treasury stock (common shares at cost)
(6,712)
(13,363)
Total Stockholders’ Equity
1,193,673
1,024,498
Total Liabilities and Stockholders’ Equity
$1,520,855
$1,343,126
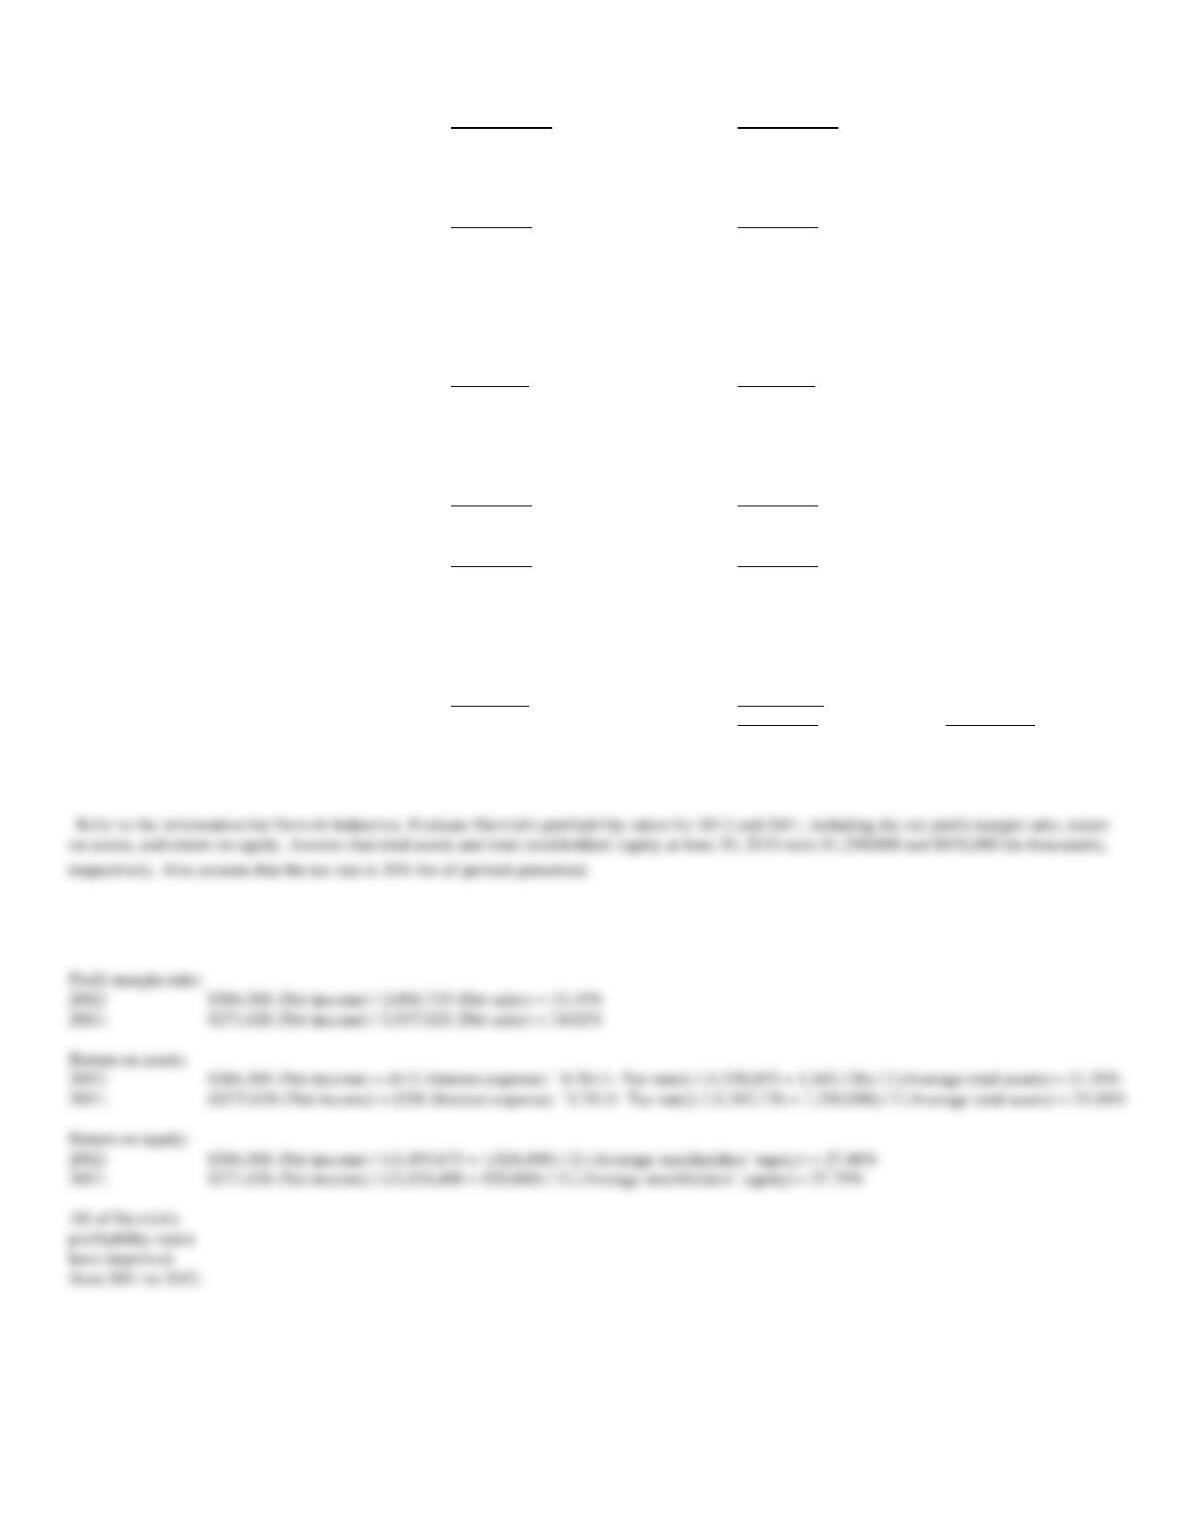
Profit margin ratio:
2012:
$304,501 (Net income) / 2,004,719 (Net sales) = 15.19%
2011:
$271,626 (Net income) / 1,937,021 (Net sales) = 14.02%
Return on assets:
2012:
$304,501 (Net income) + (615 (Interest expense) ´ 0.70 (1- Tax rate)) / (1,520,855 + 1,343,126) / 2 (Average total assets) = 21.29%
2011:
($271,626 (Net income) + (958 (Interest expense) ´ 0.70 (1- Tax rate)) / (1,343,126 + 1,250,000) / 2 (Average total assets) = 21.00%
Return on equity:
2012:
$304,501 (Net income) / ((1,193,673 + 1,024,498) / 2) (Average stockholders’ equity) = 27.46%
2011:
$271,626 (Net income) / ((1,024,498 + 930,000) / 2) (Average stockholders’ equity) = 27.79%
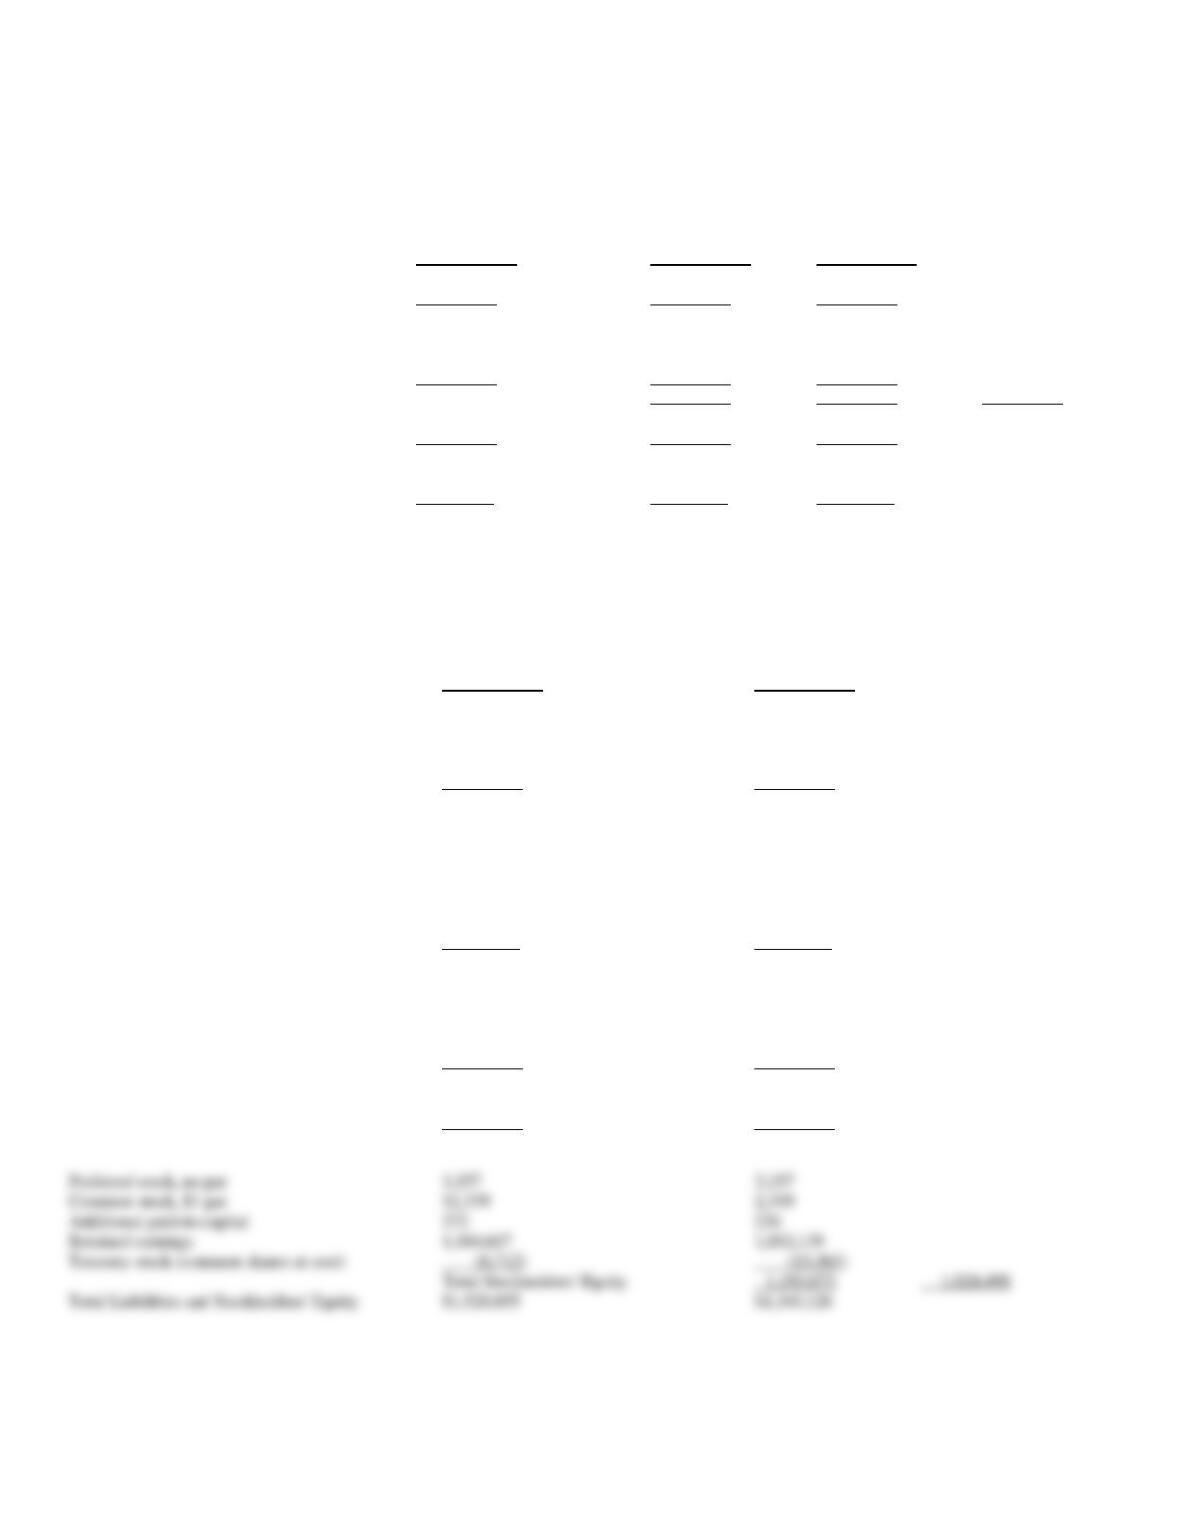
85. Dervish Industries, Inc.
The comparative financial statements for Dervish Industries, Inc. are provided below. All amounts are in
thousands except for per share amounts.
Statements of Income and Retained Earnings
for the Fiscal Years Ended:
June 30, 2012
June 30, 2011
June 30, 2010
Net sales
$2,004,719
$1,937,021
$1,835,987
Other income
18,636
17,153
14,614
Total revenues
2,023,355
1,954,174
1,850,601
Cost of goods sold
848,363
847,366
814,483
Selling, general, & administrative expenses
733,498
711,610
666,909
Interest expense
615
958
1,097
Total costs and expenses
1,582,476
1,559,934
1,482,489
Income before taxes
440,879
394,240
368,112
Income taxes
136,378
122,614
128,840
Net income
304,501
271,626
239,272
Retained earnings at beginning of year
1,032,139
898,512
497,481
Dividends declared
(152,023)
(137,999)
(87,301)
Retained earnings at end of year
$1,184,617
$1,032,139
$ 649,452
Per average share amounts:
Net income per share of common stock
$2.63
$2.34
$1.99
Dividends per share of common stock
$1.30
$1.17
$1.02
Balance Sheets
June 30, 2012
June 30, 2011
Cash
$ 214,572
$ 206,627
Short-term investments
137,112
120,728
Accounts receivable
194,877
175,967
Inventory
256,108
247,392
Other current assets
40,403
46,959
Total Current Assets
843,072
797,673
Long-term investments
39,888
26,375
Other non-current assets
92,183
59,566
Note receivable
25,522
29,038
Land
36,013
26,298
Buildings and building equipment
310,212
277,808
Machinery and equipment
642,656
566,766
Less: Accumulated depreciation
(468,691)
(440,398)
Total Assets
$1,520,855
$1,343,126
Accounts payable
$ 76,691
$ 71,001
Accrued expenses
67,848
78,378
Dividend payable
23,222
22,034
Income and other taxes payable
50,865
54,403
Total Current Liabilities
218,626
225,816
Bonds payable
68,244
61,938
Other non-current liabilities
40,312
30,874
Total Liabilities
327,182
318,628
Preferred stock, no par
3,157
3,157
Common stock, $1 par
12,339
2,339
Additional paid-in-capital
Retained earnings
1,184,617
1,032,139
Treasury stock (common shares at cost)
(6,712)
(13,363)
Total Stockholders’ Equity
1,193,673
1,024,498
Total Liabilities and Stockholders’ Equity
$1,520,855
$1,343,126
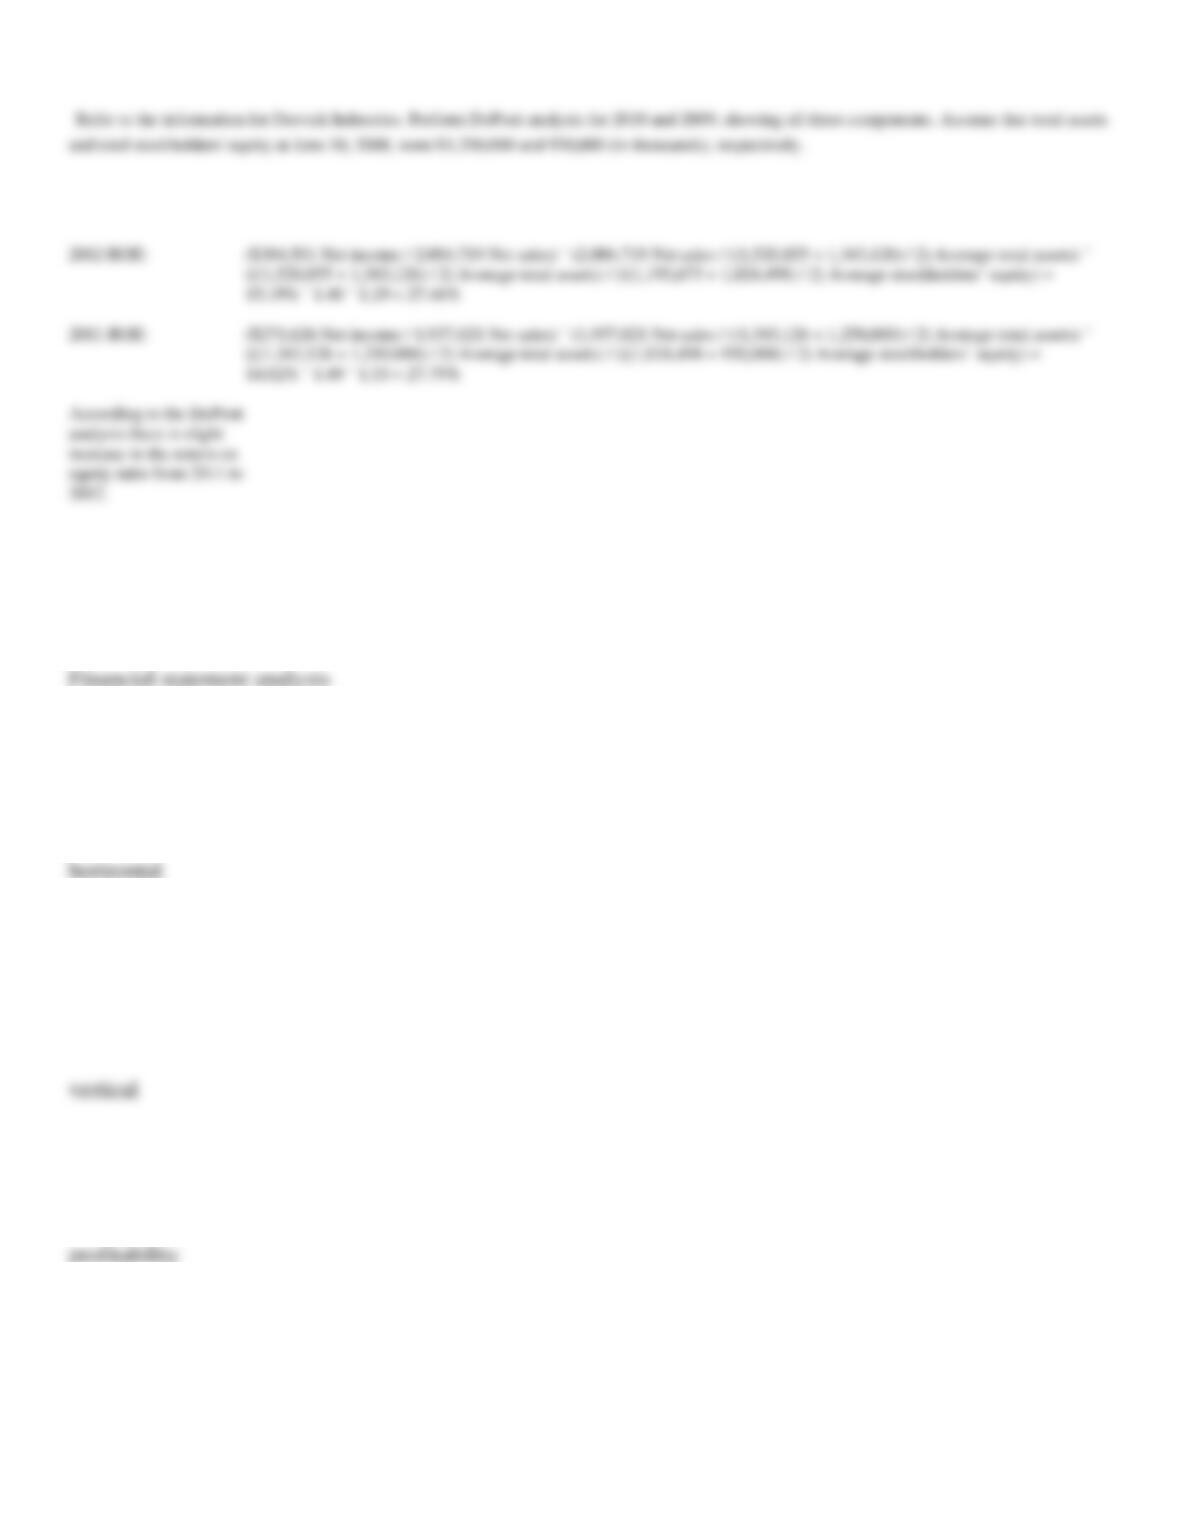
86. ____________________ is the process of applying analytical tools to a company’s financial statements to
understand the company’s financial health.
87. In ____________________ analysis, each financial statement line item is expressed as a percent of a base
year, which is typically the earliest year shown.
88. In ____________________ analysis, each financial statement line item is expressed as a percent of the
largest amount on the statement, which is net sales or total assets for the income statement or balance sheet,
respectively.
89. Various financial ratios, including return ratios, are categorized as ____________________ ratios.

90. ____________________ represents the return on each share of stock owned by an investor.
91. A higher ____________________ ratio indicates a greater ability to generate profits from sales.
92. ____________________ refers to the likelihood that a company will be able to pay its current obligations as
they come due.
93. ____________________ assets generally include cash, accounts receivable, and short-term investments.
94. A company’s relative mix of debt and equity financing is referred to as its ____________________.
95. The three aspects of return on equity (ROE) recognized by DuPont analysis are ____________________,
____________________, and ____________________.