Quiz B 12-13

12-14 Chapter 12 Comparing Two Means
Chapter 12: Comparing Two Means – Quiz C – Multiple Choice
Name_________________________
12.3.6. Determine and perform the appropriate t‐test.
1. Data were collected on annual personal time (in hours) taken by a random sample of 16
women and 7 men employed by a medium sized company. The women took an average of
24.75 hours of personal time per year with a standard deviation of 2.84 hours. The men
took an average of 21.89 hours of personal time per year with a standard deviation of 3.29
hours. The Human Resources Department believes that women tend to take more personal
time than men because they tend to be the primary child care givers in the family. The t–
test for two means is appropriate in this situation because
A. women and men are dependent samples.
B. women and men are independent samples.
C. women and men are matched samples.
D. the observations are paired.
E. None of the above.
12.3.6. Determine and perform the appropriate t‐test.
2. Data were collected on annual personal time (in hours) taken by a random sample of 16
women (group1) and 7 men (group 2) employed by a medium sized company. The women
took an average of 24.75 hours of personal time per year with a standard deviation of 2.84
hours. The men took an average of 21.89 hours of personal time per year with a standard
deviation of 3.29 hours. The Human Resources Department believes that women tend to
take more personal time than men because they tend to be the primary child care givers in
the family. The correct null and alternative hypotheses to test this belief are
A. H0: µ1 – µ2 = 0 and HA: µ1 – µ2 < 0.
B. H0: µ1 – µ2 = 0 and HA: µ1 – µ2 ≠ 0.
C. H0: µ1 – µ2 = 0 and HA: µ1 – µ2 > 0.
D. H0: µ1 – µ2 > 0 and HA: µ1 – µ2 < 0.
E. None of the above.
12.1.3. Construct and interpret a confidence interval for a two‐sample t‐test.
3. Data were collected on annual personal time (in hours) taken by a random sample of 16
women and 7 men employed by a medium sized company. The women took an average of
24.75 hours of personal time per year with a standard deviation of 2.84 hours. The men
took an average of 21.89 hours of personal time per year with a standard deviation of 3.29
hours. The standard error of the sampling distribution for the difference between the two
means is
A. 2.05
B. 5.02
C. 2.24
D. 1.43
E. 0.48

Quiz C 12-15
12.3.6. Determine and perform the appropriate t‐test.
4. Data were collected on annual personal time (in hours) taken by a random sample of 16
women (group1) and 7 men (group 2) employed by a medium sized company. The women
took an average of 24.75 hours of personal time per year with a standard deviation of 2.84
hours. The men took an average of 21.89 hours of personal time per year with a standard
deviation of 3.29 hours. The Human Resources Department believes that women tend to
take more personal time than men because they tend to be the primary child care givers in
the family. The results of the test are t = 2.02 with an associated P-value of 0.0352. The
correct conclusion at α = 0.05 is to
A. reject the null hypothesis.
B. fail to reject the null hypothesis.
C. conclude that women take a higher average number of hours of personal time per year
compared to men.
D. Both A and C.
E. Both B and C.
12.1.3. Construct and interpret a confidence interval for a two‐sample t‐test.
5. A consumer group was interested in comparing the operating time of cordless
toothbrushes manufactured by two different companies. Group members took a random
sample of 18 toothbrushes from Company A and 15 from Company B. Each was charged
overnight and the number of hours of use before needing to be recharged was recorded.
Company A toothbrushes operated for an average of 119.7 hours with a standard deviation
of 1.74 hours; Company B toothbrushes operated for an average of 120.6 hours with a
standard deviation of 1.72 hours. The 90% confidence interval is (-1.93, 0.13). The correct
interpretation is
A. We are 90% confident that, on average, there is no difference in operating hours
between toothbrushes from Company A compared to those from Company B.
B. We are 90% confident that, on average, the toothbrushes from Company A operate
longer before needing to be recharged than the toothbrushes from Company B.
C. We are 90% confident that, on average, the toothbrushes from Company B operate
longer before needing to be recharged than the toothbrushes from Company A.
D. We are 90% confident that, on average, there is a difference in operating hours between
toothbrushes from Company A compared to those from Company B.
E. None of the above.

12-16 Chapter 12 Comparing Two Means
12.3.6. Determine and perform the appropriate t‐test.
6. An army depot that overhauls ground mobile radar systems is interested in improving its
processes. One problem involves troubleshooting a particular component that has a high
failure rate after it has been repaired and reinstalled in the system. The shop floor
supervisor believes that having standard work procedures in place will reduce the time
required for troubleshooting this component. Time (in minutes) required troubleshooting
this component without and with the standard work procedure is recorded for a sample of
19 employees. In order to determine if having a standard work procedure in place reduces
troubleshooting time, they should use
A. a one-tailed paired t-test.
B. a two-tailed test of two independent means.
C. a one-tailed test of two independent means.
D. a two-tailed paired t-test.
E. a test of two proportions.

Quiz C 12-17
12.1.1. Calculate summary statistics for a set of two samples.
7. An army depot that overhauls ground mobile radar systems is interested in improving its
processes. One problem involves troubleshooting a particular component that has a high
failure rate after it has been repaired and reinstalled in the system. The shop floor
supervisor believes that having standard work procedures in place will reduce the time
required for troubleshooting this component. Time (in minutes) required troubleshooting
this component without and with the standard work procedure is recorded for a sample of
19 employees. The standard error of the mean difference is
A. 25.105
B. 2.307
C. 0.529
D. 4.3589
E. None of the above.
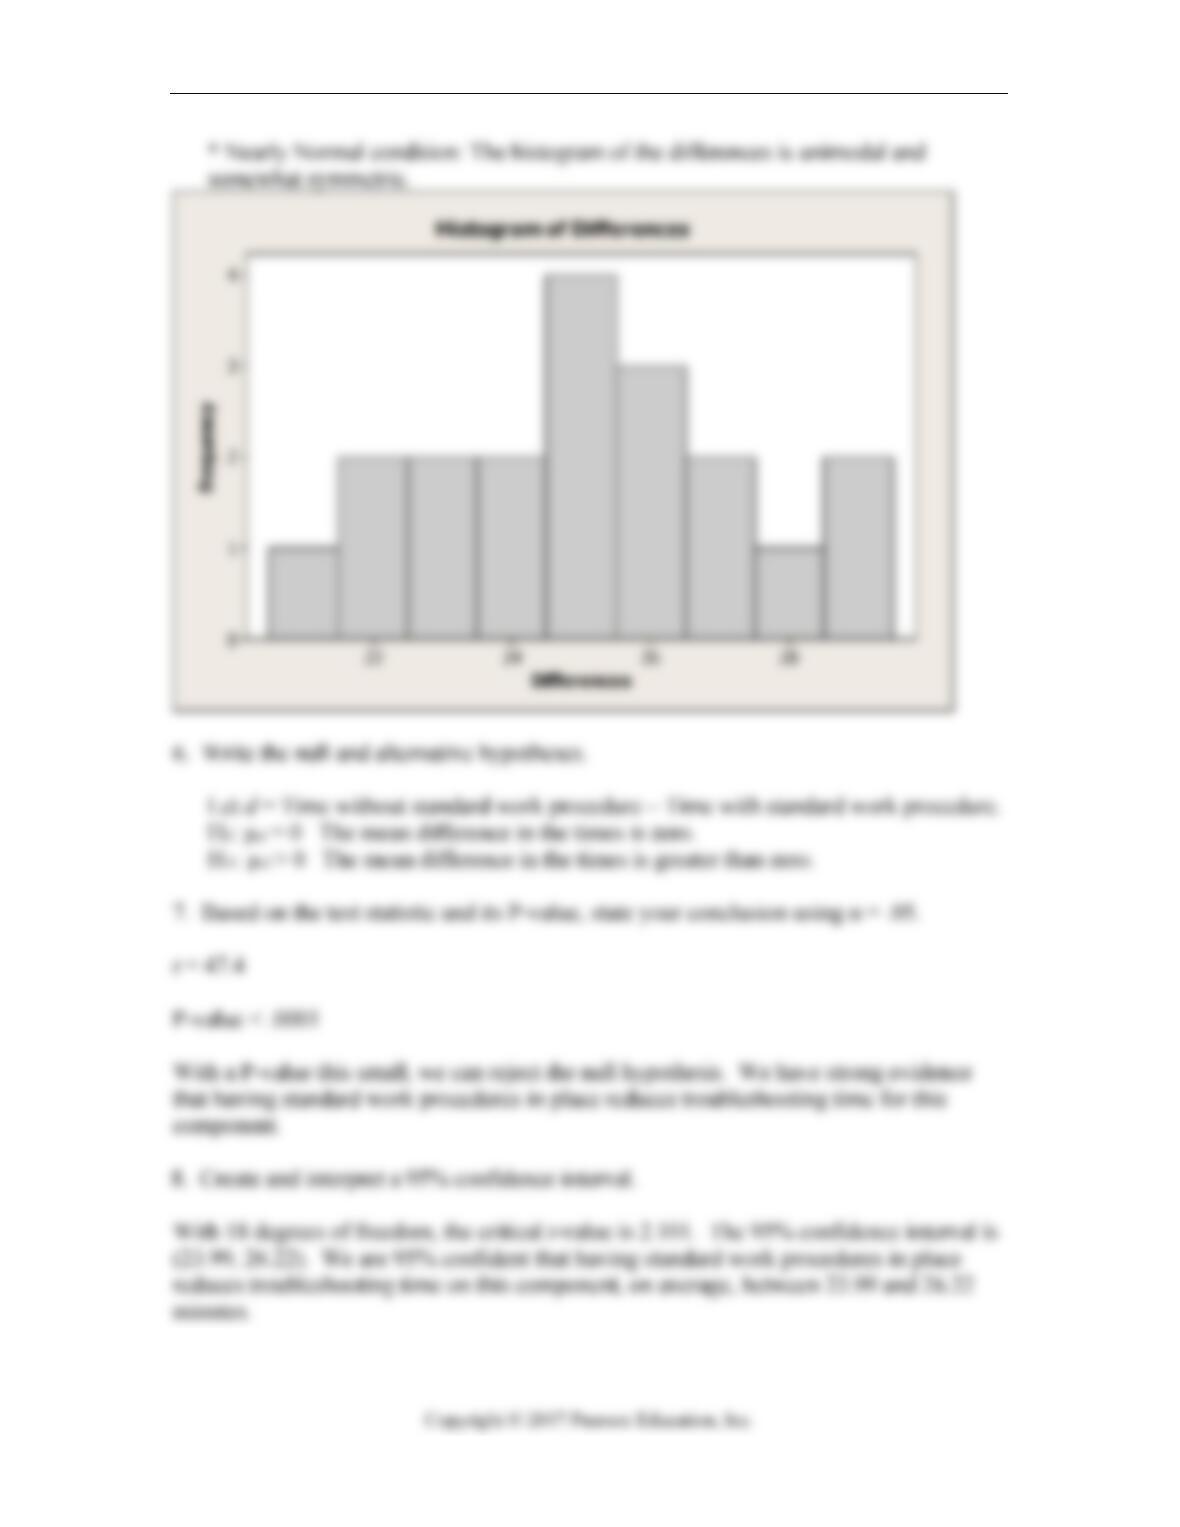
Without
Standard
Work
Procedure
With Standard
Work
Procedure
Difference
Without –
With
142 119 23
144 118 26
153 126 27
148 119 29
146 121 25
149 125 24
138 116 22
145 120 25
153 124 29
160 138 22
163 135 28
170 144 26
169 142 27
151 128 23
152 131 21
167 141 26
164 140 24
165 140 25
163 138 25

12-18 Chapter 12 Comparing Two Means
12.1.3. Construct and interpret a confidence interval for a two‐sample t‐test.
8. An army depot that overhauls ground mobile radar systems is interested in improving its
processes. One problem involves troubleshooting a particular component that has a high
failure rate after it has been repaired and reinstalled in the system. The shop floor
supervisor believes that having standard work procedures in place will reduce the time
required for troubleshooting this component. Time (in minutes) required troubleshooting
this component without and with the standard work procedure is recorded for a sample of
19 employees. Assuming that we define our differences as Time without standard work
procedure – Time with standard work procedure, the correct alternative hypothesis is
A. µd = 0.
B. µd < 0.
C. µd > 0.
D. µd ≠ 0.
E. None of the above.
12.2.2. Investigate and interpret P‐values in the context of t‐tests.
9. An army depot that overhauls ground mobile radar systems is interested in improving its
processes. One problem involves troubleshooting a particular component that has a high
failure rate after it has been repaired and reinstalled in the system. The shop floor
supervisor believes that having standard work procedures in place will reduce the time
required for troubleshooting this component. Time (in minutes) required troubleshooting
this component without and with the standard work procedure is recorded for a sample of
19 employees. The P-value associated with the calculated test statistic is < 0.001. At α =
0.05, the correct conclusion is to
A. reject the null hypothesis.
B. fail to reject the null hypothesis.
C. conclude that having standard work procedures in place reduces troubleshooting time for
this component.
D. Both A and C.
E. Both B and C.
12.3.6. Determine and perform the appropriate t‐test.
10. Which of the following is not an assumption and/or condition for the paired t-test?
A. Nearly Normal Condition
B. Independent Groups Assumption
C. Paired Data Assumption
D. Randomization Condition
E. All of the above
Quiz C 12-19
Chapter 12 – Quiz C – Key

12-20 Chapter 12 Comparing Two Means
Chapter 13: Comparing Two Means – Quiz D – Multiple Choice
Name_________________________
12.3.5. Determine whether two samples are independent or paired.
1. A consumer group was interested in comparing the operating time of cordless
toothbrushes manufactured by two different companies. Group members took a random
sample of 18 toothbrushes from Company A and 15 from Company B. Each was charged
overnight and the number of hours of use before needing to be recharged was recorded.
Company A toothbrushes operated for an average of 119.7 hours with a standard deviation
of 1.74 hours; Company B toothbrushes operated for an average of 120.6 hours with a
standard deviation of 1.72 hours. The t-test for two means is appropriate in this situation
because
A. the two companies are dependent.
B. the two companies are independent.
C. the two companies are matched samples.
D. the observations are paired.
E. None of the above.
12.3.6. Determine and perform the appropriate t‐test.
2. A consumer group was interested in comparing the operating time of cordless
toothbrushes manufactured by two different companies. Group members took a random
sample of 18 toothbrushes from Company A and 15 from Company B. Each was charged
overnight and the number of hours of use before needing to be recharged was recorded.
Company A toothbrushes operated for an average of 119.7 hours with a standard deviation
of 1.74 hours; Company B toothbrushes operated for an average of 120.6 hours with a
standard deviation of 1.72 hours. Do these samples indicate that Company B toothbrushes
operate more hours on average than Company A toothbrushes? The correct hypotheses to
address this question are
A. H0: µA – µB = 0 and HA: µA – µB < 0
B. H0: µA – µB = 0 and HA: µA – µB ≠ 0.
C. H0: µA – µB = 0 and HA: µA – µB > 0.
D. H0: µA – µB > 0 and HA: µA – µB < 0.
E. None of the above.

Quiz D 12-21
12.3.2. Investigate and interpret P‐values in the context of t‐tests.
3. Results of a small experiment show that people are likely to offer a different amount for
used exercise equipment when bargaining with a friend than when bargaining with a
stranger. The p-value from testing the difference in mean offers was equal to 0.00162.
At an α = 0.05, the correct conclusion is to
A. reject the null hypothesis.
B. fail to reject the null hypothesis.
C. conclude that there is no difference between bargaining with a stranger versus a friend.
D. Both A and C.
E. Both B and C.
12.1.3. Construct and interpret a confidence interval for a two‐sample t‐test.
4. Data were collected on annual personal time (in hours) taken by a random sample of 16
women and 7 men employed by a medium sized company. The women took an average of
24.75 hours of personal time per year with a standard deviation of 2.84 hours. The men
took an average of 21.89 hours of personal time per year with a standard deviation of 3.29
hours. The correct 90% confidence interval for the difference between women and men in
the average number of hours of personal time taken per year is
A. 0.30 to 5.48 hours.
B. -0.50 to 3.21 hours.
C. -4.67 to -0.62 hours.
D. 1.27 to 6.89 hours.
E. None of the above.
12.5.4. Perform a pooled t‐test.
5. Data were collected on annual personal time (in hours) taken by a random sample of 16
women and 20 men employed by a medium-sized company. The women took an average
of 24.75 hours of personal time per year with a standard deviation of 2.84 hours. The men
took an average of 20.5 hours of personal time per year with a standard deviation of 2.75
hours. The pooled estimate of the variance is
A. 264.6715
B. 2.790
C. 7.785
D. 12.998
E. None of the above.

12-22 Chapter 12 Comparing Two Means
12.5.4. Perform a pooled t‐test.
6. Data were collected on annual personal time (in hours) taken by a random sample of 16
women and 20 men employed by a medium-sized company. The women took an average
of 24.75 hours of personal time per year with a standard deviation of 2.84 hours. The men
took an average of 20.5 hours of personal time per year with a standard deviation of 2.75
hours. If we use the pooled t-test to see if there is a difference between the two groups, the
degrees of freedom for the appropriate t-statistic is
A. 36
B. 34
C. 20
D. 16
E. None of the above.
12.3.6. Determine and perform the appropriate t‐test.
7. A mid-sized company has decided to implement an enterprise resource planning (ERP)
system, and management suspects that many of its employees are concerned about the
planned implementation. Managers are considering holding informational workshops to
help decrease anxiety levels among employees. To determine whether such an approach
would be effective, they randomly select 16 employees to participate in a pilot workshop.
These employees were given a questionnaire to measure anxiety levels about ERP before
and after participating in the workshop. To determine if anxiety levels about ERP
decreases as a result of the workshop, they should use a
A. one-tailed paired t-test.
B. two-tailed test of two independent means.
C. one-tailed test of two independent means.
D. two-tailed paired t-test.
E. one-tailed test of two proportions.
12.3.6. Determine and perform the appropriate t‐test.
8. A mid-sized company has decided to implement an enterprise resource planning (ERP)
system, and management suspects that many of its employees are concerned about the
planned implementation. Managers are considering holding informational workshops to
help decrease anxiety levels among employees. They randomly select 16 employees to
participate in a pilot workshop. These employees were given a questionnaire to measure
anxiety levels about ERP before and after participating in the workshop. If we let d = post-
workshop anxiety level – pre-workshop anxiety level, the correct alternative hypothesis to
determine if this approach was successful is
A. µd = 0
B. µd < 0
C. µd > 0
D. µd ≠ 0
E. µd ≤ 0

Quiz D 12-23
12.2.2. Investigate and interpret P‐values in the context of t‐tests.
9. Managers are considering holding informational workshops to help decrease anxiety
levels among employees. They randomly select 20 employees to participate in a pilot
workshop. These employees were given a questionnaire to measure anxiety levels before
and after participating in the workshop. A test was performed to determine if the workshop
was successful in decreasing anxiety levels. The test results yielded a P-value of 0.008.
The correct conclusion at α = .05 is
A. to accept the null hypothesis.
B. to reject the null hypothesis.
C. to conclude that participating in the workshop decreases employee anxiety about ERP.
D. both A and C.
E. both B and C.
12.1.3. Construct and interpret a confidence interval for a two‐sample t‐test.
10. A mid-sized company has decided to implement an enterprise resource planning (ERP)
system, and management suspects that many of its employees are concerned about the
planned implementation. Managers are considering holding informational workshops to
help decrease anxiety levels among employees. They randomly select 16 employees to
participate in a pilot workshop. These employees were given a questionnaire to measure
anxiety levels about ERP before and after participating in the workshop. At the 90%
confidence level, what is the margin of error for the mean difference in anxiety levels pre-
and post-workshop?
Pre-workshop
anxiety level 7 6 9 5 6 7 5 7 6 4 3 2 1 3 4 2
Post-workshop
anxiety level 4 3 7 3 4 5 4 6 5 3 2 2 1 3 4 3
Difference
(Post – Pre) -3 -3 -2 -2 -2 -2 -1 -1 -1 -1 -1 0 0 0 0 1
A. 1.753
B. 1.147
C. 0.287
D. 0.503
E. 2.010

12-24 Chapter 12 Comparing Two Means
Chapter 12 – Quiz D – Key