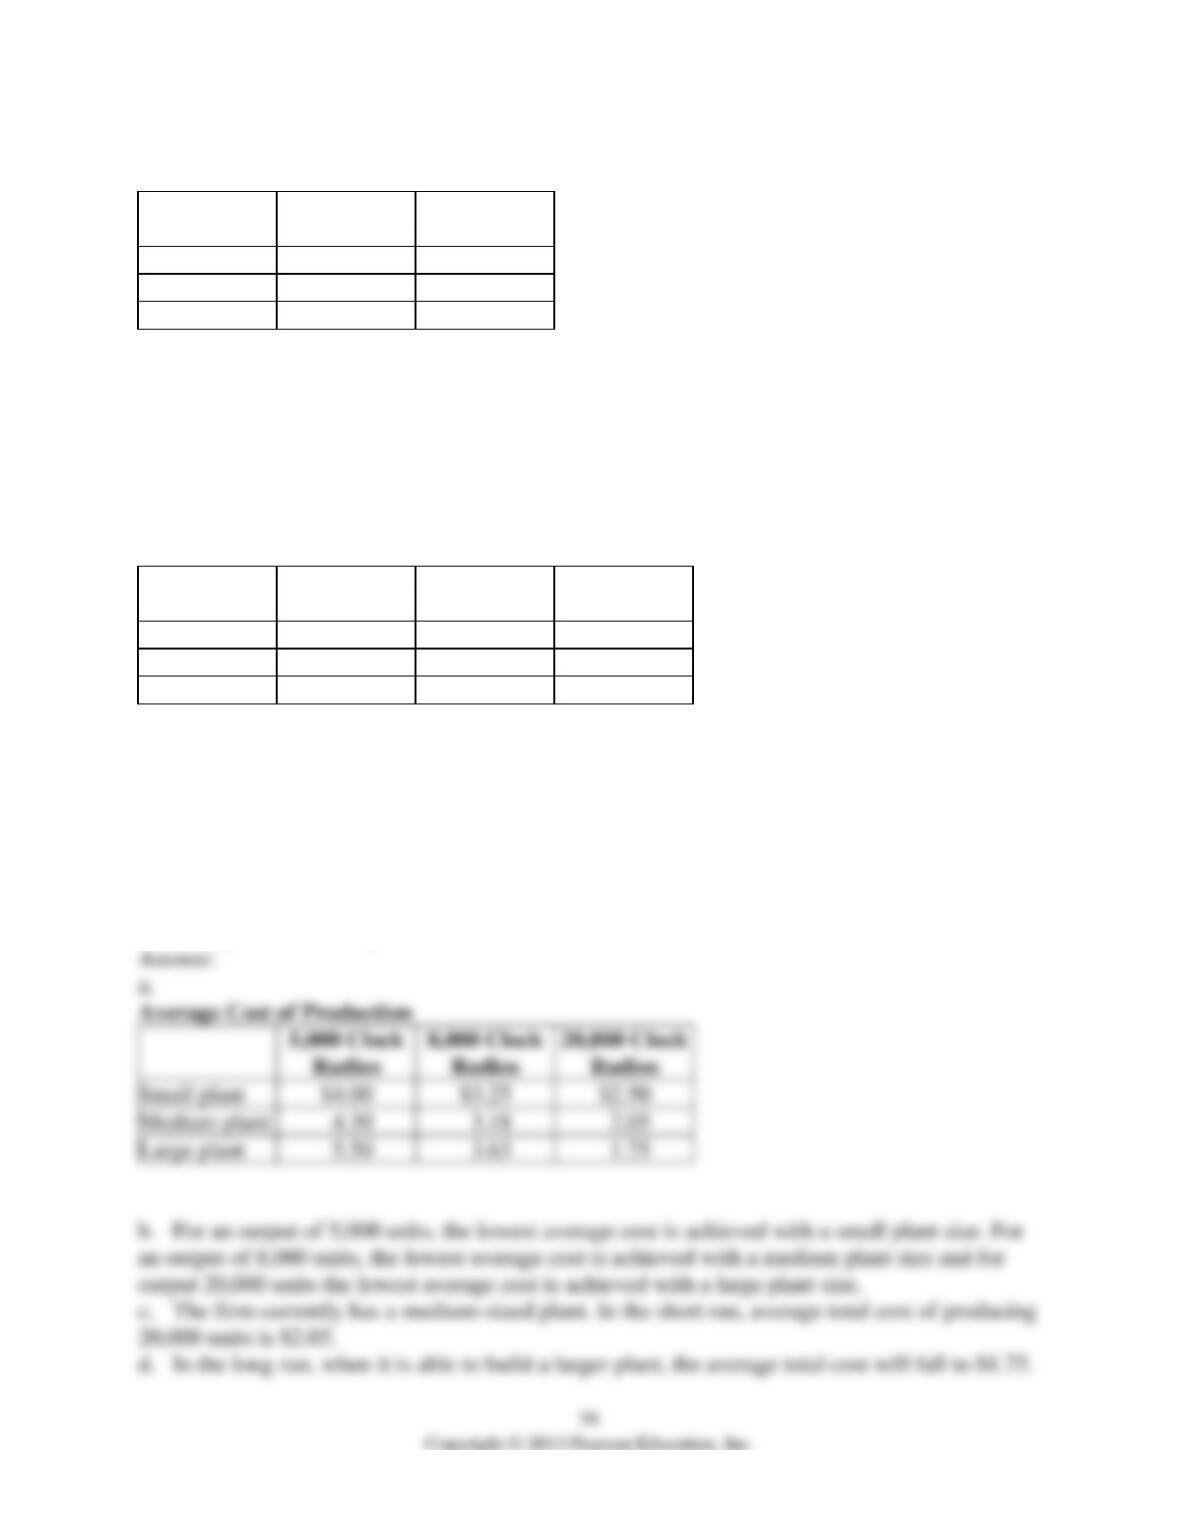
Table 11-6
Fixed Cost
Average
Variable Cost
Small plant
$10,000
$2.00
Medium plant
15,000
1.30
Large plant
25,000
0.50
29) Refer to Table 11-6. Clock It To Me manufactures clock radios. The table above shows
estimates of fixed cost per period and average variable cost for three possible plant sizes.
a. You are employed as the company’s cost accountant and have been asked to prepare cost
estimates for various output levels for each of the three possible plant sizes. Record your
calculations in the table below.
Average Cost of Production
5,000 Clock
Radios
8,000 Clock
Radios
20,000 Clock
Radios
Small plant
Medium plant
Large plant
b. For each of the three output levels, which plant size will generate the lowest average total cost
of production?
c. Suppose the firm currently sells 8,000 clock radios per period (using the optimal plant size for
this output level). Now, however, it has just secured a long-term contract to supply 20,000 clock
radios per period. In the short run, what is the average total cost of producing 20,000 clock
radios? Provide a numerical value based on your answer in part a.
d. What happens to average total cost of production in the long run? Provide a numerical value
based on your answer in part a.
5,000 Clock
Radios
8,000 Clock
Radios
20,000 Clock
Radios
Small plant
$4.00
$3.25
$2.50
Medium plant
4.30
3.18
2.05
Large plant
5.50
3.63
1.75
30) State the law of diminishing returns. How do diminishing returns differ from diseconomies
of scale? Be sure to define diseconomies of scale in your answer.
31) What is minimum efficient scale? What is likely to happen in the long run to firms that do
not reach minimum efficient scale?
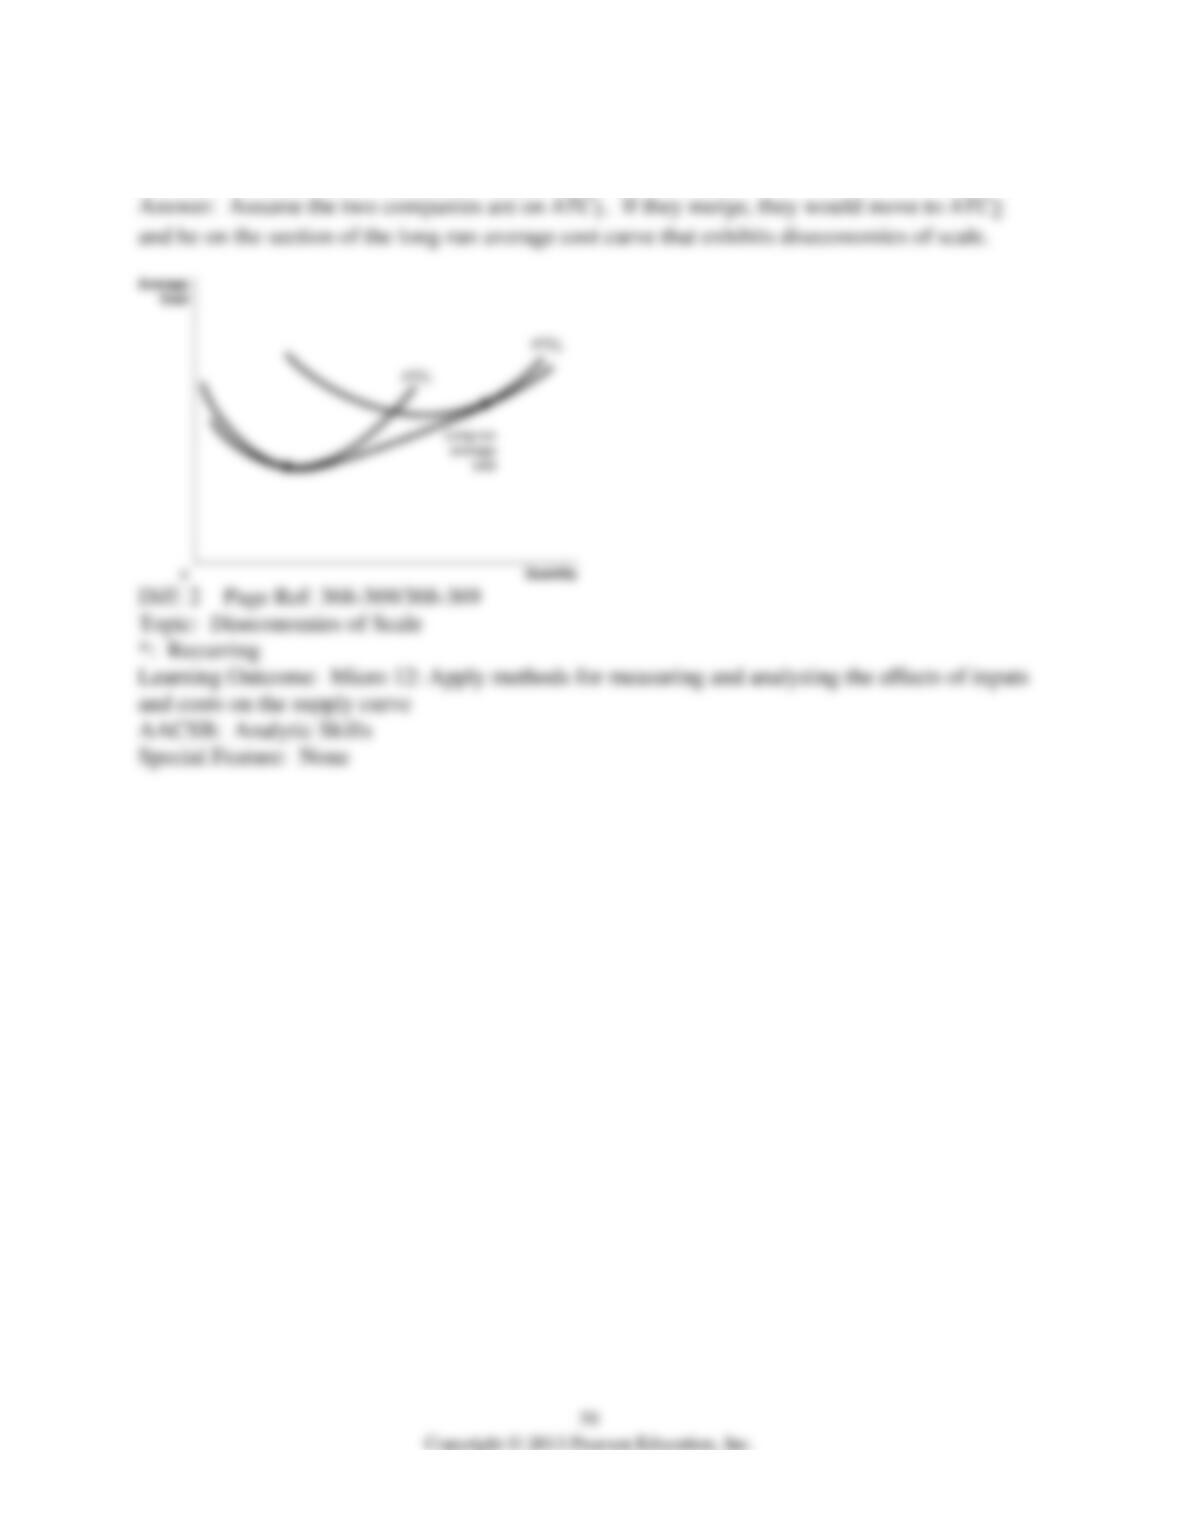
32) Use a long-run average cost curve graph to illustrate how diseconomies of scale would not
make it beneficial for two companies to go through with a merger.
11.7 Appendix: Using Isoquants and Isocosts to Understand Production and Cost
1) A curve that shows all the combinations of two inputs, such as labor and capital, that will
produce the same level of output is called
A) an isoquant.
B) an isocost line
C) a budget line.
D) an optimal input combination curve.
2) The rate at which a firm is able to substitute one input for another while keeping the level of
output constant is called the
A) opportunity cost of inputs.
B) marginal rate of technical substitution.
C) input trade-off rate.
D) isoquant substitution rate.
3) The typical shape of an isoquant is
A) convex towards the origin.
B) concave towards the origin.
C) linear and downward sloping.
D) linear and upward sloping.
4) The slope of a typical isoquant is negative because to produce a given output, a producer
A) will use more of one input only if it uses more of another.
B) can use less of one input only if the productivity of that input increases
C) can use less of one input only if it uses more of another.
D) will use more of one input only if the price of that input falls.
5) The marginal rate of technical substitution is measured by
A) the slope of the isoquant.
B) the relative input prices.
C) the slope of the isocost line.
D) the ratio of the product’s price to the product’s cost of production.
6) The slope of an isocost line ________ and equals the negative of ________.
A) increases as we move down the line; the ratio of input prices
B) decreases as we move down the line; the ratio of the marginal products
C) is constant; the ratio of input prices
D) is constant; the ratio of the marginal products
7) As a firm moves to higher isocost lines,
A) its profits increase.
B) its revenue increases.
C) its input price ratio increases.
D) its total cost increases.
8) An isocost line shows
A) combinations of two inputs that result in the same total cost for a firm.
B) combinations of two inputs that result in the same total output for a firm.
C) combinations of the two inputs that result in the same profit for a firm.
D) the different levels of total cost that result from various combinations of two inputs.
9) Suppose the price of capital and labor remain constant. As a firm’s expenditures for capital
and labor increase, its isocost line
A) shifts out parallel to the original isocost line.
B) shifts in parallel to the original isocost line.
C) rotates outward on the Y-intercept.
D) rotates outward on the X-intercept.
10) On an isoquant/isocost graph, the least cost input combination of producing a given output is
A) any point on the isoquant curve.
B) any point on the isocost curve.
C) given by the tangency between the isoquant curve and the isocost line.
D) one of the intercept values on the graph.
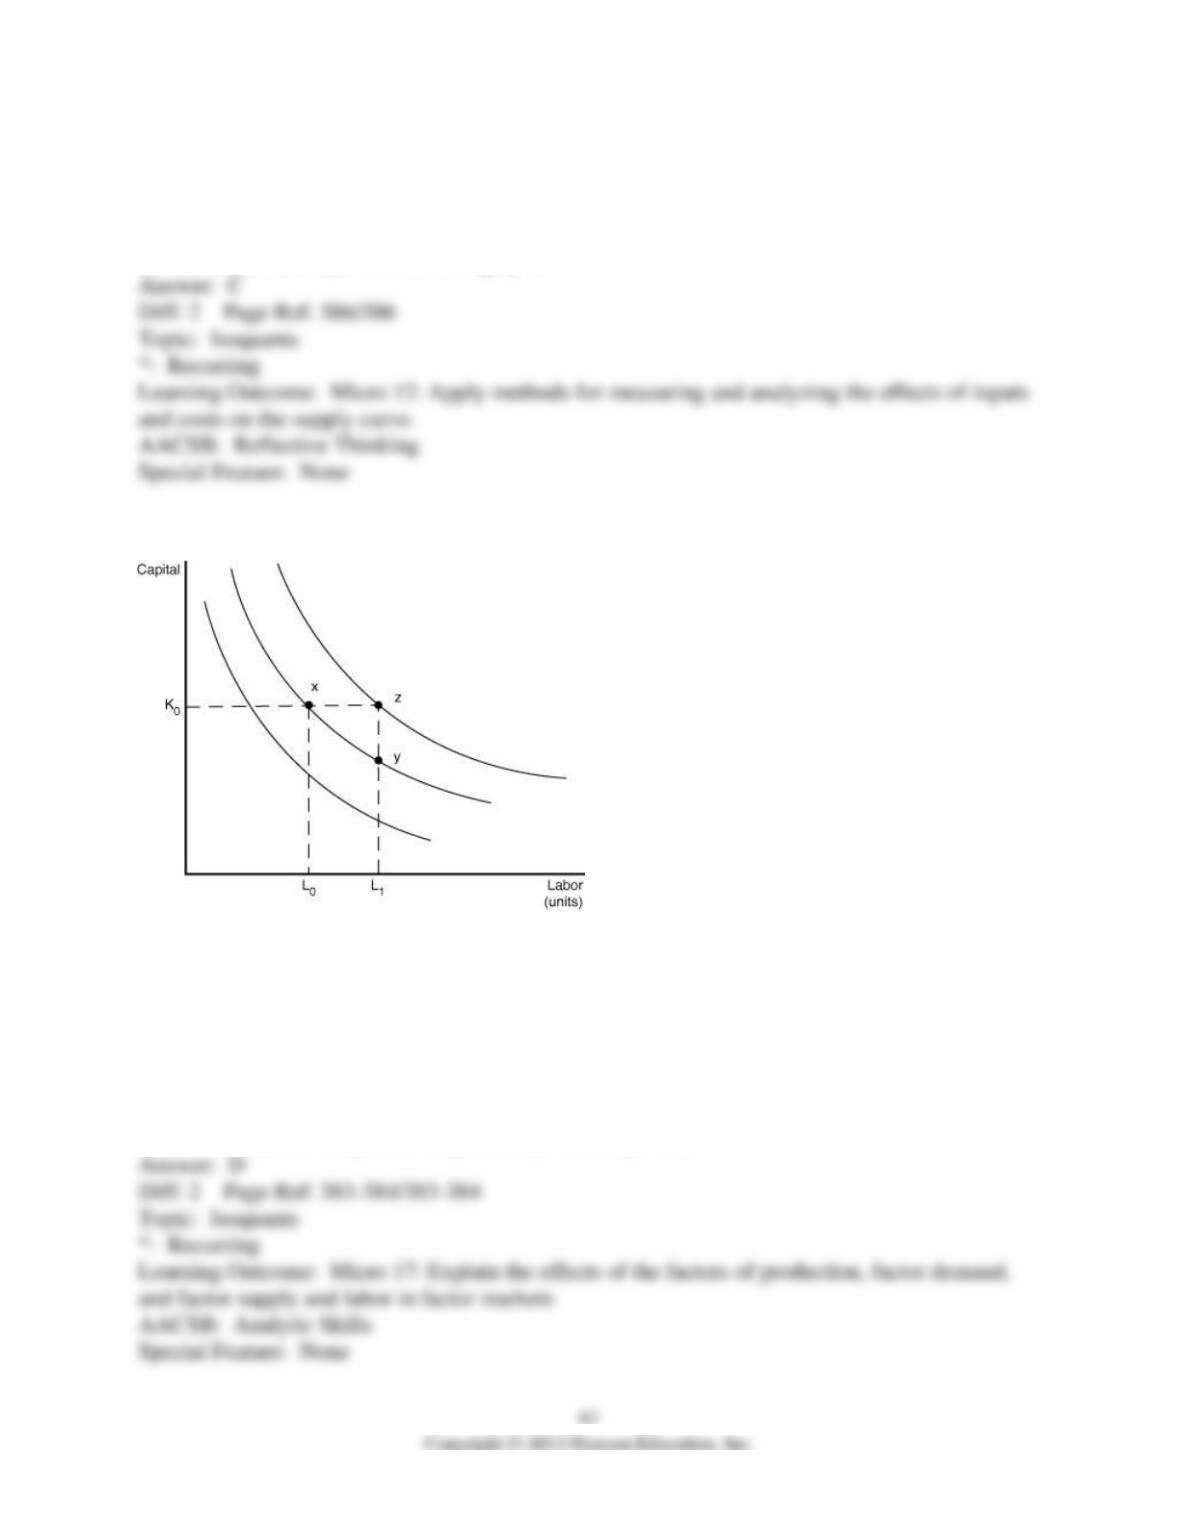
Figure 11-7
11) Refer to Figure 11-7. The figure above illustrates a series of isoquants. Which of the
following statements is true?
A) Points x, z, and y all represent the same output.
B) Points z and y represent the same output; this output is produced with more capital at z than at
y.
C) Point x and y represent the same output but the cost of production at y is greater than the cost
of production at x.
D) Point z represents a greater output than point x or point y.
12) A change in the slope of an isocost line is due to a change in
A) the output price.
B) the price of one or both inputs.
C) total cost.
D) quantity of output.
13) Consider a firm that uses two inputs, labor and capital, to produce its output. Assume labor is
measured on the horizontal axis and capital on the vertical axis. Which of the following best
explains why the marginal rate of technical substitution decreases in absolute value as we move
down an isoquant?
A) The law of diminishing returns: for a given decline in capital, decreasing amounts of labor are
required to produce the same level of output.
B) The law of increasing marginal opportunity cost: if a firm uses less and less capital it must use
more and more labor, which drives up the cost of labor.
C) The law of diminishing returns: for a given decline in capital, increasing amounts of labor are
required to produce the same level of output.
D) The law of imperfect substitutability: labor and capital are not perfect substitutes; therefore, a
firm must replace decreases in capital with increases in labor.
14) Suppose two countries use different combinations of inputs, such as labor and capital, to
produce the same product. This implies all of the following except that
A) the two countries use different technologies to produce the product.
B) the inputs are not equally productive in the two countries.
C) the prices of the inputs are not the same in the countries.
D) one country is more efficient in the production of the good than the other.
15) Suppose a firm uses labor and capital to produce output. The last unit of labor hired has a
marginal product of 12 units of output, and the last unit of capital employed has a marginal
product of 20 units. Use the optimal combination of inputs rule to calculate the price of capital if
the price of labor is $6 per unit. The price of capital is
A) $2.
B) $10.
C) $20.
D) impossible to determine with the information given.
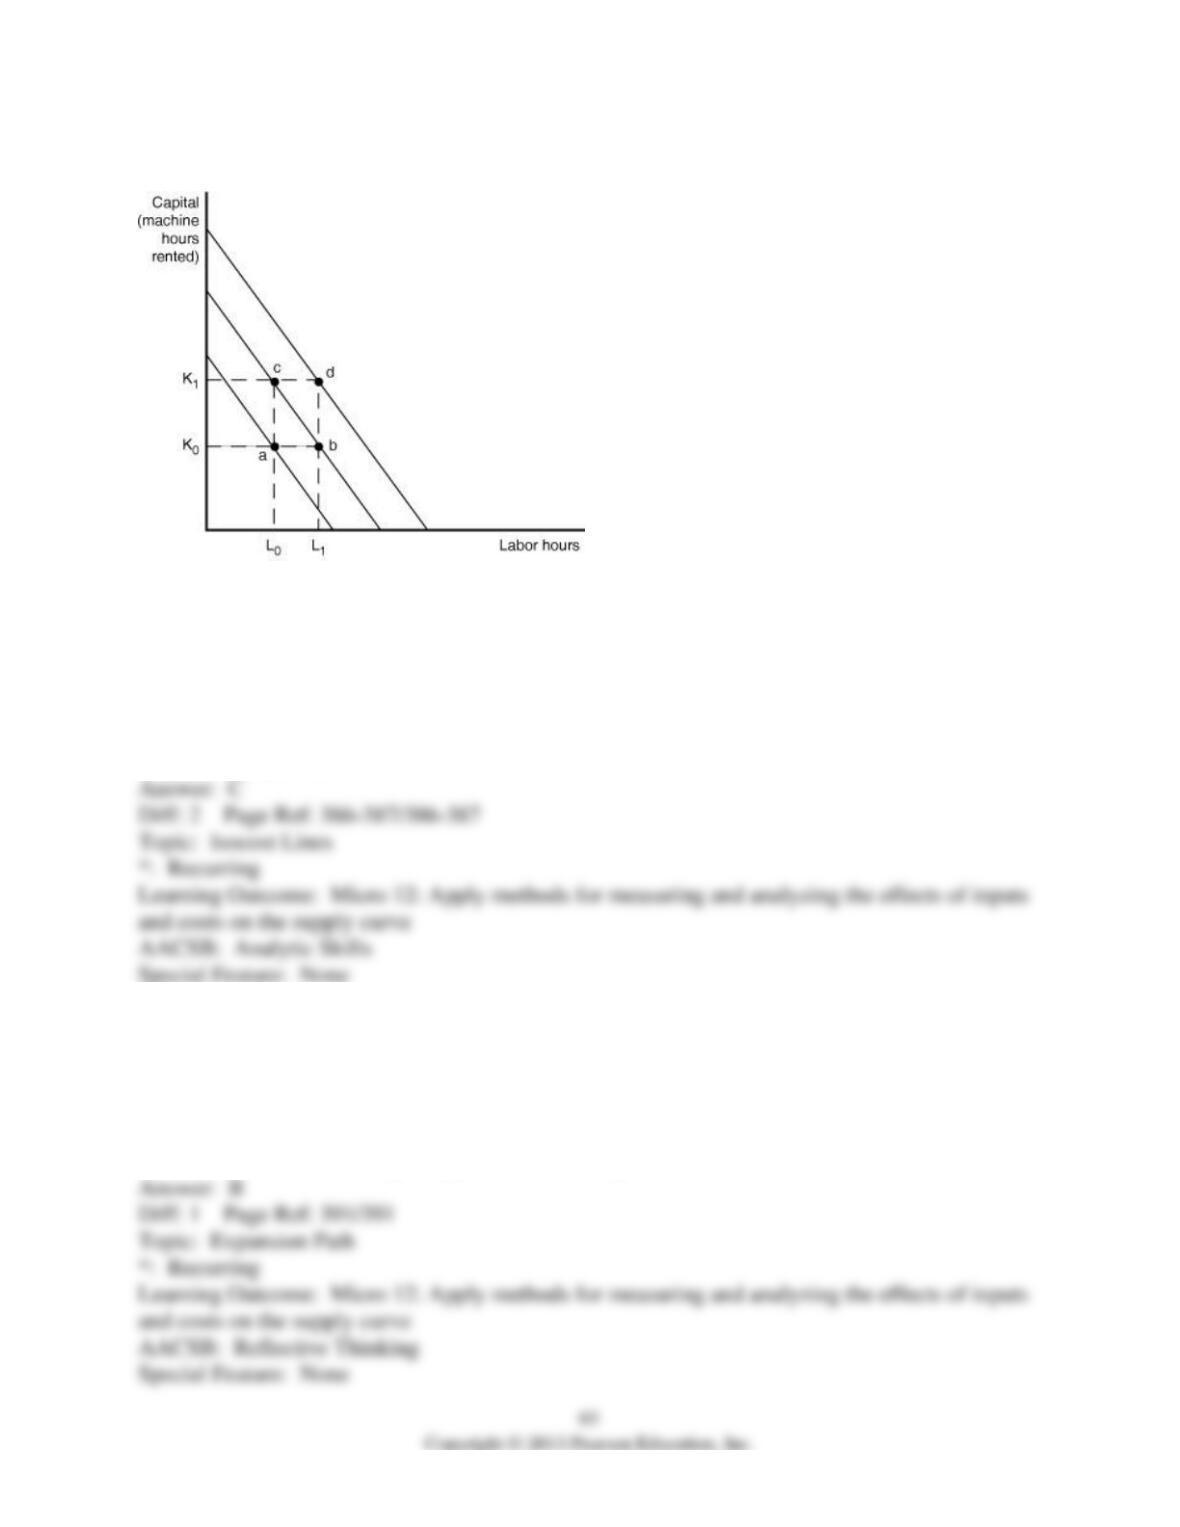
Figure 11-8
16) Refer to Figure 11-8. Assume that production isoquants are convex. Total cost and output
produced must increase for each of the following movements except one. Which movement is
the exception?
A) point a to point b
B) point a to point c
C) point b to point c
D) point b to point d
17) A firm’s expansion path
A) is the same thing as its long-run average cost curve.
B) is a curve that shows a firm’s cost-minimizing combination of inputs for every level of output,
holding input prices constant.
C) shows the targeted growth rate in sales over the long run.
D) is a curve that shows expected profits at various price levels.
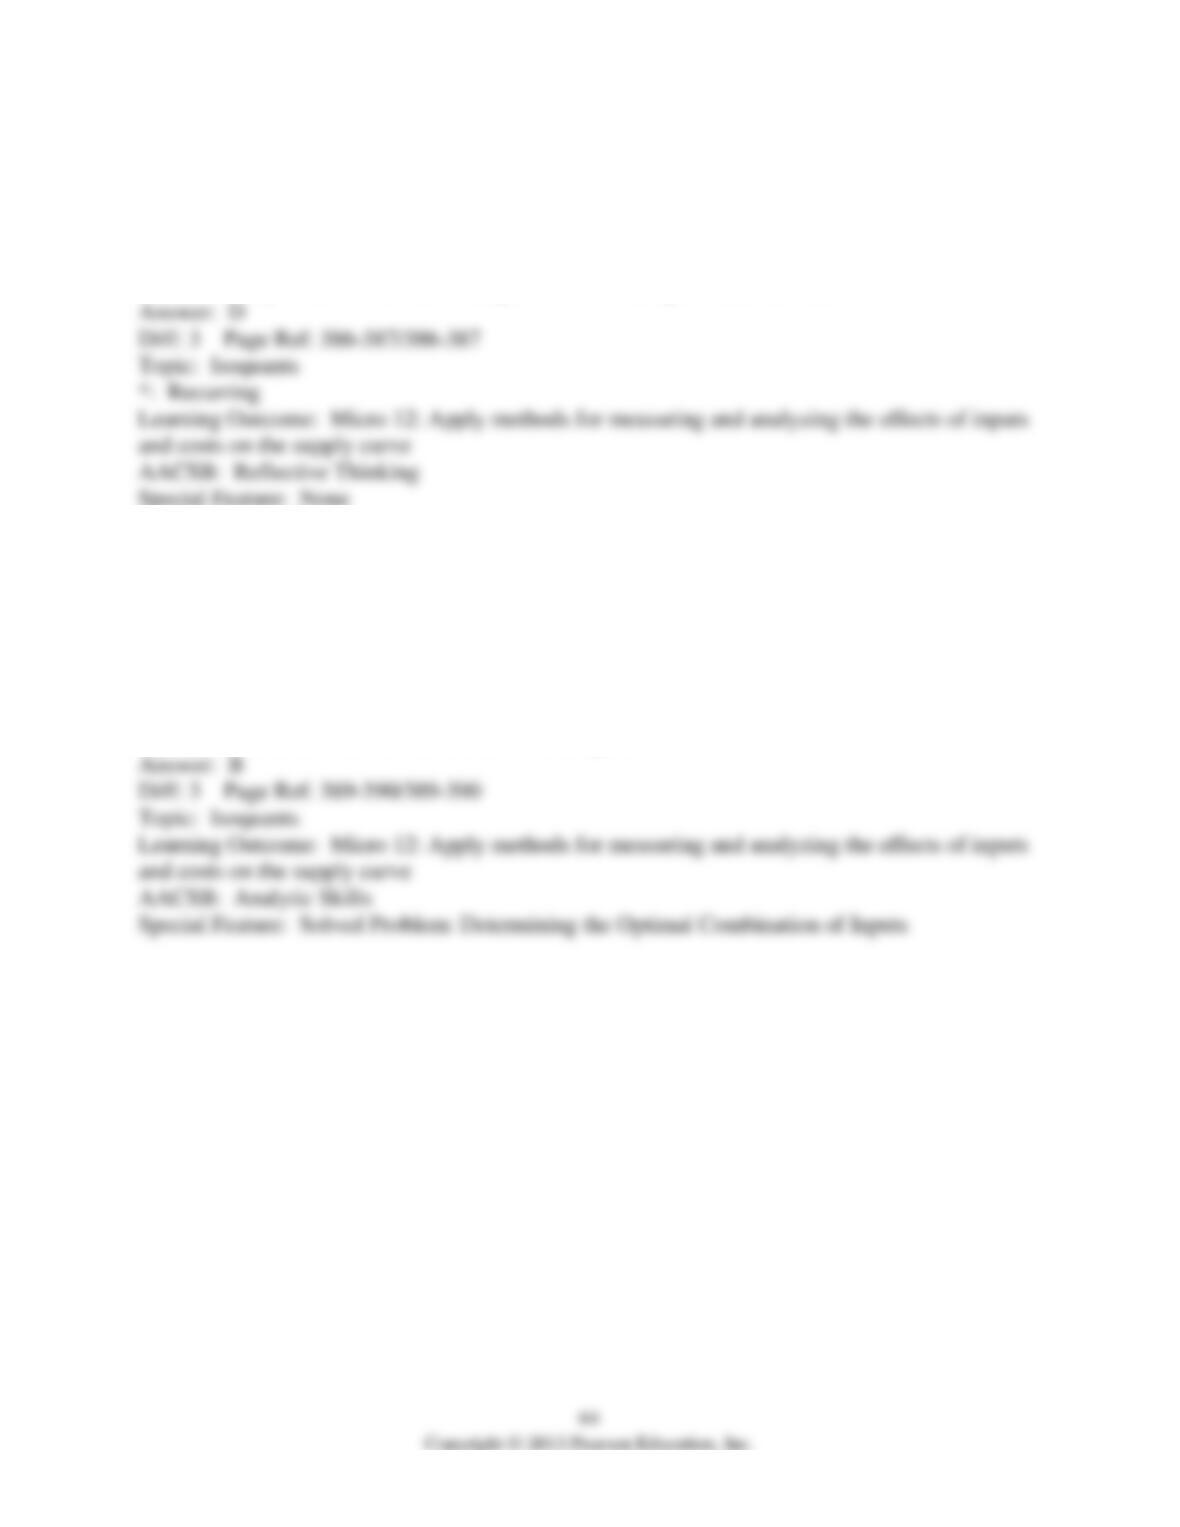
Figure 11-9
18) Refer to Figure 11-9. Starting from point d a movement along isoquant1 to point f
A) increases the total cost of production with no change in output.
B) increases output but not the total cost of production.
C) increases the total cost of production and decreases output.
D) increases both the total cost of production and output.
19) Refer to Figure 11-9. Starting from point e, a movement along the isocost to point f
A) decreases the total cost of production but not output.
B) increases the total cost of production and decreases output.
C) decreases both the total cost of production and output.
D) decreases output but not the total cost of production.
20) Refer to Figure 11-9. A curve that connects points a, d and e is called
A) an input-output curve.
B) a total cost line.
C) an expansion path.
D) an indifference line.
21) The financial success of the movies The Lion King and Toy Story led to
A) a decrease in the salaries of animators and an increase in the number of animators used to
produce films.
B) an increase in demand for actors to play roles in animated films.
C) the Disney studio’s attempt to buy Pixar Animation Studios.
D) a reduction in the price of computers and software relative to the price of labor (animators)
used to produce animated films.
22) Joan Jillson owns a coffee shop. Assume that the marginal product of the labor Joan employs
(MPL) equals 500 cups per week and the marginal product of her shop’s capital (MPK) equals
1,000. Assume also that the wage (w) Joan pays her workers equals $250 per week and the rental
price (r) of her capital – her coffee machines – equals $500 per week. Which of the following
correctly analyzes whether Joan is minimizing her costs?
A) No, Joan is not minimizing her costs because MPK is greater than MPL and r is greater than
w.
B) Yes, Joan is minimizing her costs because MPK/r equals MPL/w.
C) No, Joan is not minimizing her costs because MPL × w is less than MPK × r.
D) Yes, Joan is minimizing her costs because the she is a price-taker in the markets for labor and
capital.
23) Economists Cade Massey and Richard Thaler analyzed whether teams in the National
Football League distributed salaries efficiently. Massey and Thaler found that
A) the first few players selected in first round of the NFL draft are paid much higher salaries
relative to their marginal products than players drafted later in the first round.
B) rookies are paid salaries greater than their marginal products; veteran players are paid salaries
less than their marginal products.
C) veteran players who sign as free agents are paid more relative to their marginal products than
rookie players selected in the first round of the draft.
D) both rookie players and veteran players are paid less than the value of their marginal products
because of the lack of competition among teams.
24) The slope of an isoquant is equal to the ratio of the price of the input on the horizontal axis
divided by the price of the input on the vertical axis, multiplied by -1.
25) Firms in different countries that face different input prices may produce the same good using
different combinations of inputs, even though they have access to the same technology.
26) What is an isocost line? What is the slope of an isocost line?
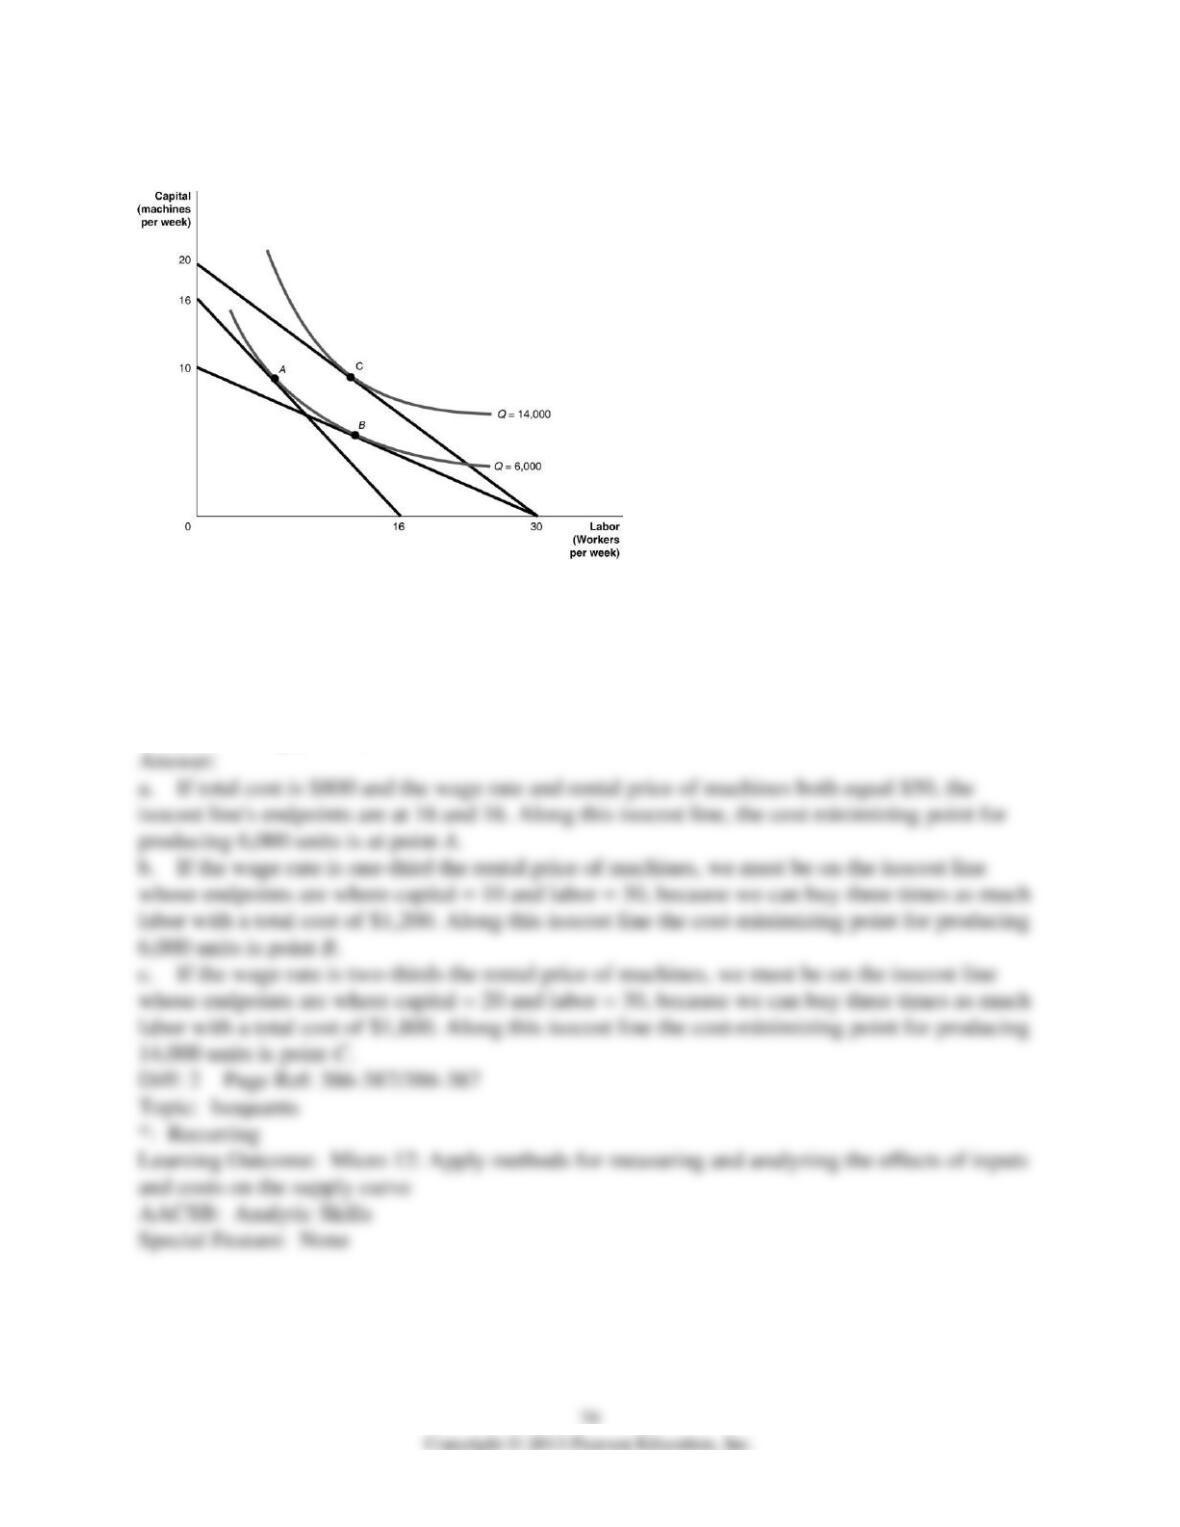
27) Use the following graph to answer the following questions.
a. If the wage rate and the rental price of machines are both $50 and total cost is $800, is the
cost-minimizing point A, B, or C?
b. If the wage rate is $40, the rental price of equipment is $120, and total cost is $1,200, is the
cost-minimizing point A, B, or C?
c. If the wage rate is $60, the rental price of equipment is $90, and total cost is $1,800, is the
cost-minimizing point A, B, or C?