90)
(2, –3), undefined slope
90)
A)
B)
C)
D)
Find the intercepts for the graph of the equation.
91)
–3x + 4y =0
91)
A)
(–1, 0); (–3, 0)
B)
(0, –1); (0, –3)
C)
(0, –3); (–1, 0)
D)
(0, 0); (0, 0)
D)
Decide whether or not the ordered pair is a solution to the equation.
92)
y =3x; (–2, –6)
92)
A)
Yes
B)
No
Write an equation in slope–intercept form of the line satisfying the given conditions.
93)
Through (–5, 9), perpendicular to 2x + 5y =10
93)
A)
y = – 5
2x –43
2
B)
y = – 5
2x + 5
C)
y =2
5x +43
5
D)
y =5
2x +43
2
D)
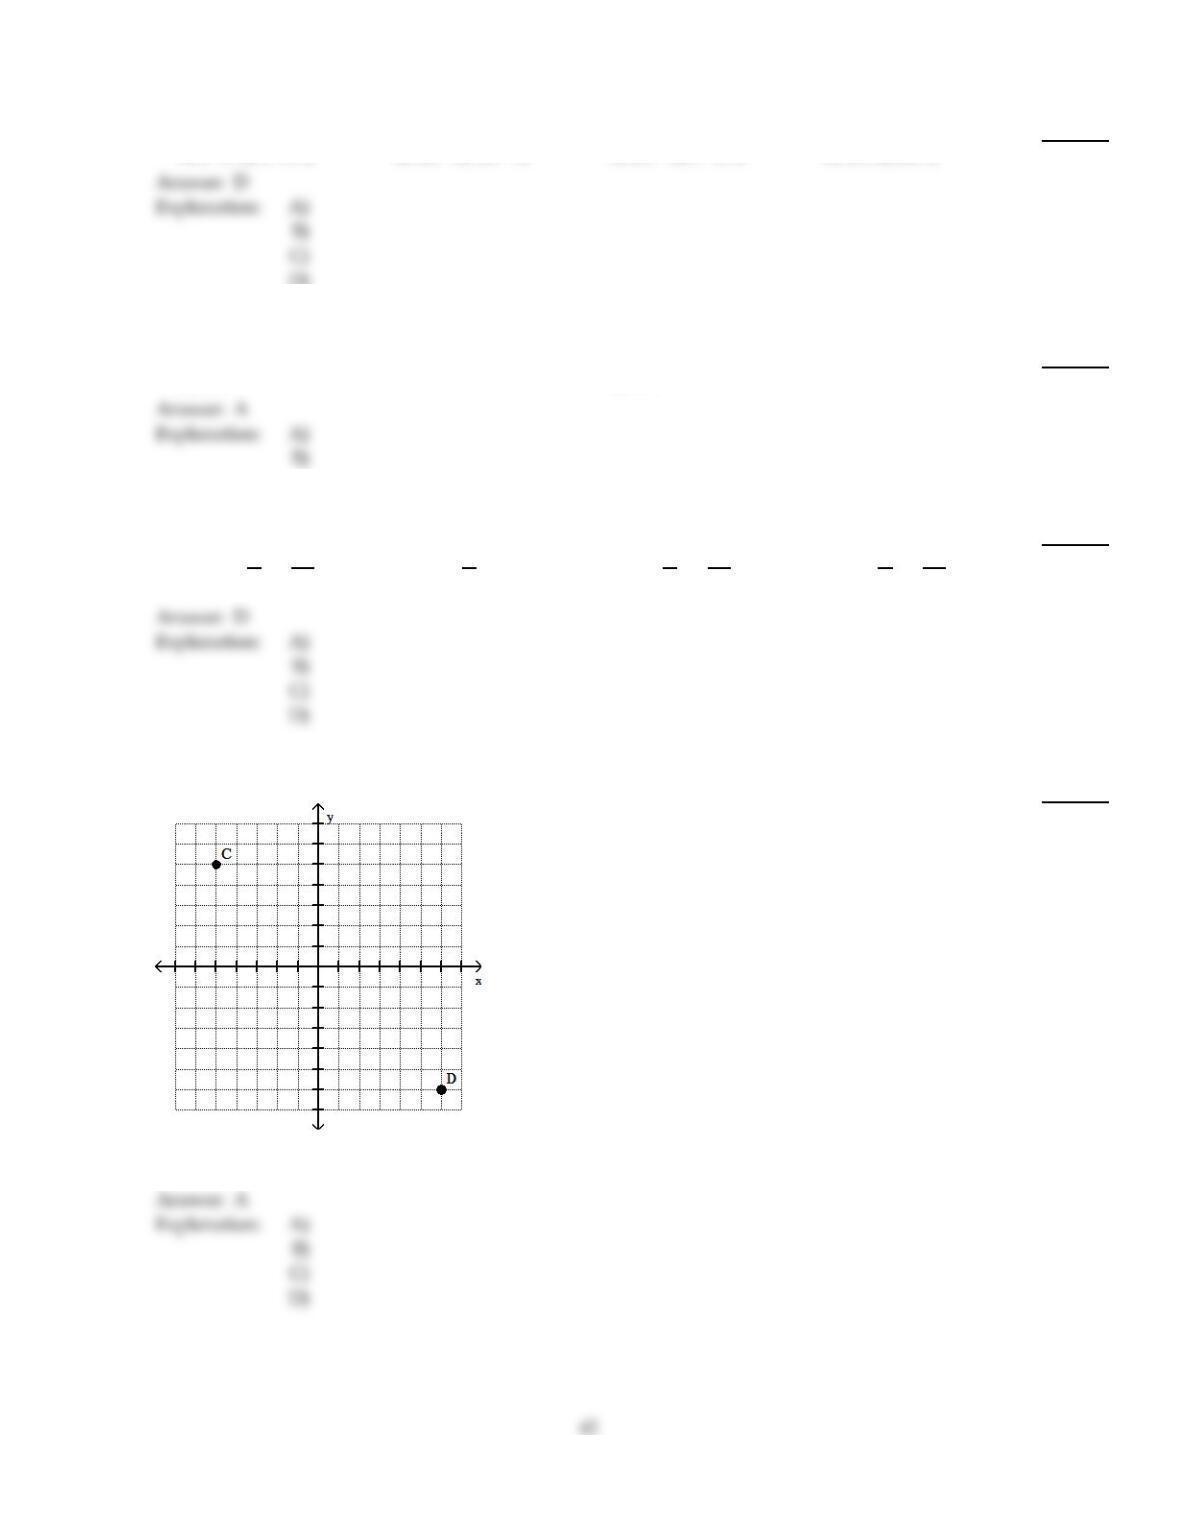
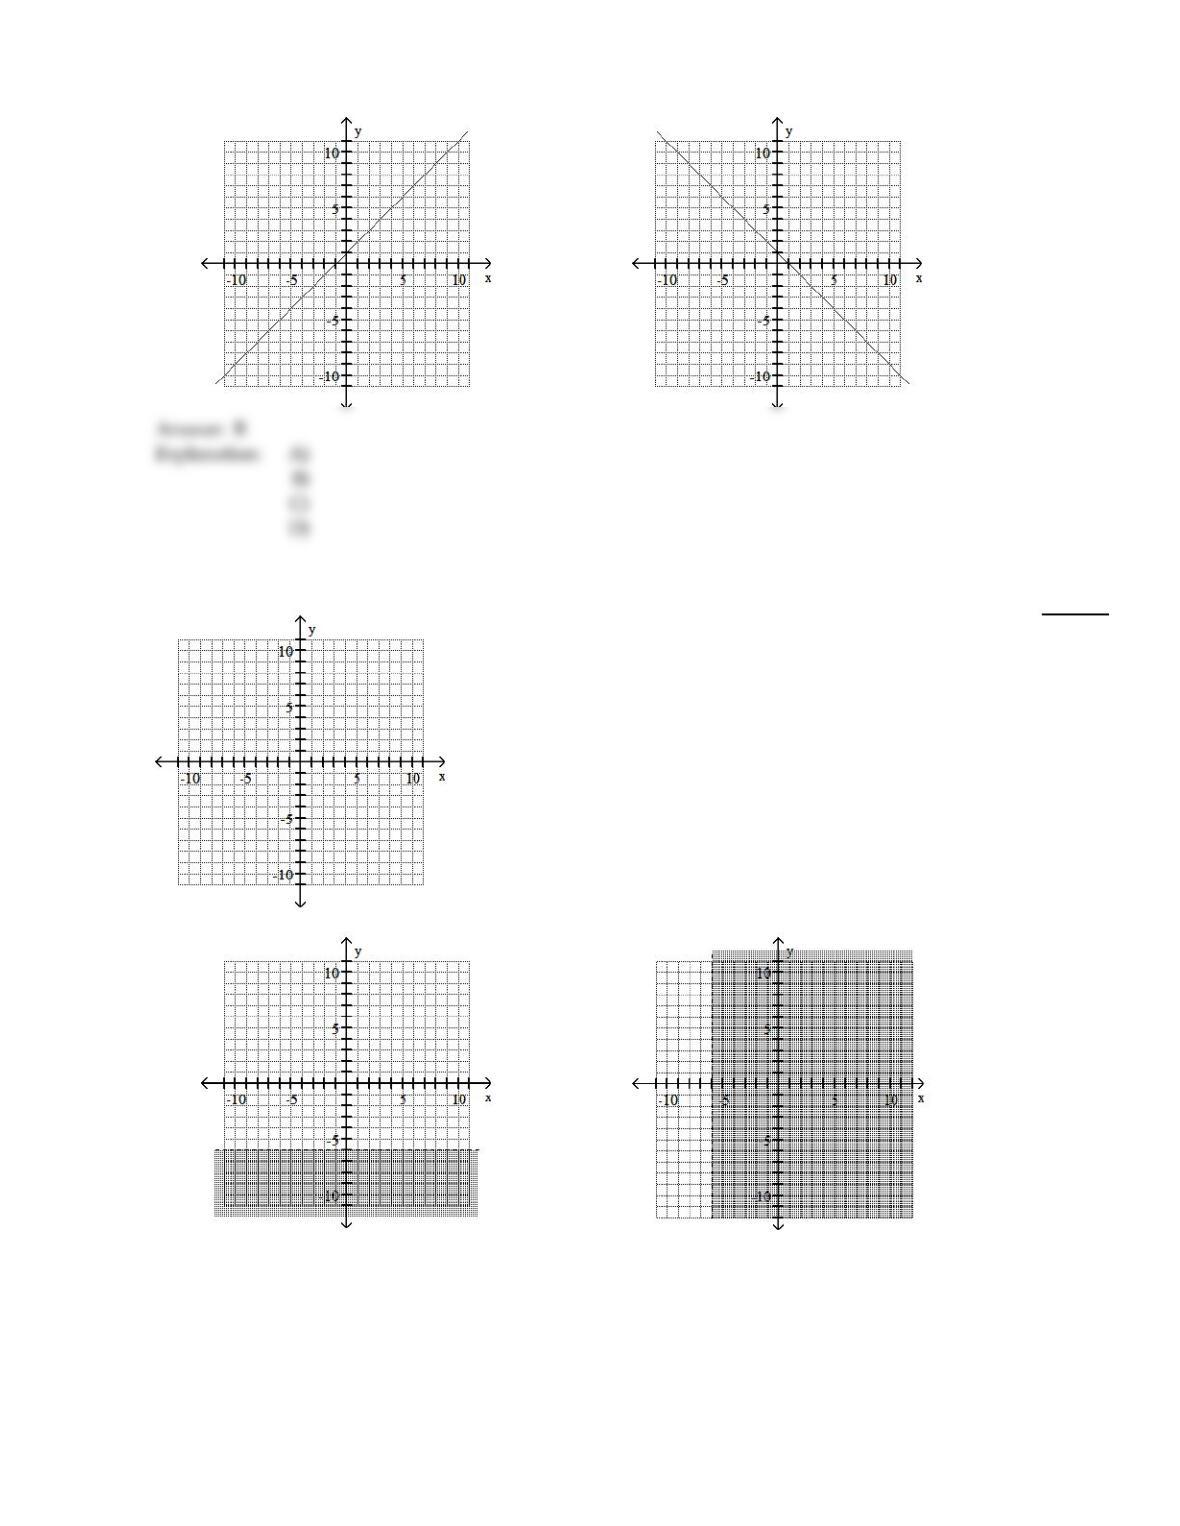
Give the ordered pairs for the points labeled on the graph.
94)
94)
A)
C(–5, 5); D(6, –6)
B)
C(–5, –6); D(5, –6)
C)
C(–5, 5); D(–6, 6)
D)
C(5, 6); D(–6, 6)
D)
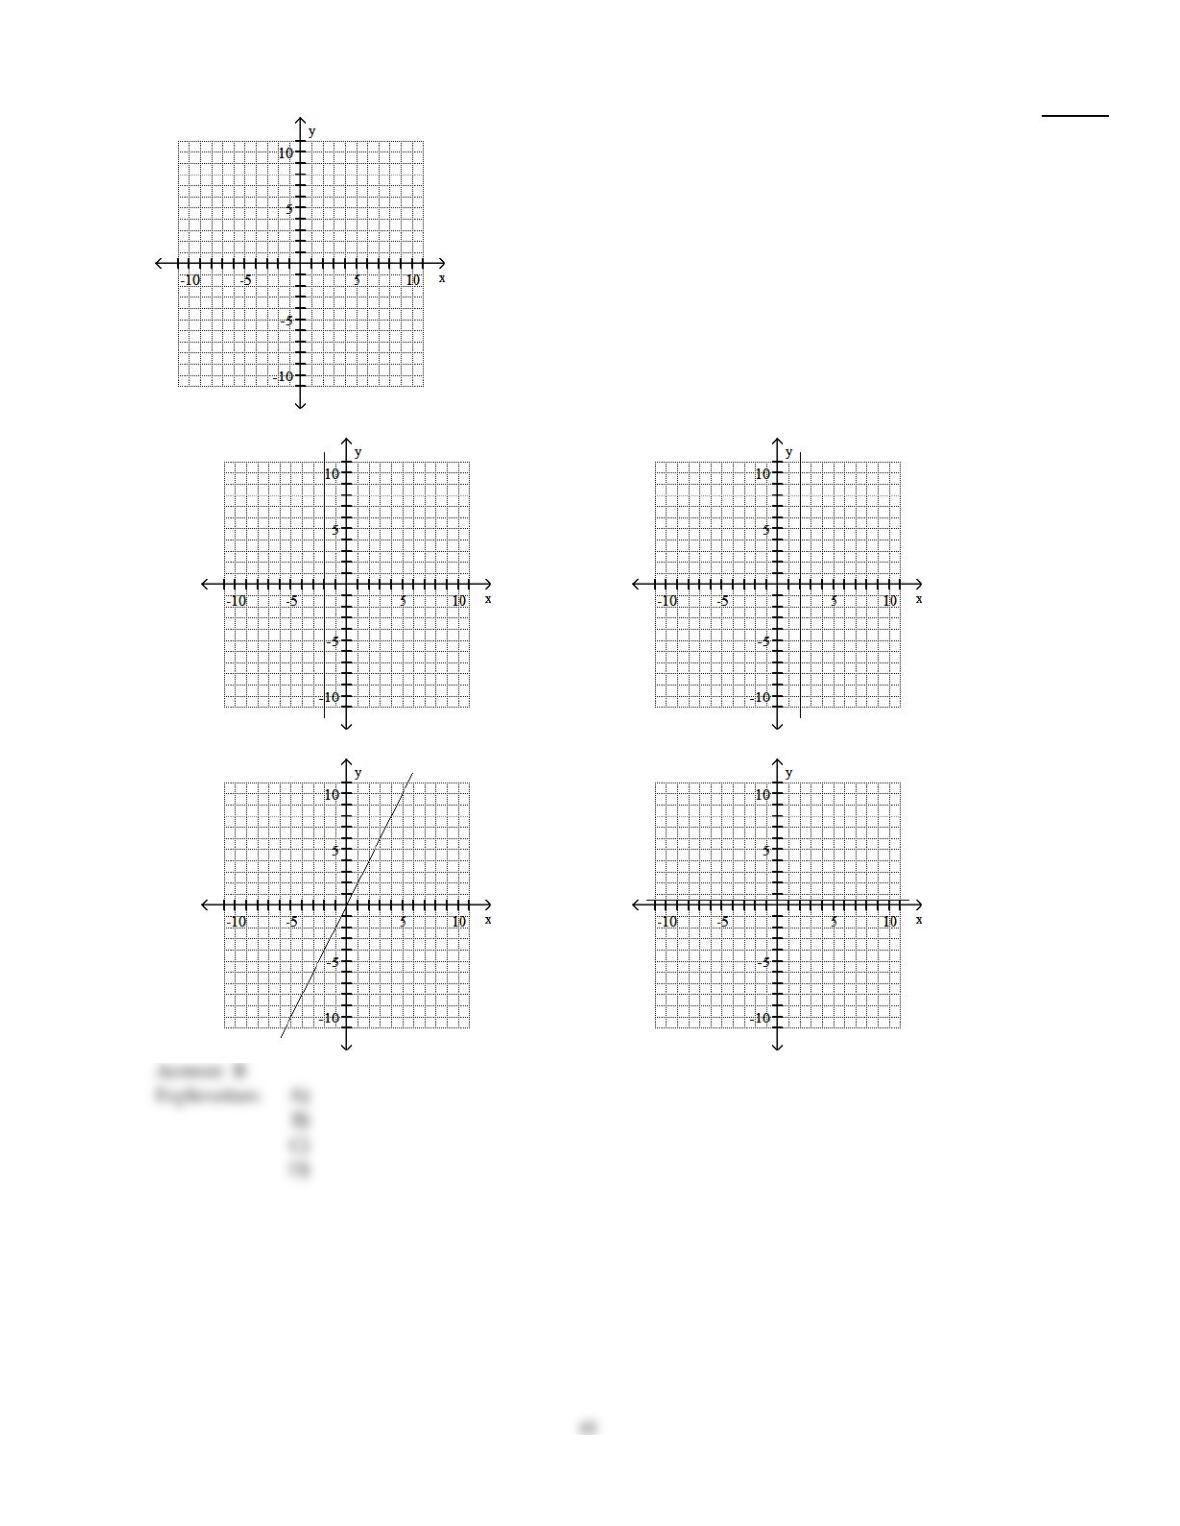
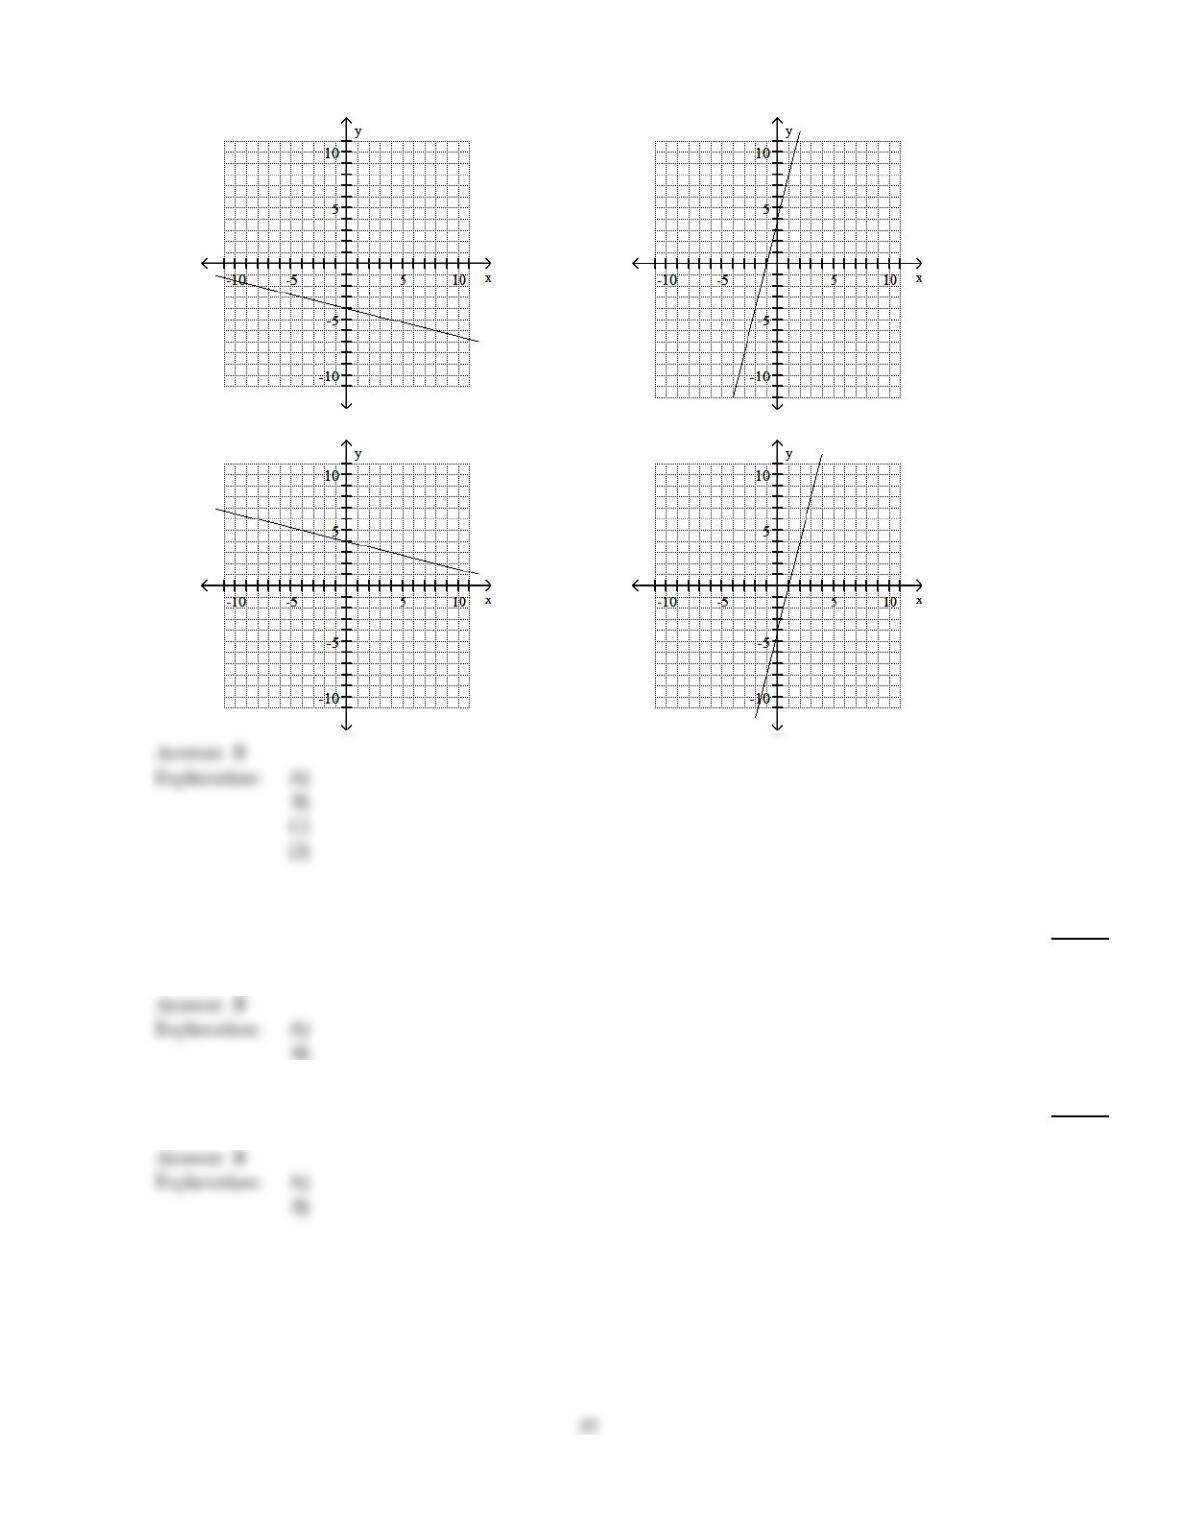
Use the geometric interpretation of slope (rise divided by run) to find the slope of the line. Then, by identifying the
y–intercept from the graph, write the slope–intercept form of the equation of the line.
95)
95)
A)
y = – x –4
B)
y = – x +4
C)
y = x +4
D)
y = x –4
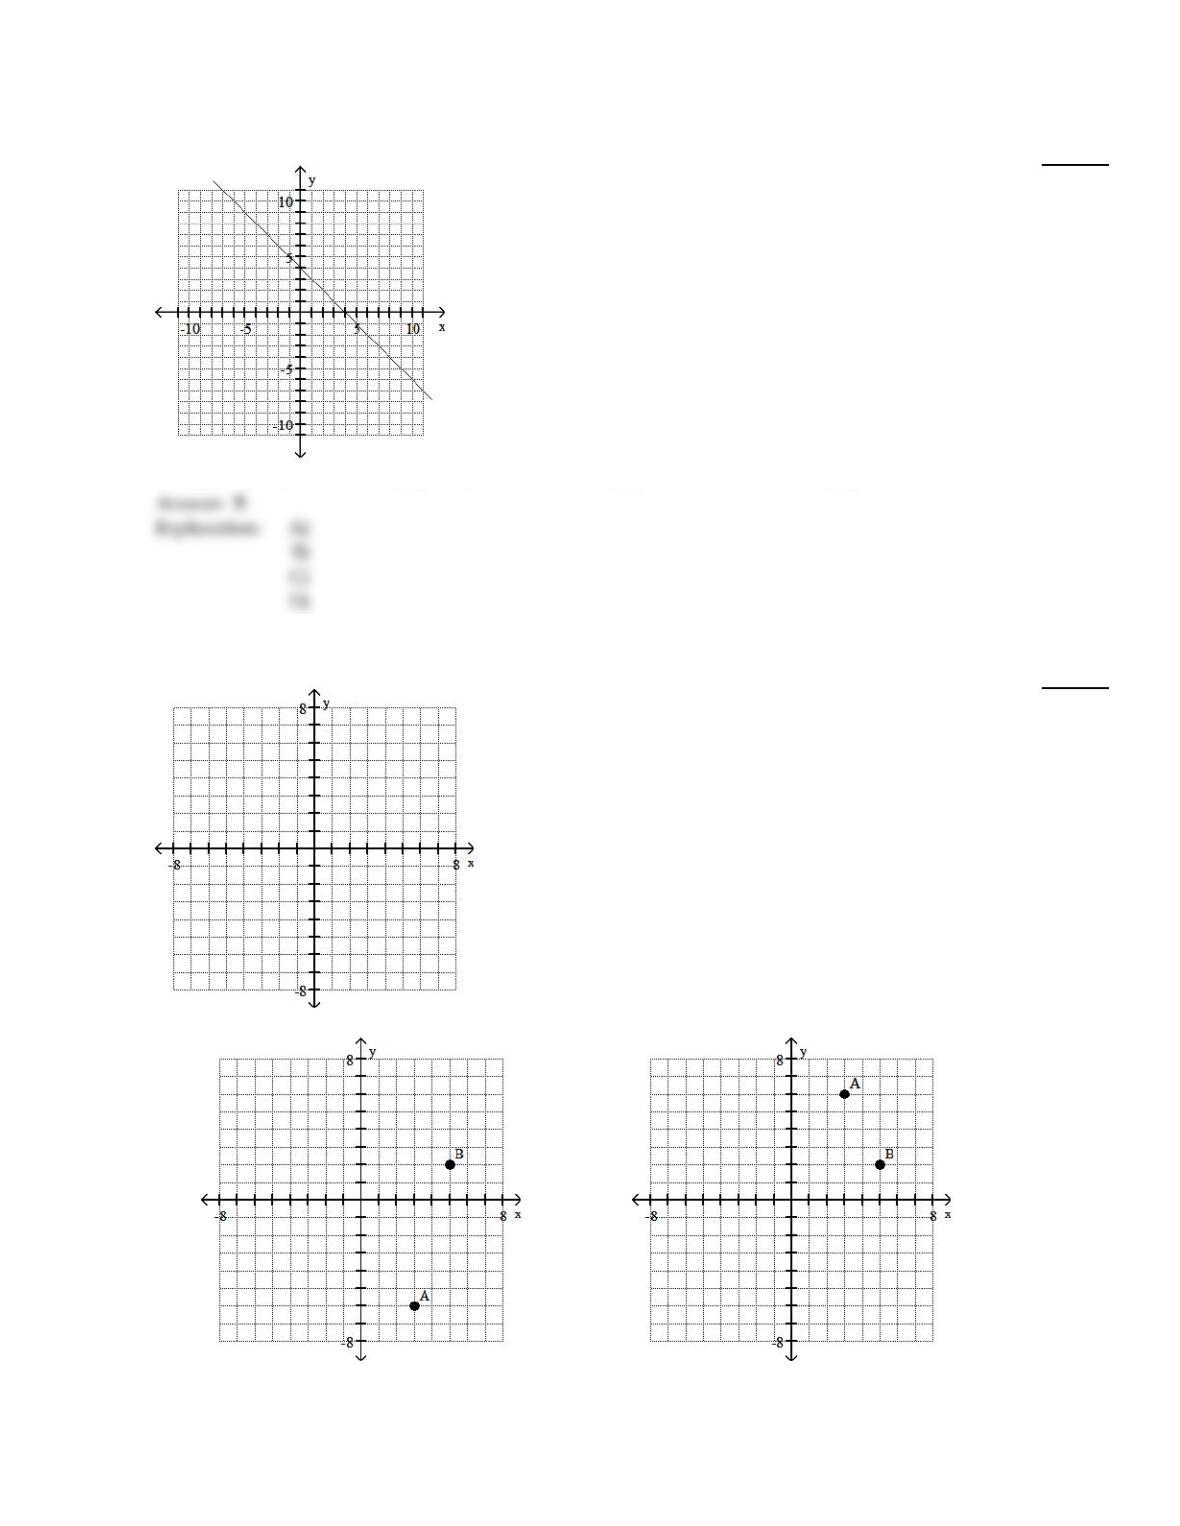
Plot the ordered pairs on the rectangular coordinate system provided.
96)
A(3, –6), B(–5, 2)
96)
A)
B)
43
C)
D)
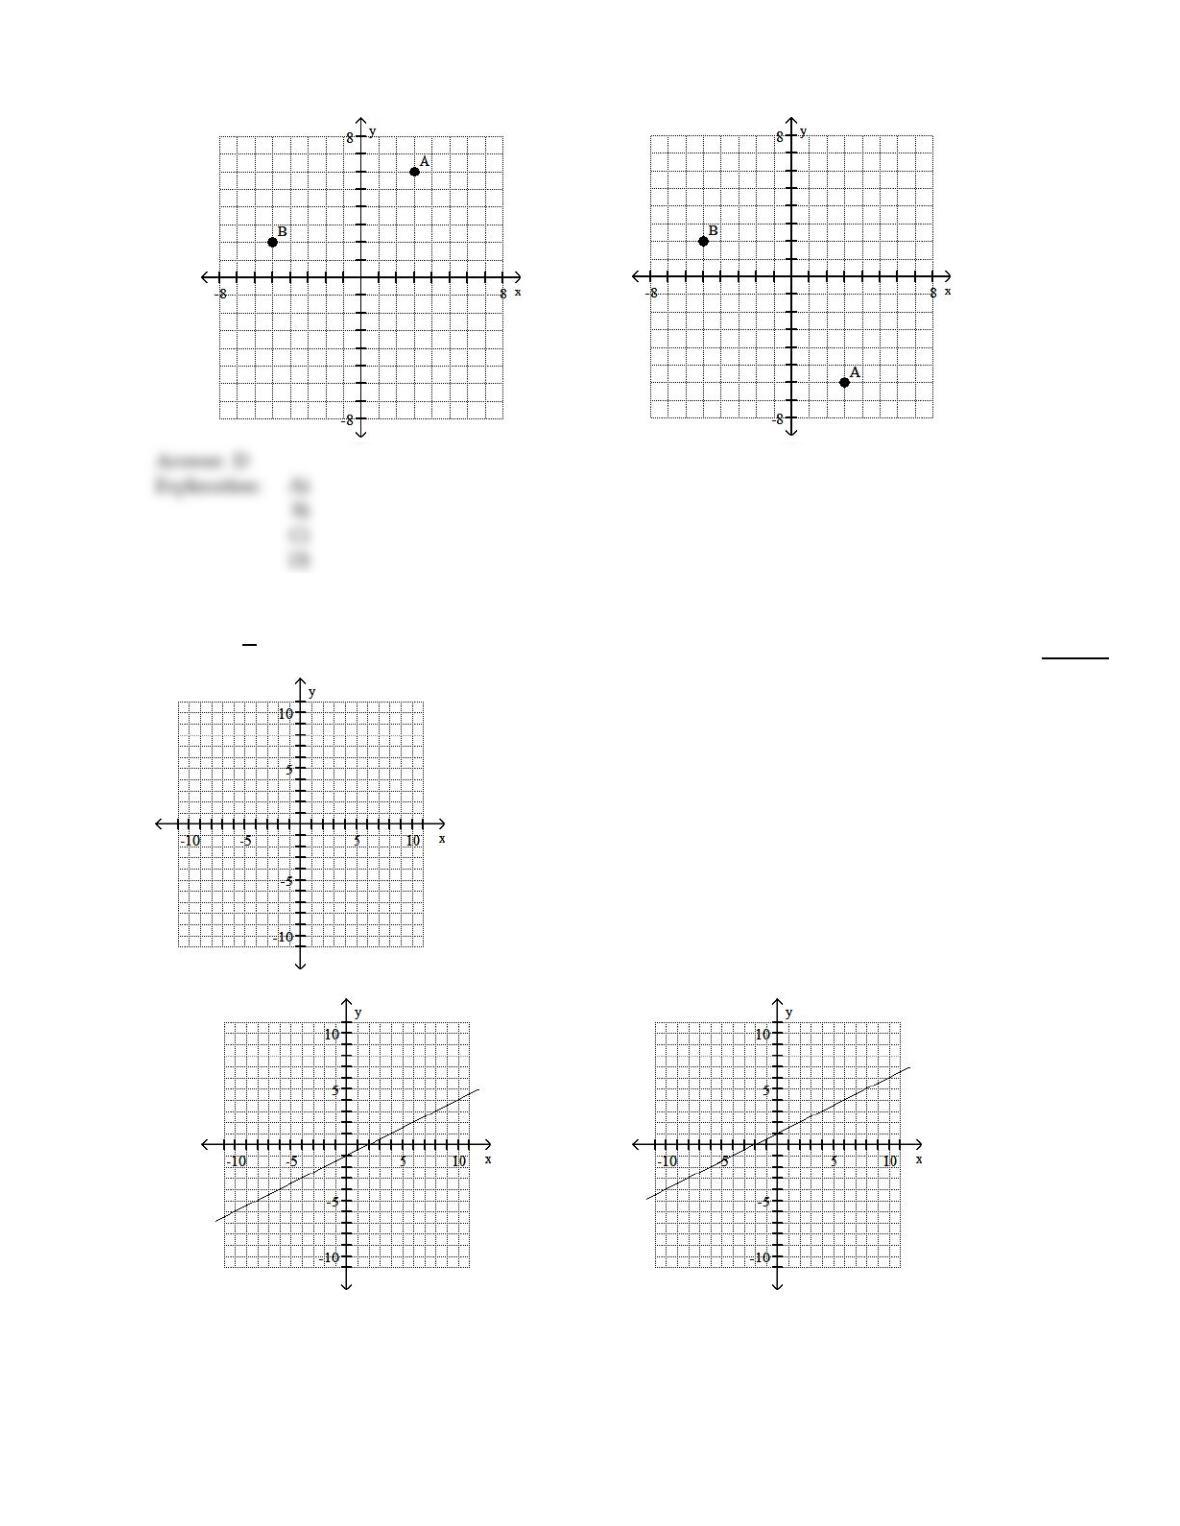
Graph the line through the given point with the given slope.
97)
(2, 2), m =1
2
97)
A)
B)
44
C)
D)
Graph the linear inequality.
98)
y > – 6
98)
A)
B)
45
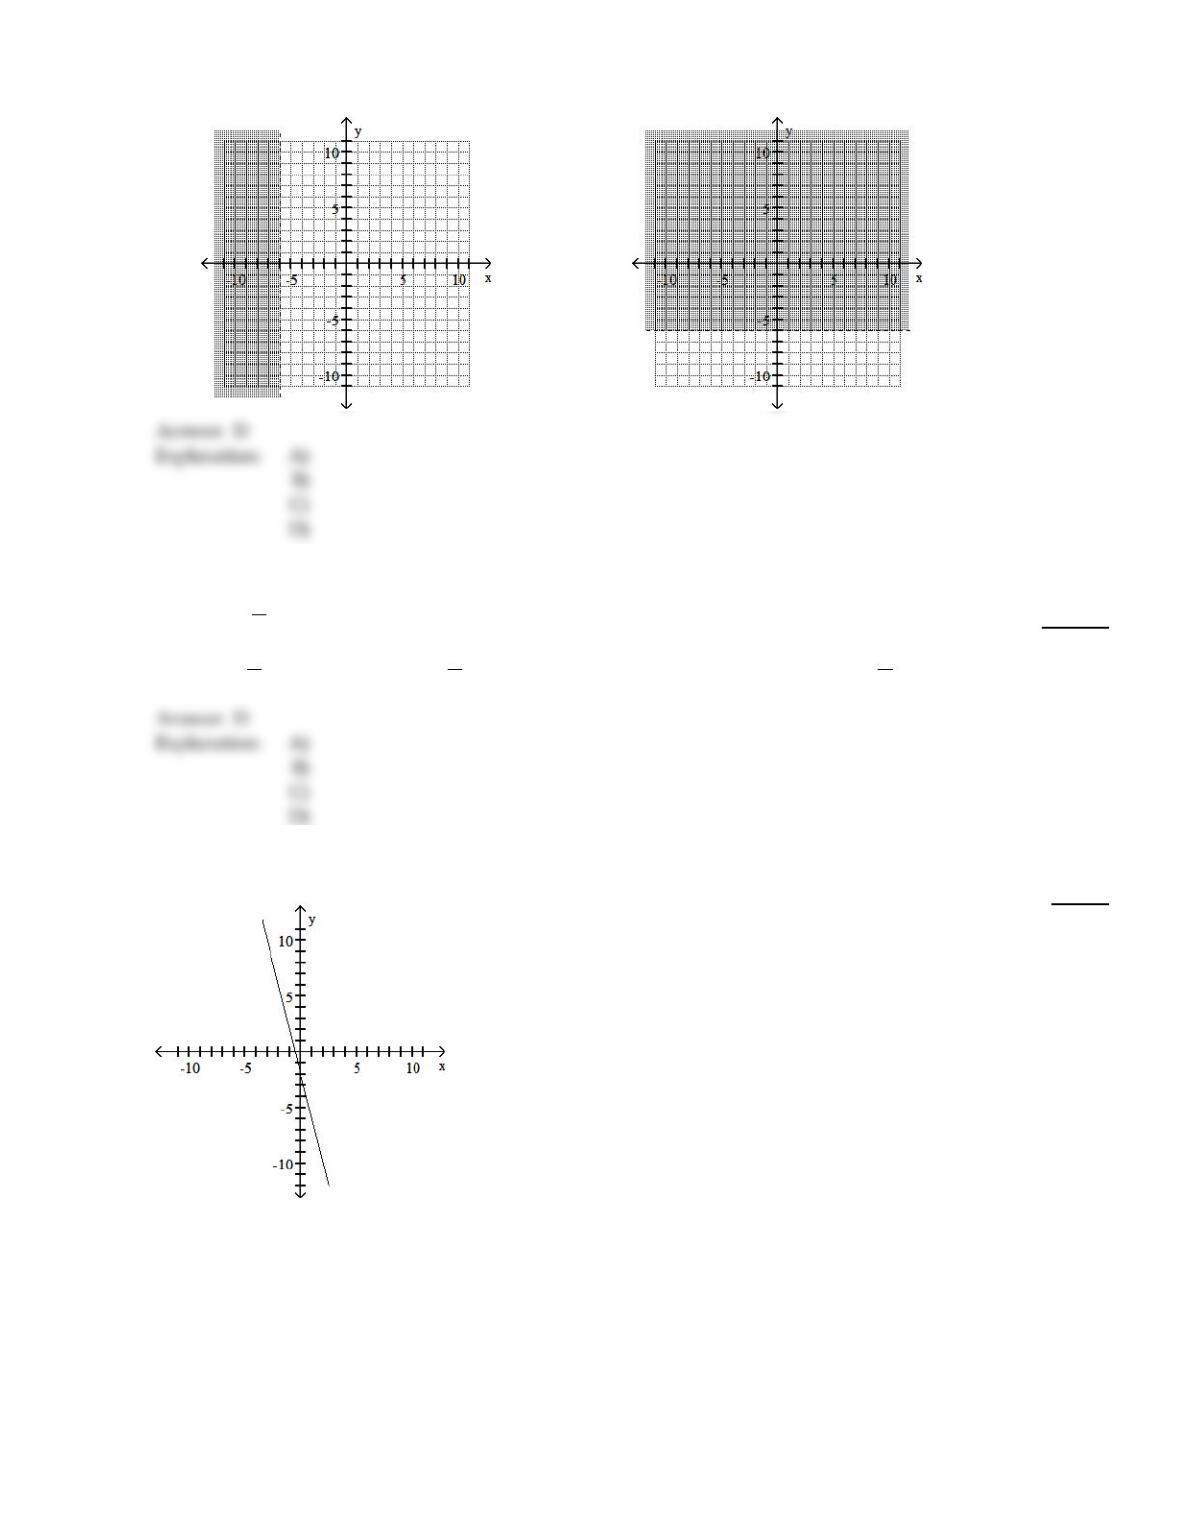
C)
D)
Write an equation of the line through the given point with the given slope. Write the equation in slope–intercept form.
99)
(–6, 0), m =1
2
99)
A)
y = – 1
2x + 3
B)
y =1
2x – 3
C)
y = 2x + 3
D)
y =1
2x + 3
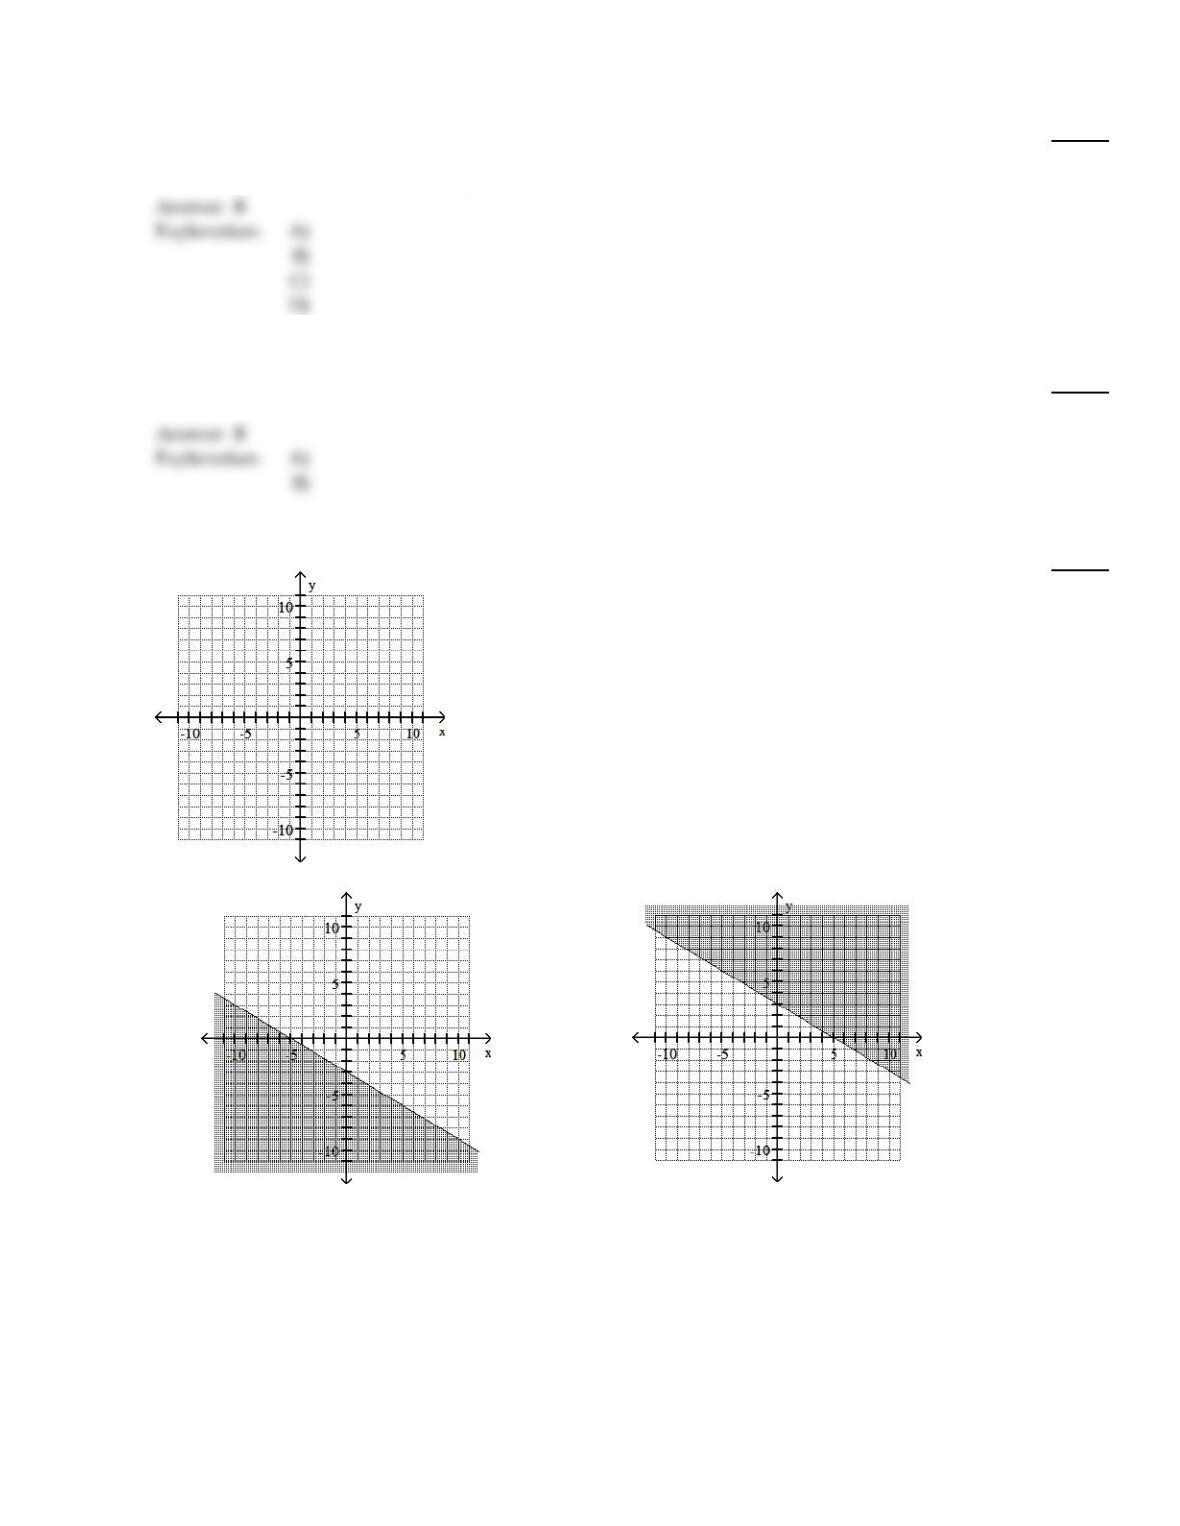
Complete the graph by shading the correct region.
100)
4x + y –2
100)
46
A)
B)
C)
D)
Complete the table of values. Write the results as ordered pairs.
101)
2x –3y = – 6
x y
2
0
4
101)
A)
(6, 2); (–3, 0); (3, 4)
B)
(6, 2); (3, 0); (–3, 4)
C)
(0, 2); (–3, 0); (3, 4)
D)
(0, 2); (3, 0); (–3, 4)
C
D
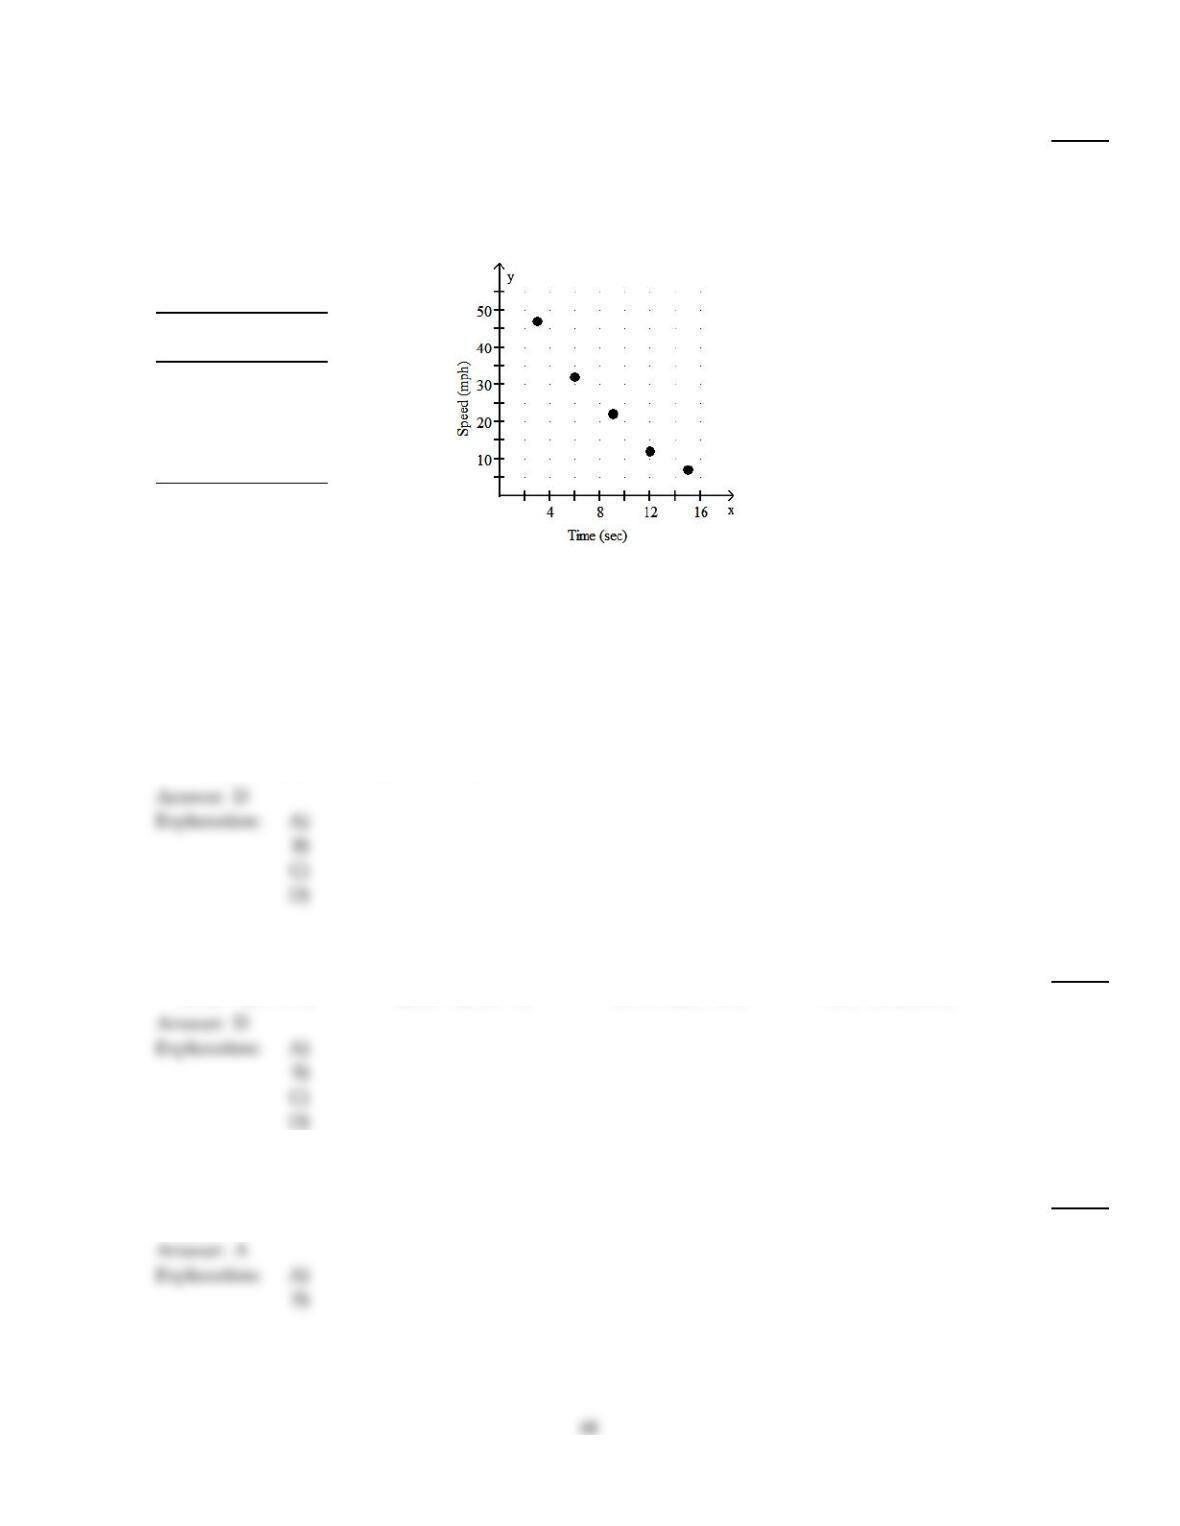
Solve the problem.
102)
Suppose that the speed of a car, measured in miles per hour (mph), is monitored for some short
period of time after the driver applies the brakes. The following table and graph relate the speed of
the car to the amount of time, measured in seconds (sec), elapsed from the moment that the brakes
are applied. What is happening to the speed of the car during this time frame? In which of the time
intervals does the speed change the most?
TIME
(seconds)
SPEED
(mph)
347
632
922
12 12
15 7
102)
A)
With increasing elapsed time, the speed increases. The speed changes most during the time
interval from 12 seconds to 15 seconds.
B)
With increasing elapsed time, the speed increases. The speed changes most during the time
interval from 3 seconds to 6 seconds.
C)
With increasing elapsed time, the speed decreases. The speed changes most during the time
interval from 12 seconds to 15 seconds.
D)
With increasing elapsed time, the speed decreases. The speed changes most during the time
interval from 3 seconds to 6 seconds.
Find the intercepts for the graph of the equation.
103)
–2x + y =6
103)
A)
(6, –4); (–5, 6)
B)
(0, –5); (0, –4)
C)
(–5, 0); (–4, 0)
D)
(– 3, 0); (0, 6)
Answer the question.
104)
True or False: The graph of the equation y =7 goes through the origin.
104)
A)
False
B)
True
105)
True or False: The graph of the equation x =6 is a vertical line.
105)
A)
False
B)
True
Complete the ordered pair for the equation.
106)
y = – 4x + 27 (5, )
106)
A)
(5, 27)
B)
(5, 5)
C)
(5, 7)
D)
(5, –108)
C
Answer the question.
107)
True or False: The point at which a line crosses the x–axis, where y is zero, is called the x–intercept.
107)
A)
True
B)
False
A
Find the slope of the line.
108)
5y = – x +7
108)
A)
–1
5
B)
5
C)
–5
D)
1
5
A
Write an equation of the line through the given point with the given slope. Write the equation in slope–intercept form.
109)
(2, 3); m = – 3
4
109)
A)
y = – 4
3x –2
9
B)
y = – 3
4x –9
2
C)
y = – 3
4x +9
2
D)
y = – 3
4x +2
9
C
B
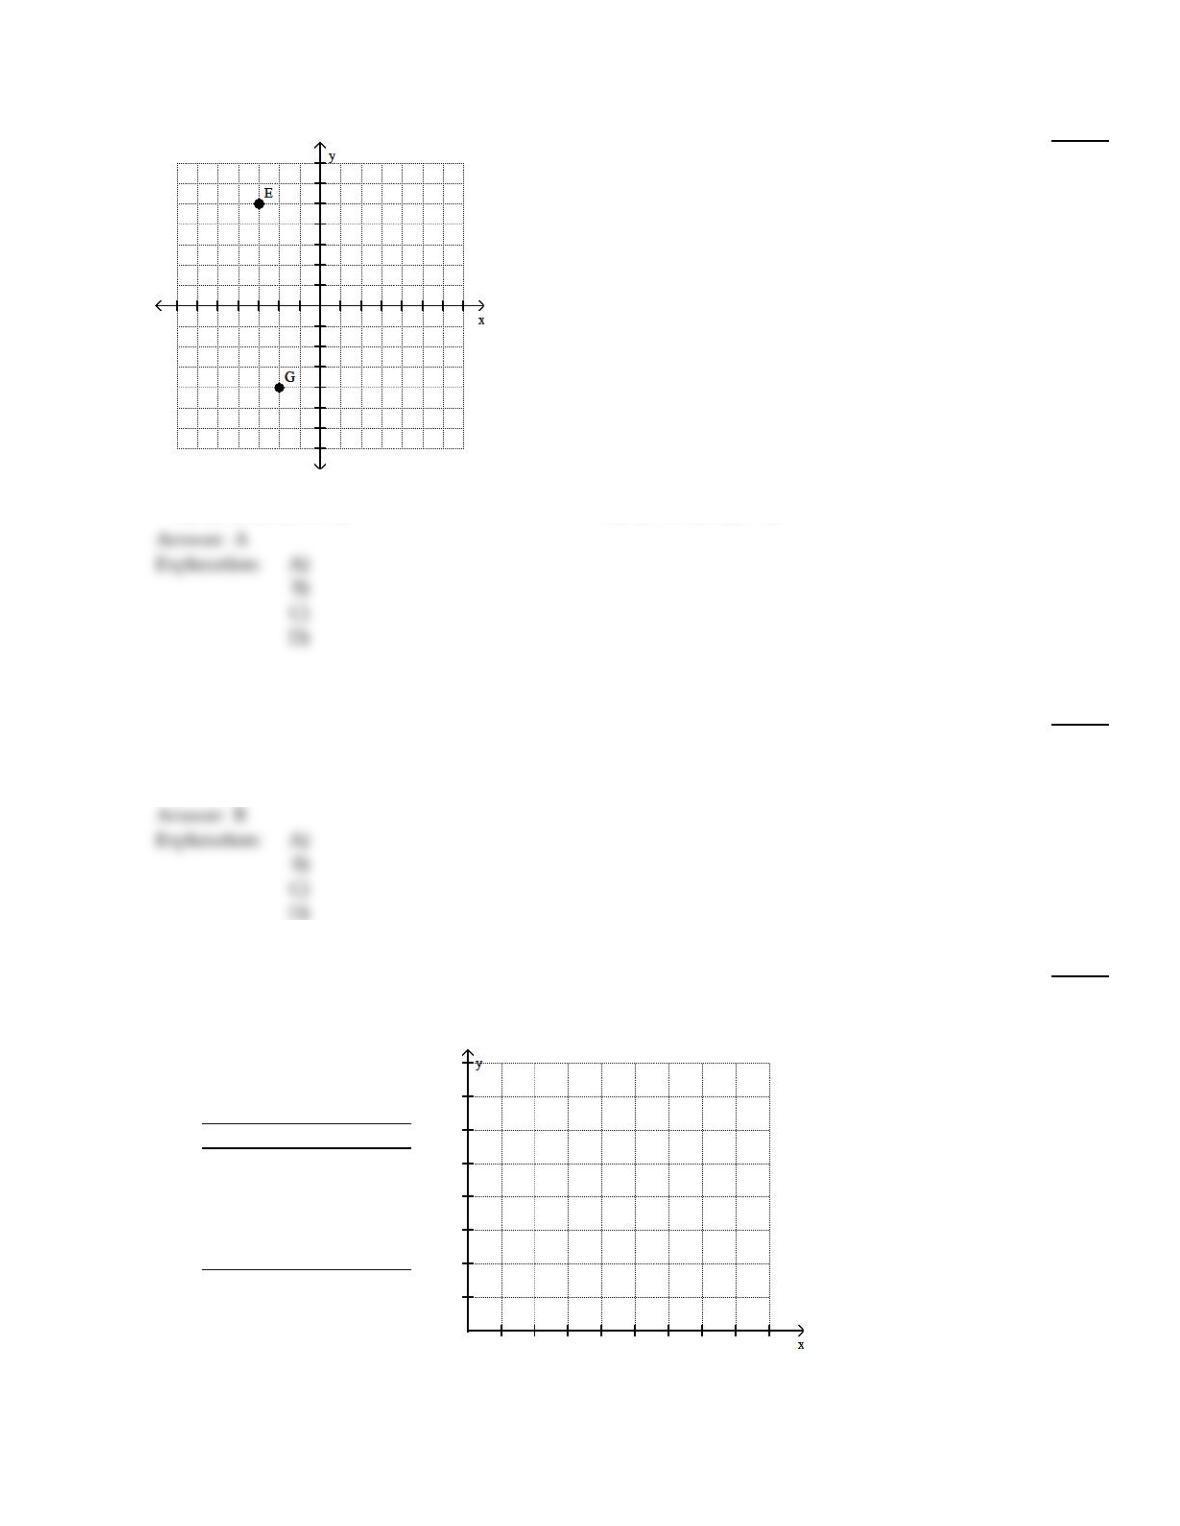
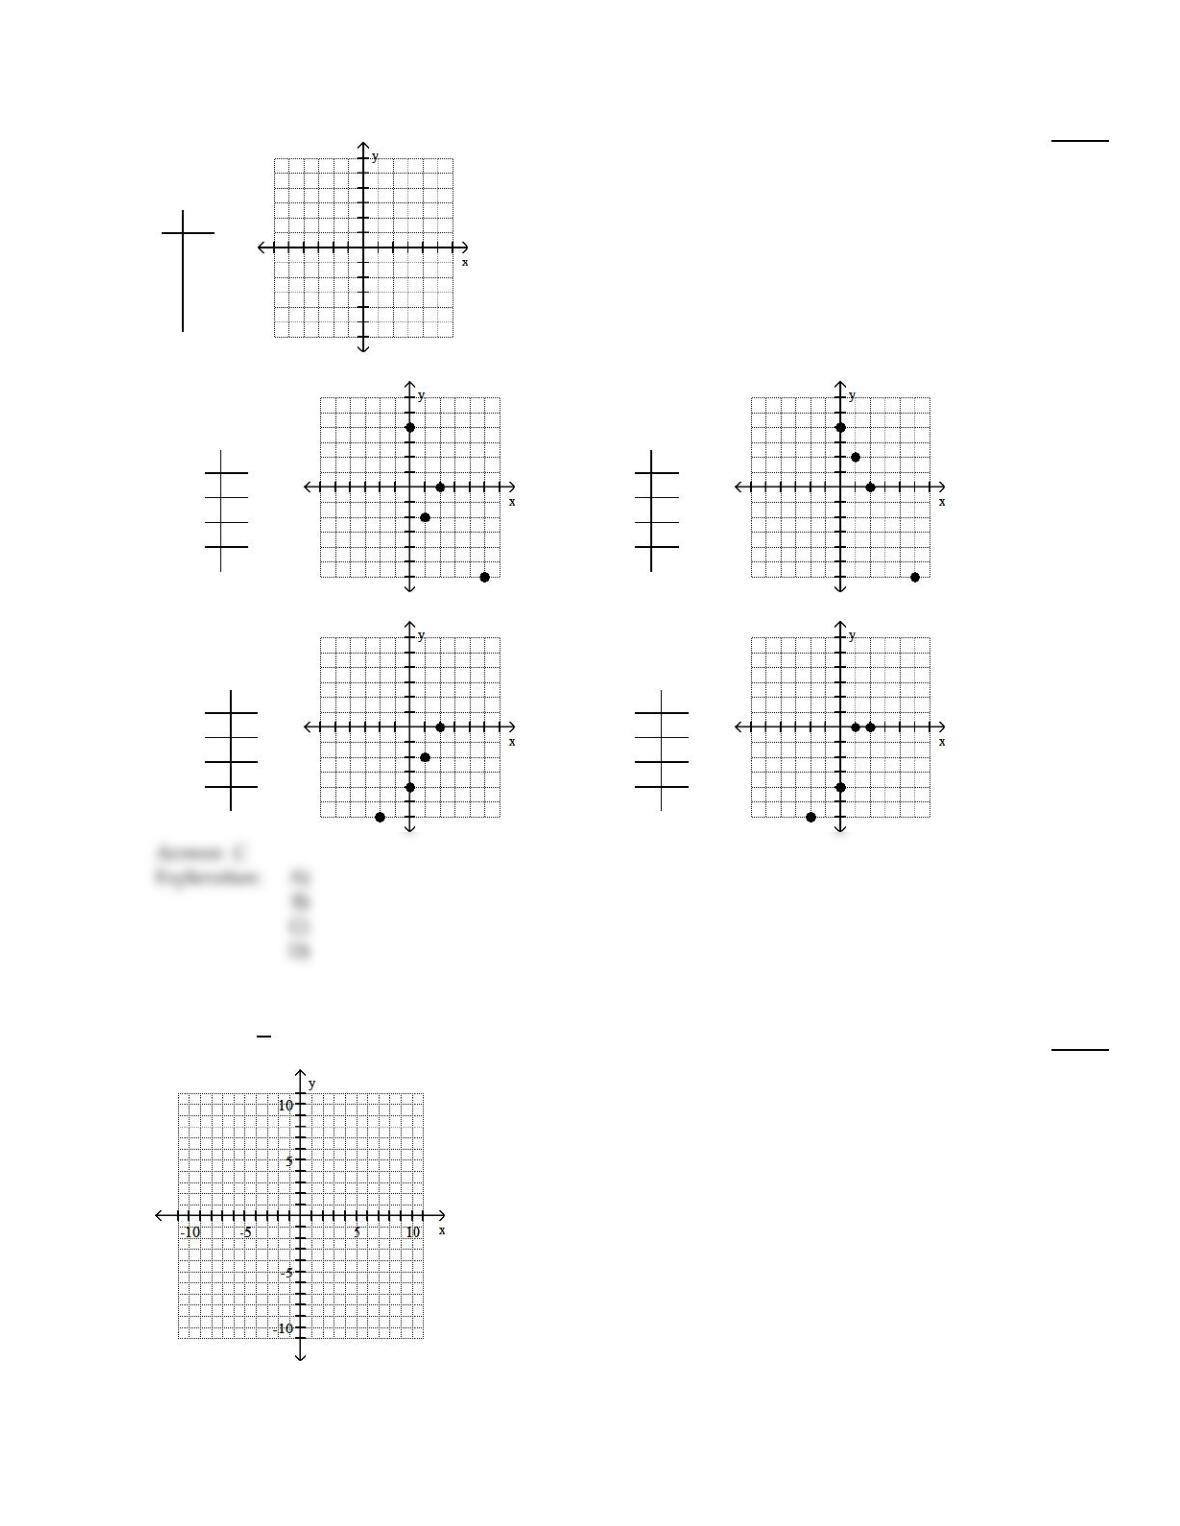
Give the ordered pairs for the points labeled on the graph.
110)
110)
A)
E(–3, 5); G(–2, –4)
B)
E(5, 10); G(–4, –2)
C)
E(–3, 5); G(–4, –2)
D)
E(–3, –4); G(5, –4)
Solve the problem.
111)
A cable TV company charges $26 for the basic service plus $6 for each movie channel. Let y be the
total cost in dollars of subscribing to cable TV, using x movie channels. Find the slope–intercept
form of the equation.
111)
A)
y =6x – 26
B)
y =6x + 26
C)
y =26x + 6
D)
y =26x – 6
112)
The table lists the average annual cost (in dollars) of tuition and fees at a certain 2–year college for
selected years, where year 1 represents 1992, year 3 represents 1994, and so on. Write the ordered
pairs representing these data and plot the points.
Year Cost (in dollars)
11072
31159
51223
71268
91310
112)
50
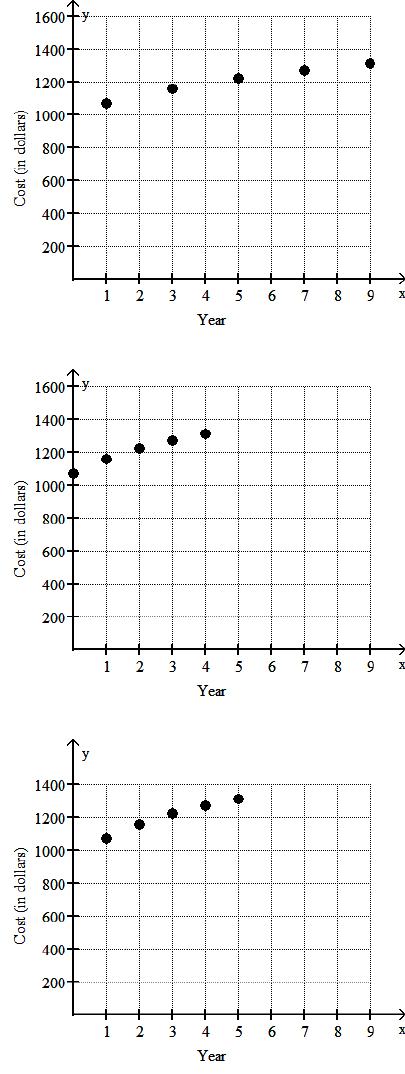
A)
(1072, 1), (1159, 3), (1223, 5), (1268, 7), (1310, 9)
B)
(0, 1072), (1, 1159), (2, 1223), (3, 1268), (4, 1310)
C)
(1, 1072), (2, 1159), (3, 1223), (4, 1268), (5, 1310)
51
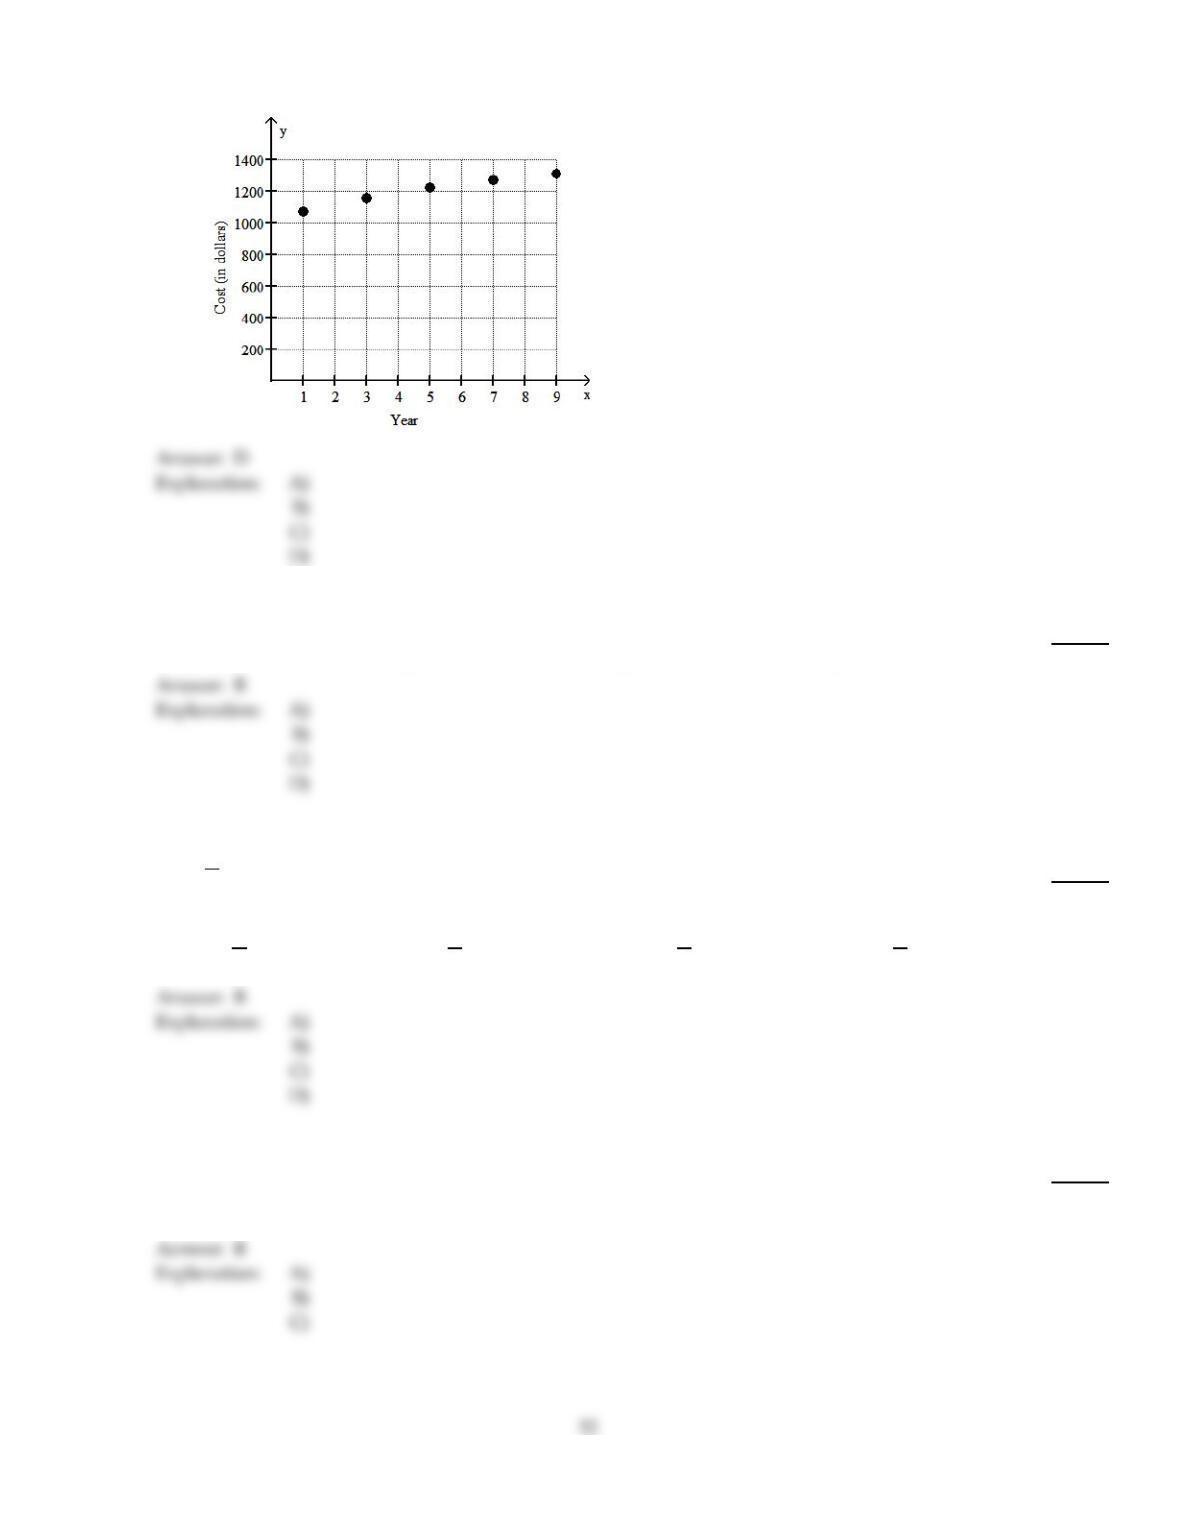
D)
(1, 1072), (3, 1159), (5, 1223), (7, 1268), (9, 1310)
Find the slope of the line.
113)
x = – 2
113)
A)
–2
B)
undefined
C)
2
D)
0
Write the equation of the line with the given slope and y–intercept.
114)
slope 1
2;
y–intercept (0, 1)
114)
A)
y =1
2x – 1
B)
y =1
2x + 1
C)
y = – 1
2x + 1
D)
y = – 1
2x – 1
Determine whether the two lines are parallel, perpendicular, or neither parallel nor perpendicular.
115)
3x – 4y = – 13
8x + 6y = 11
115)
A)
Parallel
B)
Perpendicular
C)
Neither
Write a linear inequality for the situation described.
116)
It takes 4 cups of sugar to bake a cake and 3 cups of sugar to make a tray of cookies. Mary has a
total of 19 cups of sugar to bake x cakes and y trays of cookies.
116)
A)
3x +4y 19
B)
4x +3y 19
C)
4x +3y
0
D)
3x +4y
1
Answer the question.
117)
True or False? The x–coordinate is positive in quadrants I and IV.
117)
A)
False
B)
True
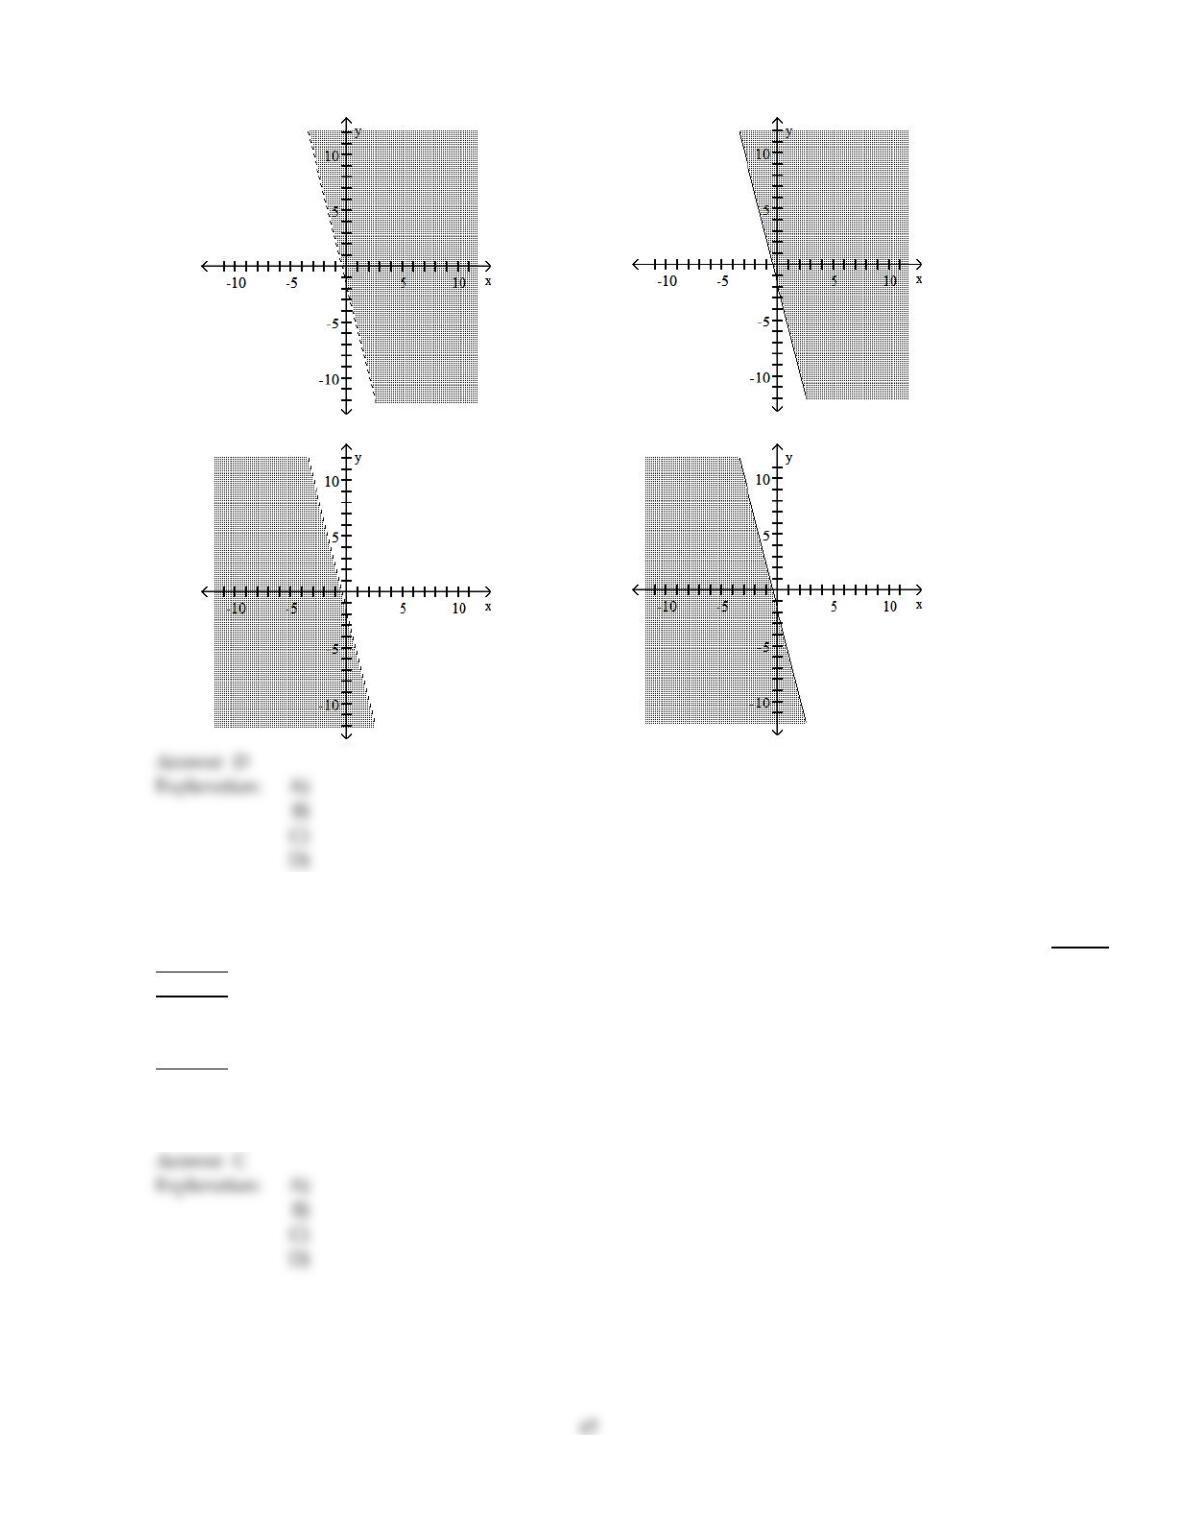
Graph the linear inequality.
118)
–5y 3x – 15
118)
A)
B)
53
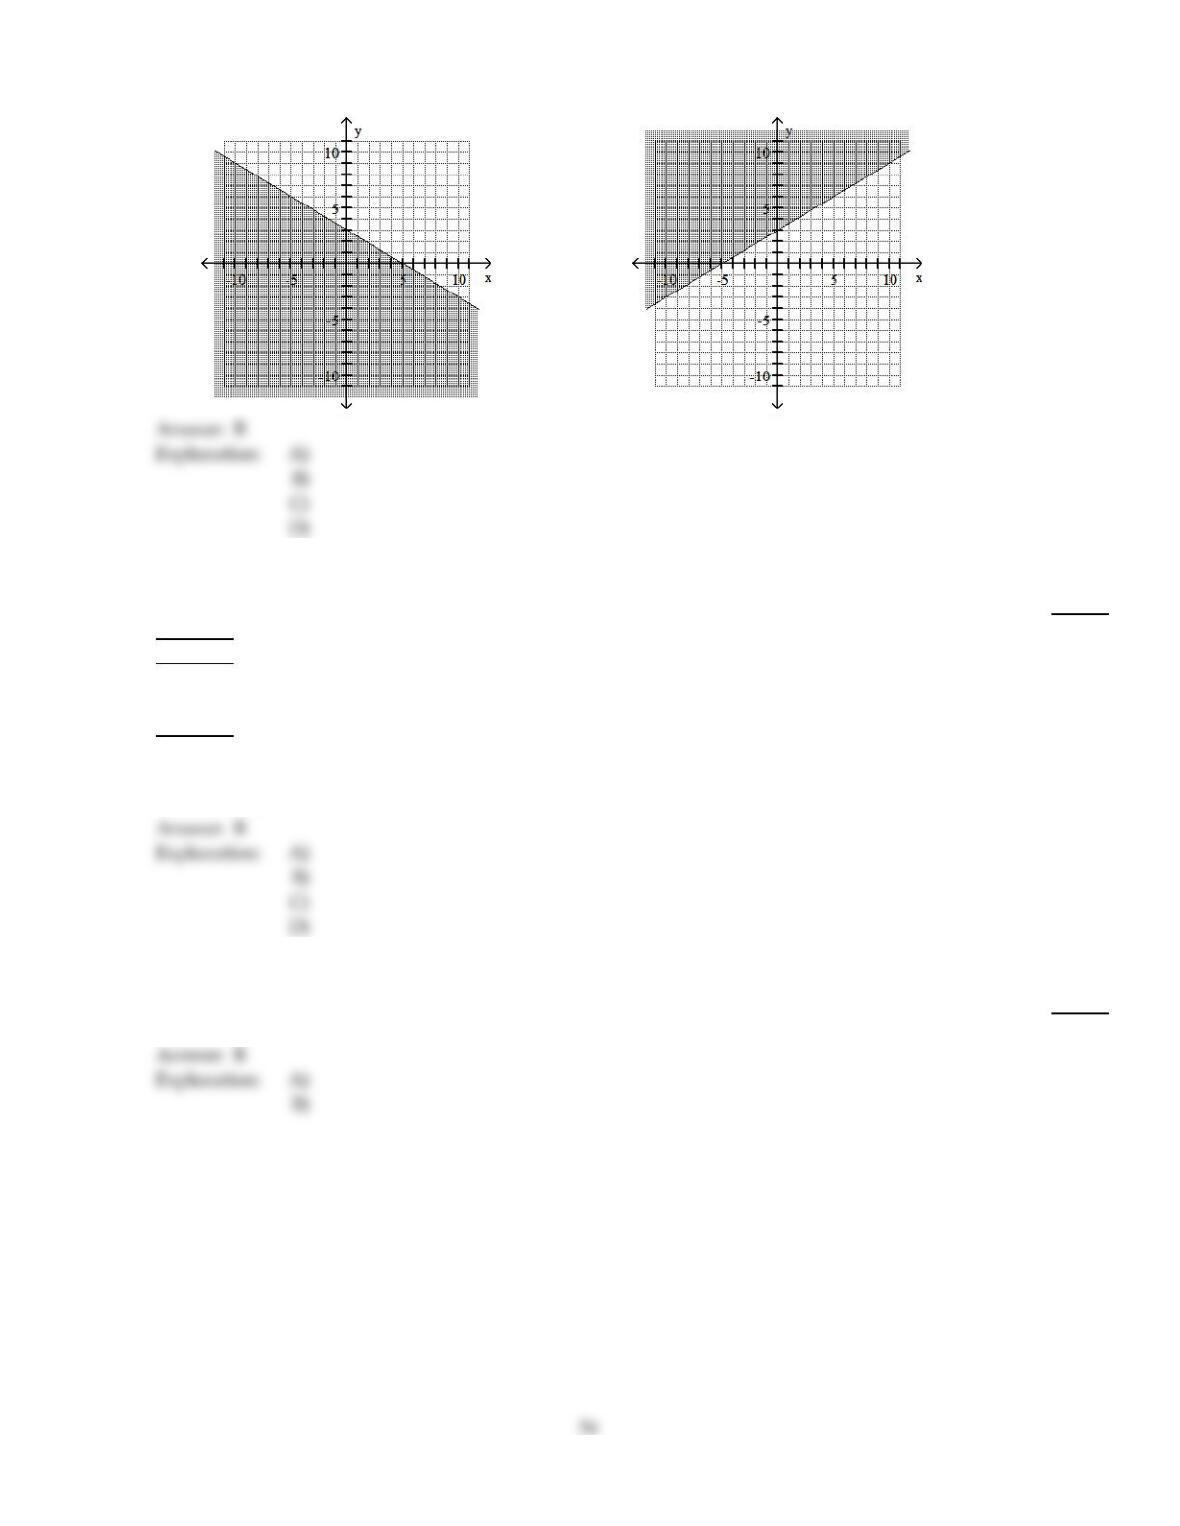
C)
D)
Complete the table of values. Write the results as ordered pairs.
119)
y =2
x y
–6
3
9
119)
A)
(–6, –12); (3, 6); (9, 18)
B)
(–6, 2); (3, 2); (9, 2)
C)
(–6, –8); (3, 1); (9, 7)
D)
(–6, –4); (3, 5); (9, 11)
B
Decide whether or not the ordered pair is a solution to the equation.
120)
y = – 5; (–3, 4)
120)
A)
Yes
B)
No
B
B
Complete the table of values, and then plot the ordered pairs.
121)
2x – y =4
x y
0
0
1
–6
121)
A)
x y
0 4
2 0
1–2
5–6
B)
x y
0 4
2 0
1 2
5–6
C)
x y
0–4
2 0
1–2
–2–6
D)
x y
0–4
2 0
1 0
–2–6
Graph the line through the given point with the given slope.
122)
(4, 0), m = – 1
2
122)
55
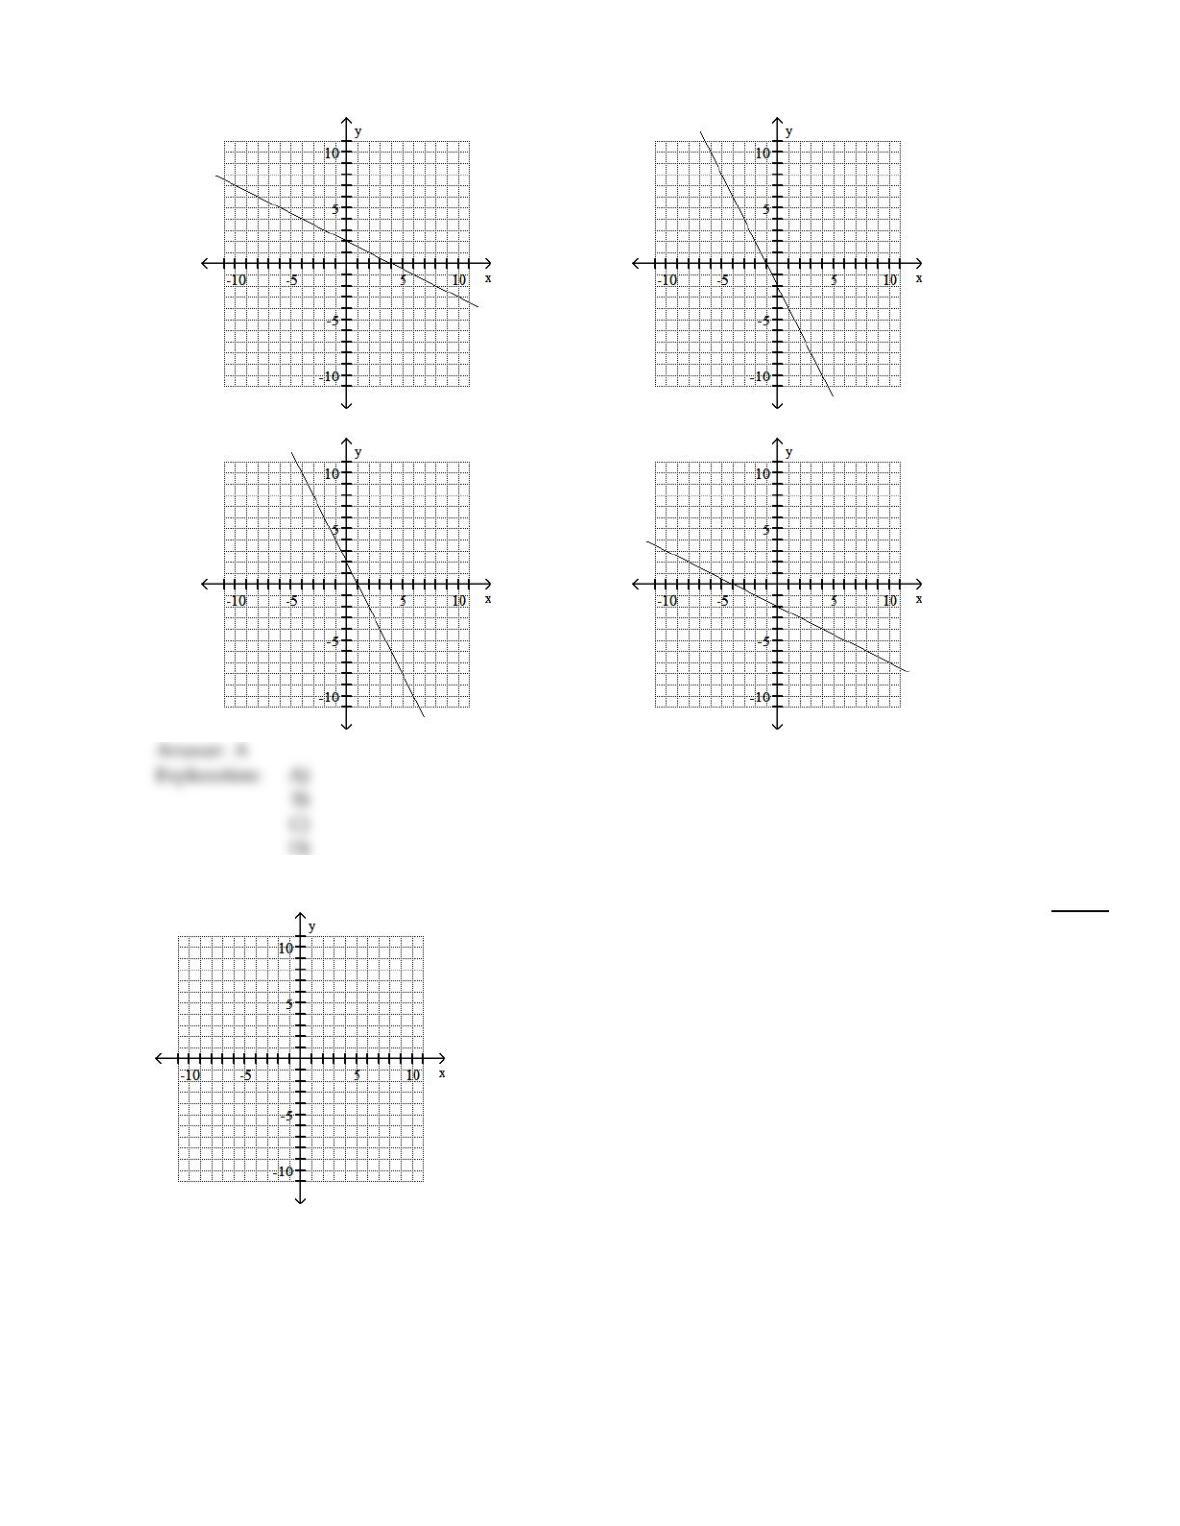
A)
B)
C)
D)
123)
(–3, –8), m =4
123)
56
A)
B)
C)
D)
Answer the question.
124)
True or False? The ordered pair (0, 0) determines a point in quadrant I with x–coordinate 0 and
y–coordinate 0.
124)
A)
True
B)
False
125)
True or False: The graph of the equation 6x –10y =16 goes through (10, 4)
125)
A)
True
B)
False
Answer Key
Testname: C11
Answer Key
Testname: C11
Answer Key
Testname: C11