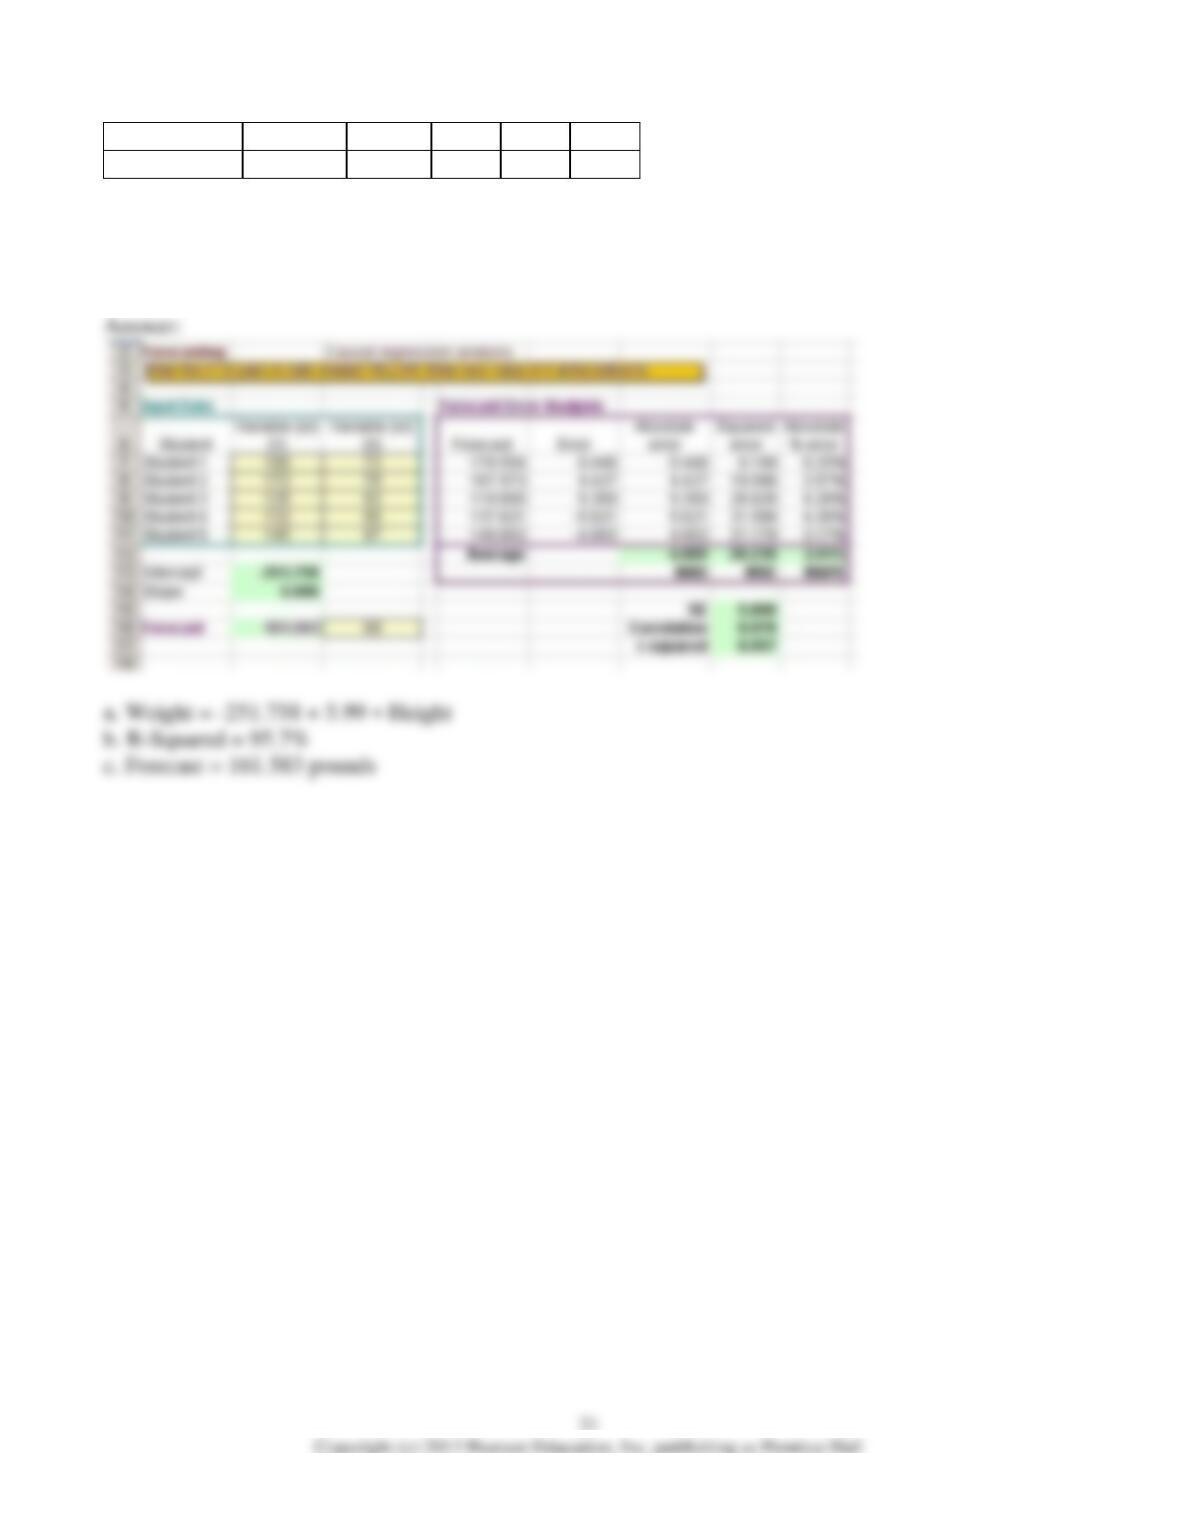
11) The following data were collected on the height (inches) and weight (pounds) of 5 students.
Height
72
70
62
65
67
Weight
180
172
125
132
145
a. Develop a regression model to predict weight based on height.
b. What percent of the total variation in weight has been explained by height?
c. If a student is 69 inches tall, what would you estimate the weight to be?
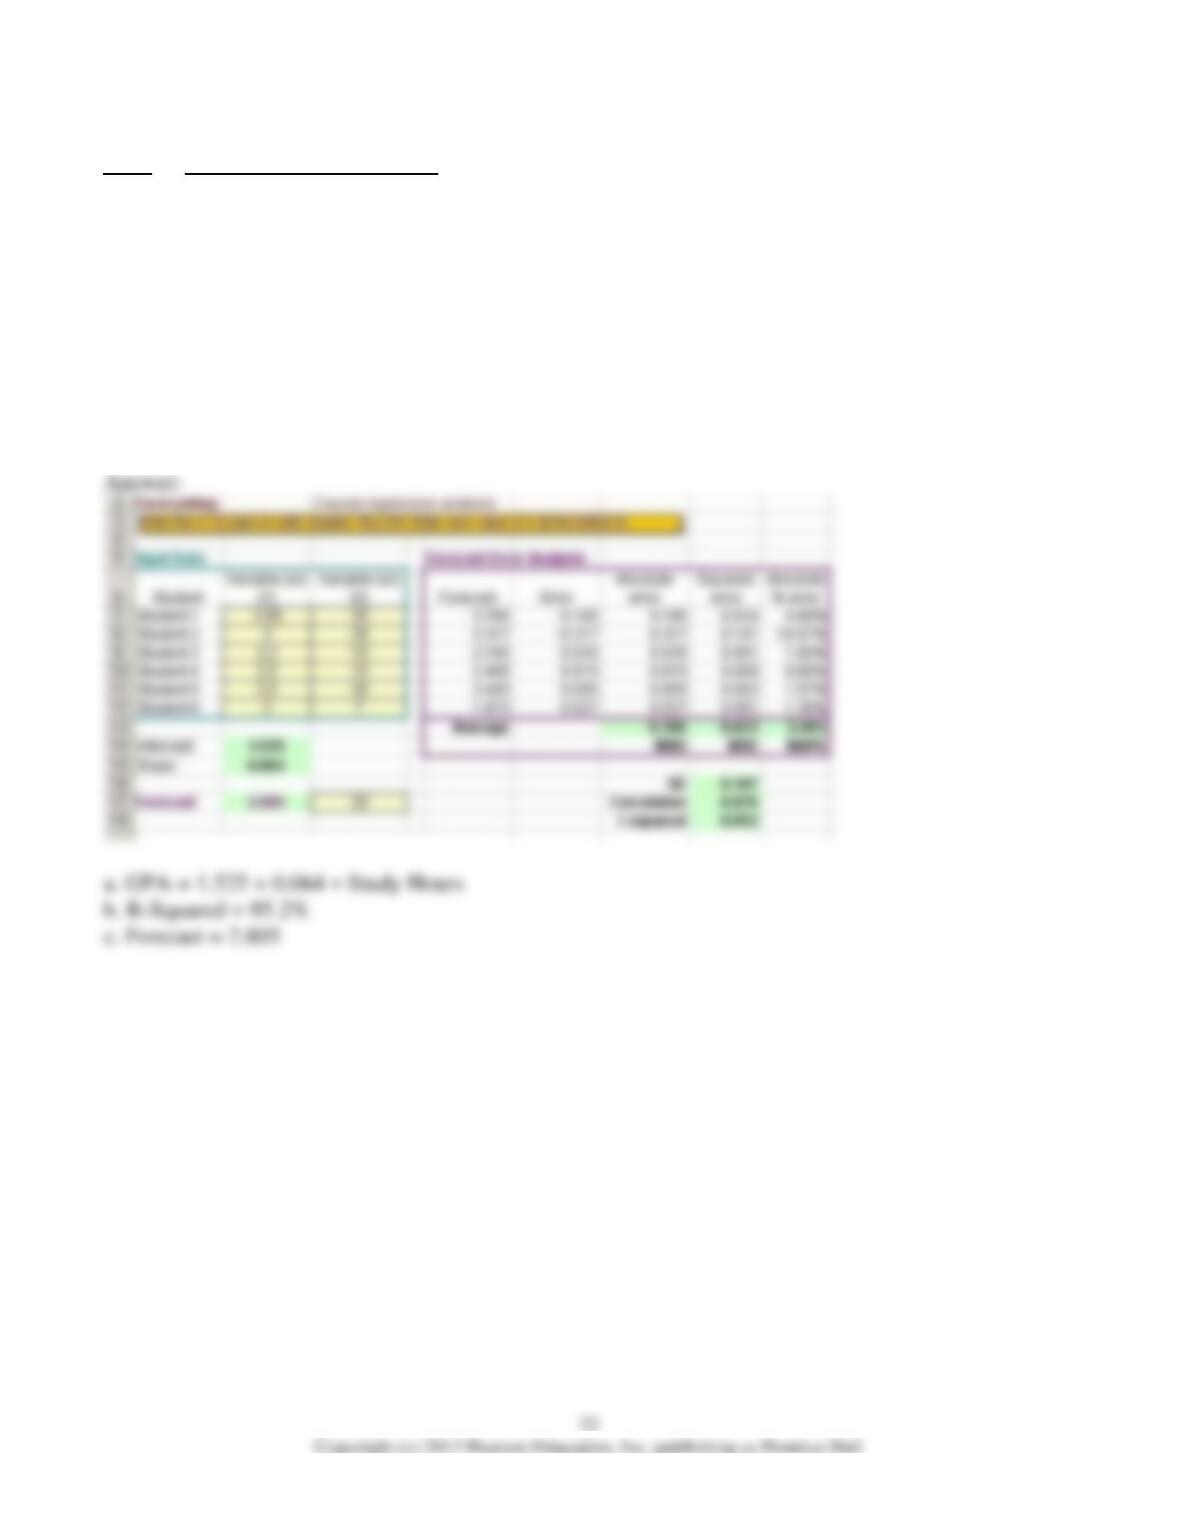
12) The following data were collected on the number of study hours per week, and the current GPA of 6
students at a local college.
GPA No. of Study Hours/Week
3.95 35
3.00 28
2.20 10
2.5 15
3.5 30
2.00 7
a. Develop a regression model to predict GPA based on the number of study hours.
b. What percent of the total variation in GPA has been explained by study hours?
c. If a student studies 20 hours per week, what would you estimate the GPA to be?
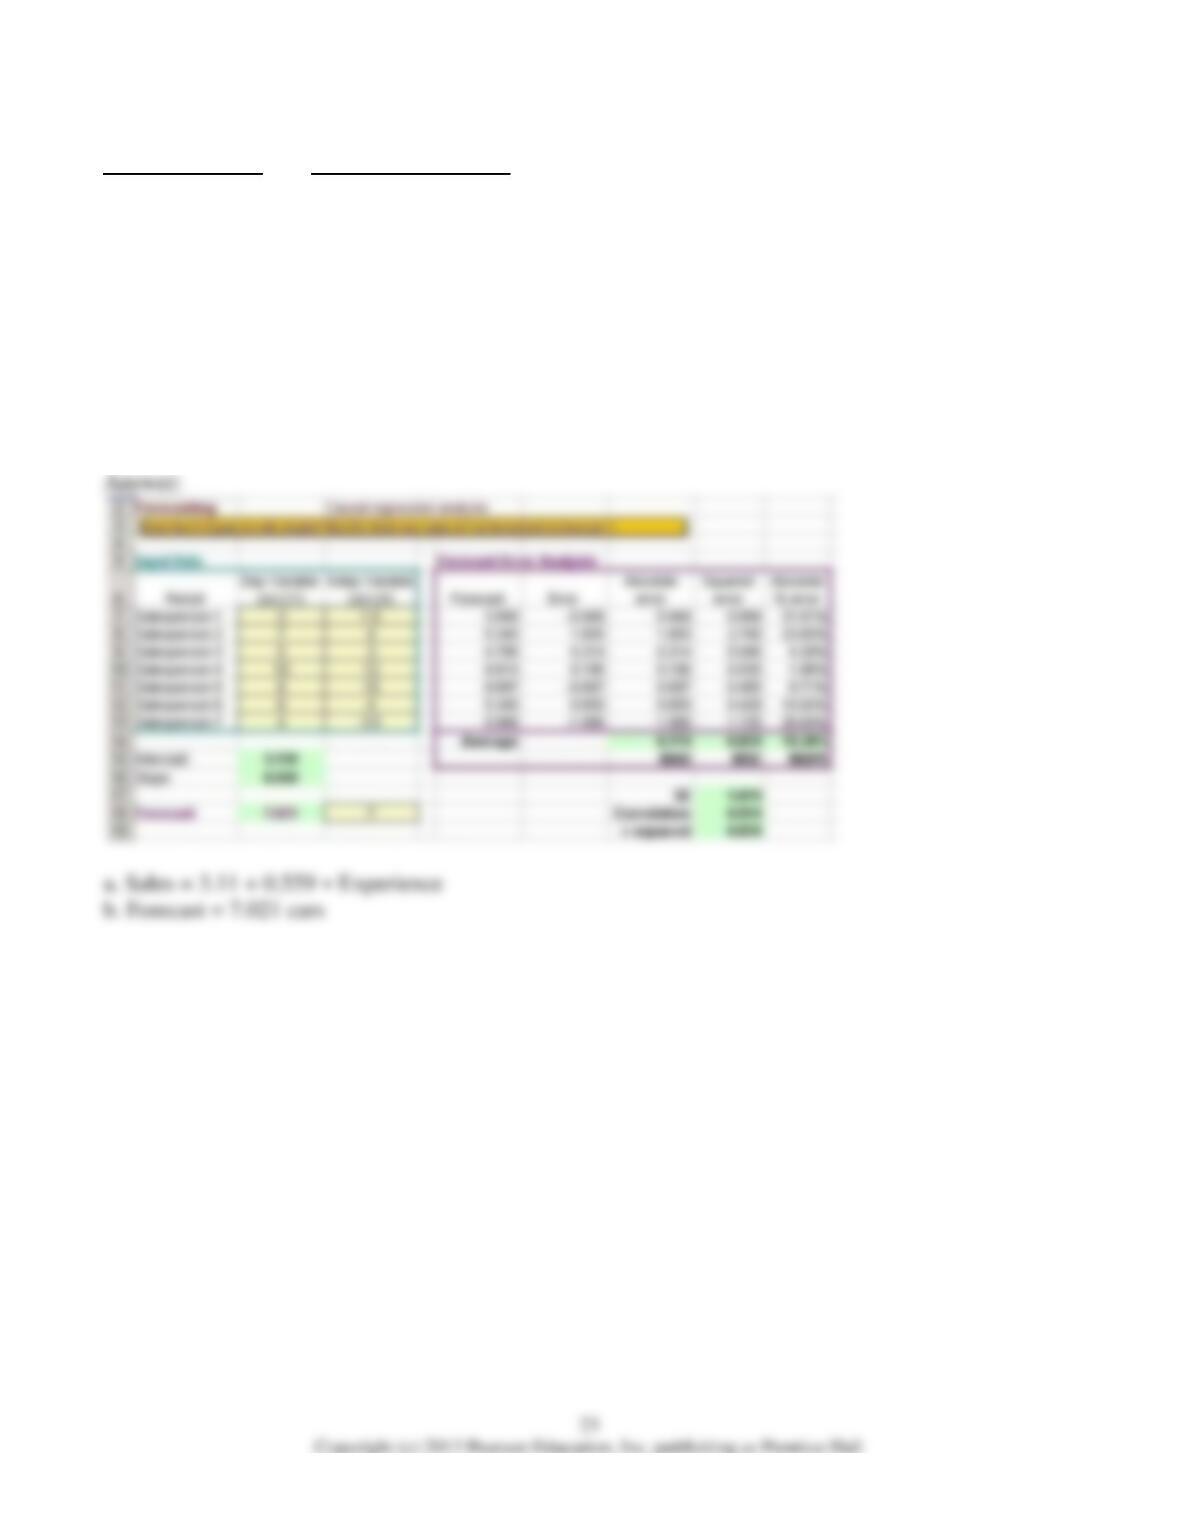
13) A car sales manager has collected the following data on the number of cars sold per week and years
of experience for 7 of his salespeople.
Cars Sold/Week Years of Experience
3 1.5
7 4
5 3
10 12
8 10
6 4
4 3.5
a. Develop a regression model to predict sales based on years of experience.
b. Use the estimated regression model to predict sales for a salesperson with 7 years of experience.
Use this information to answer the following questions.
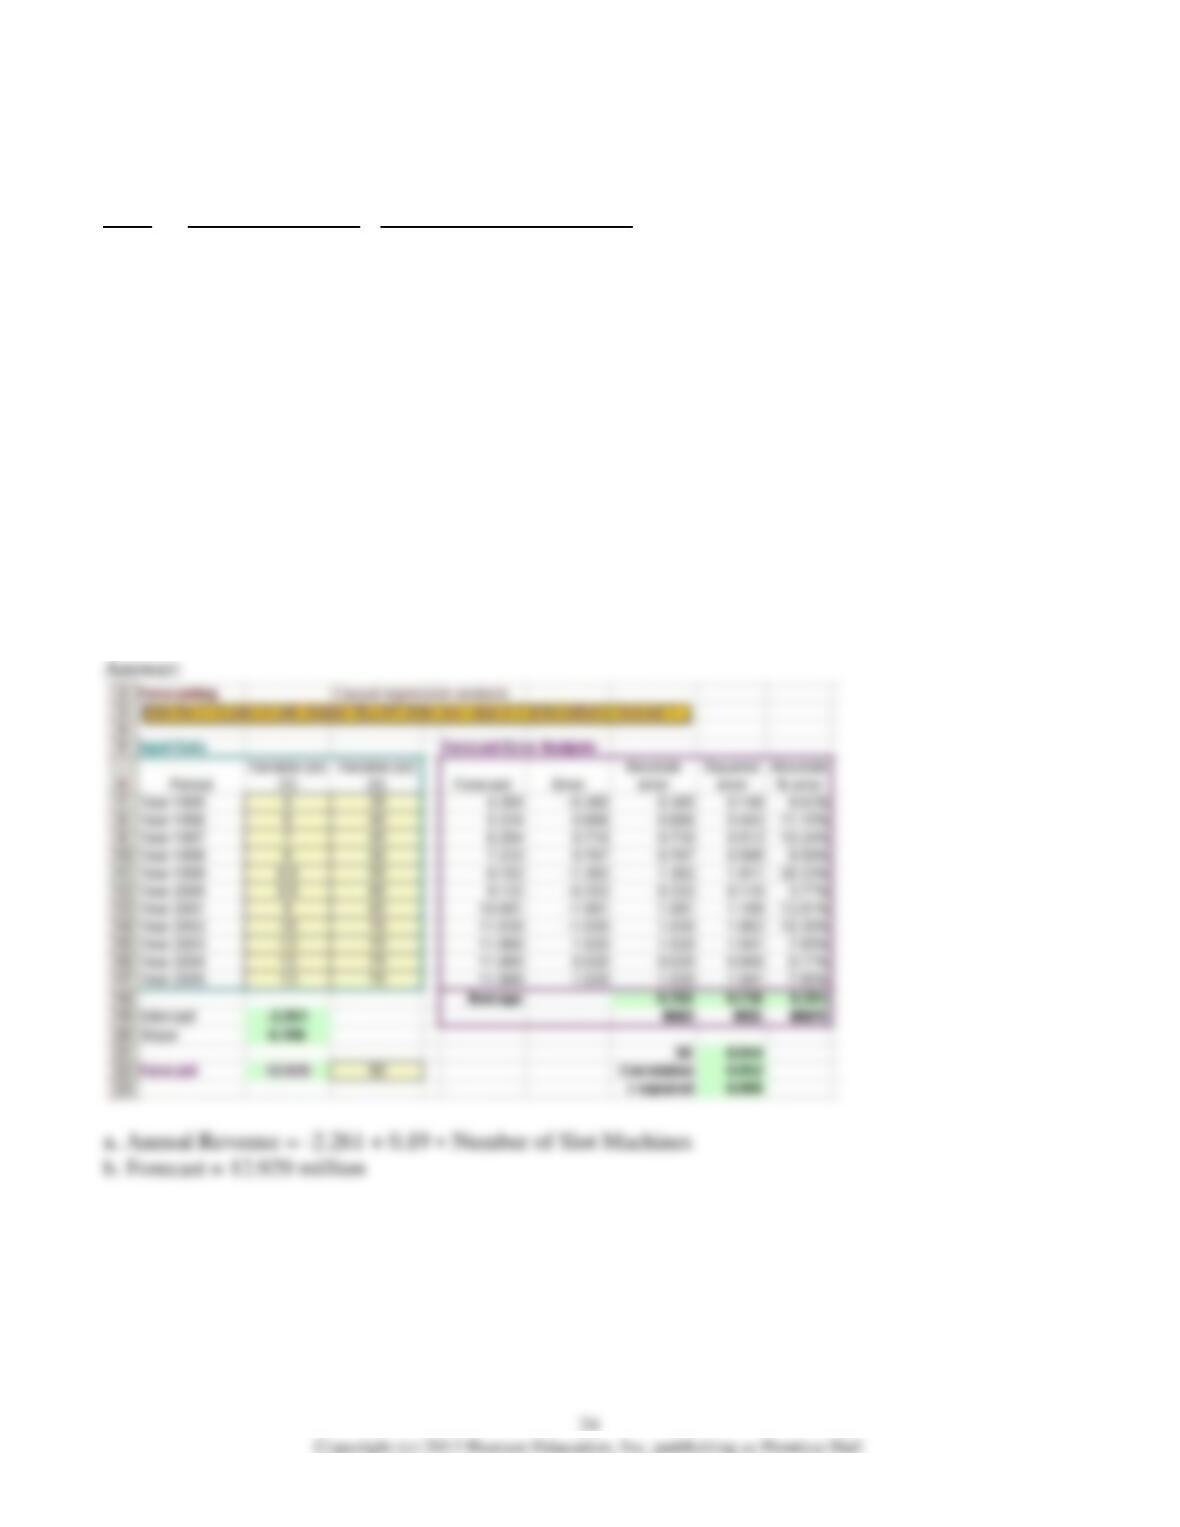
The following data were collected on annual revenues (millions) and the number of slot machines in a
Las Vegas casino from 1995 to 2005.
Year Annual Revenues Number of Slot Machines
1995 4 35
1996 6 40
1997 7 45
1998 8 50
1999 6.8 55
2000 8.8 60
2001 9 65
2002 10 70
2003 13 75
2004 12 75
2005 13 75
14) Refer to the table above.
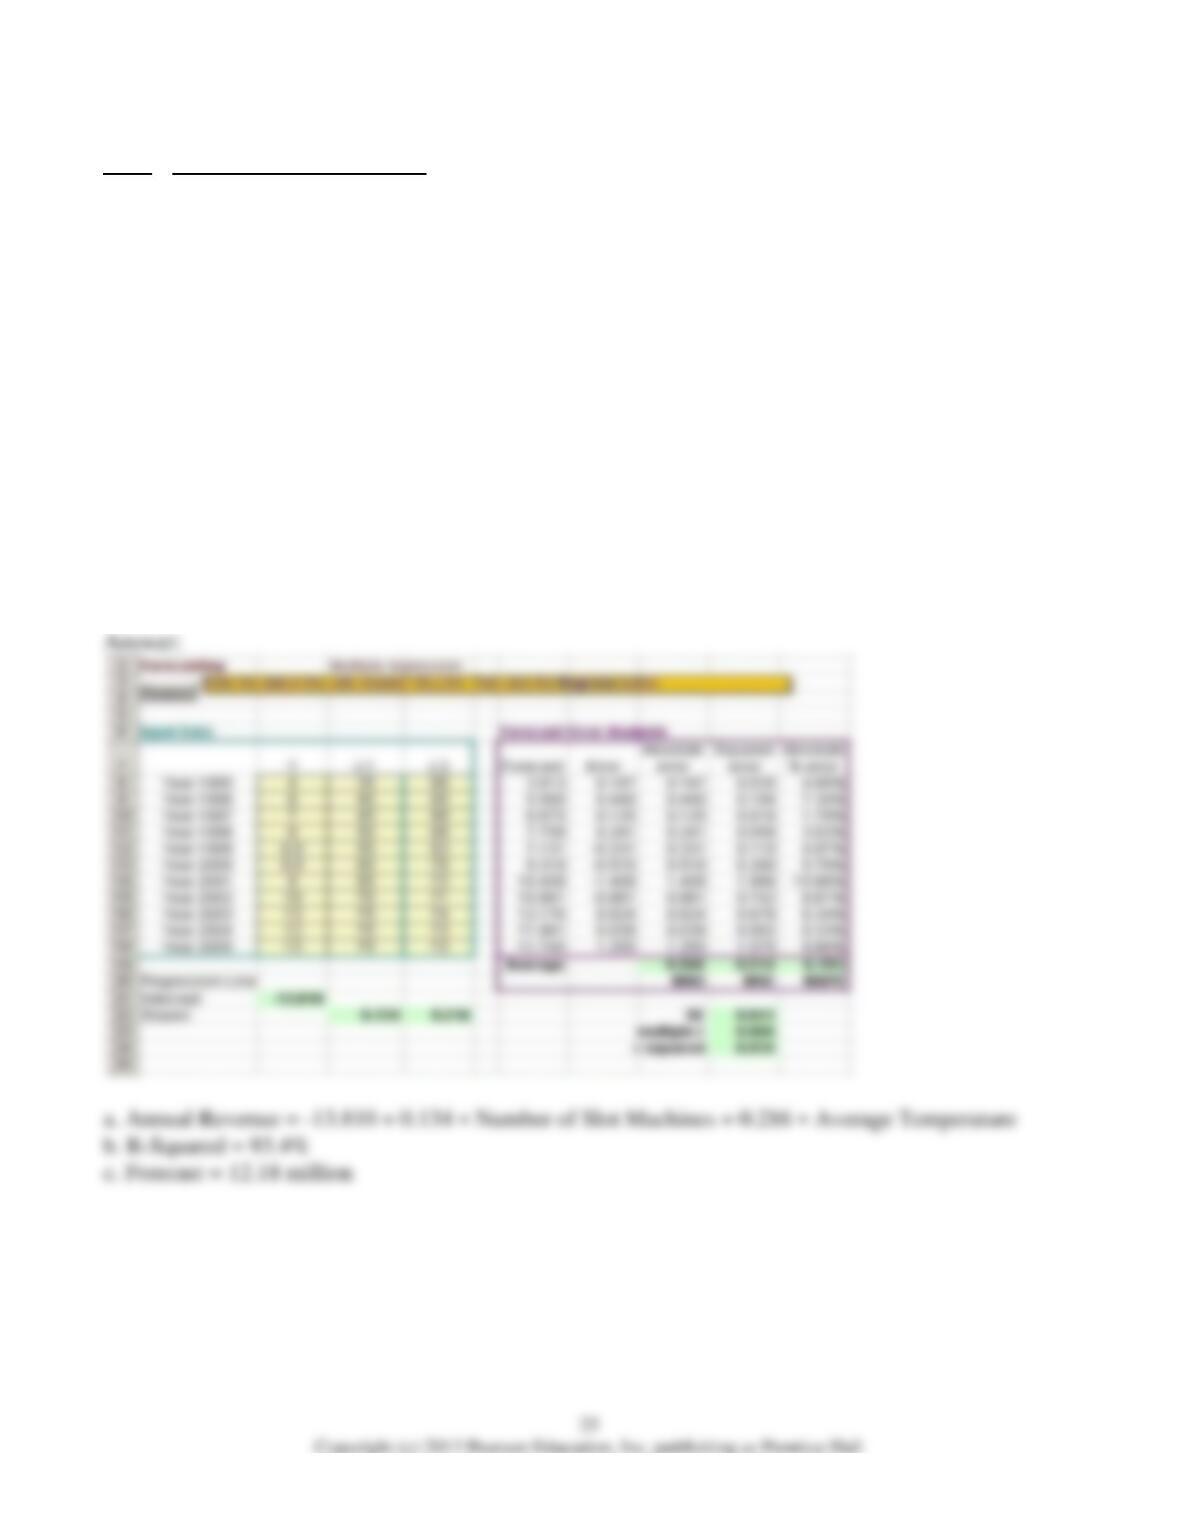
a. Develop a regression model to predict annual revenues based on the number of slot machines.
b. Use the estimated regression model to predict annual revenues with 80 slot machines.
15) Refer to the table above. Suppose that the casino manager believes that warmer weather attracts
more gamblers. The data on average yearly temperatures from 1995 to 2005 are shown as follows.
Year Average Temperature (F)
1995 60
1996 65
1997 68
1998 69
1999 63
2000 70
2001 72
2002 71
2003 74
2004 73
2005 72
a. Develop a regression model to predict annual revenue based on the number of slot machines and
average temperature.
b. What percent of the total variation in revenue is explained by the regression model?
c. Predict annual revenue if the casino has 75 slot machines and the average temperature is 74 degrees.

26
Use this information to answer the following questions.
The following time series, provided by the Federal Loan Home Mortgage Corporation, represents
weekly 30-year fixed mortgage rates.
Date Mortgage Rate (%)
October 14, 2005 6.03
October 21, 2005 6.10
October 28, 2005 6.15
November 4, 2005 6.31
November 11, 2005 6.36
November 18, 2005 6.37
November 25, 2005 6.28
December 2, 2005 6.26
December 9, 2005 6.32
December 16, 2005 6.30
December 23, 2005 6.26
December 30, 2005 6.22
January 6, 2006 6.21
January 13, 2005 6.15
27
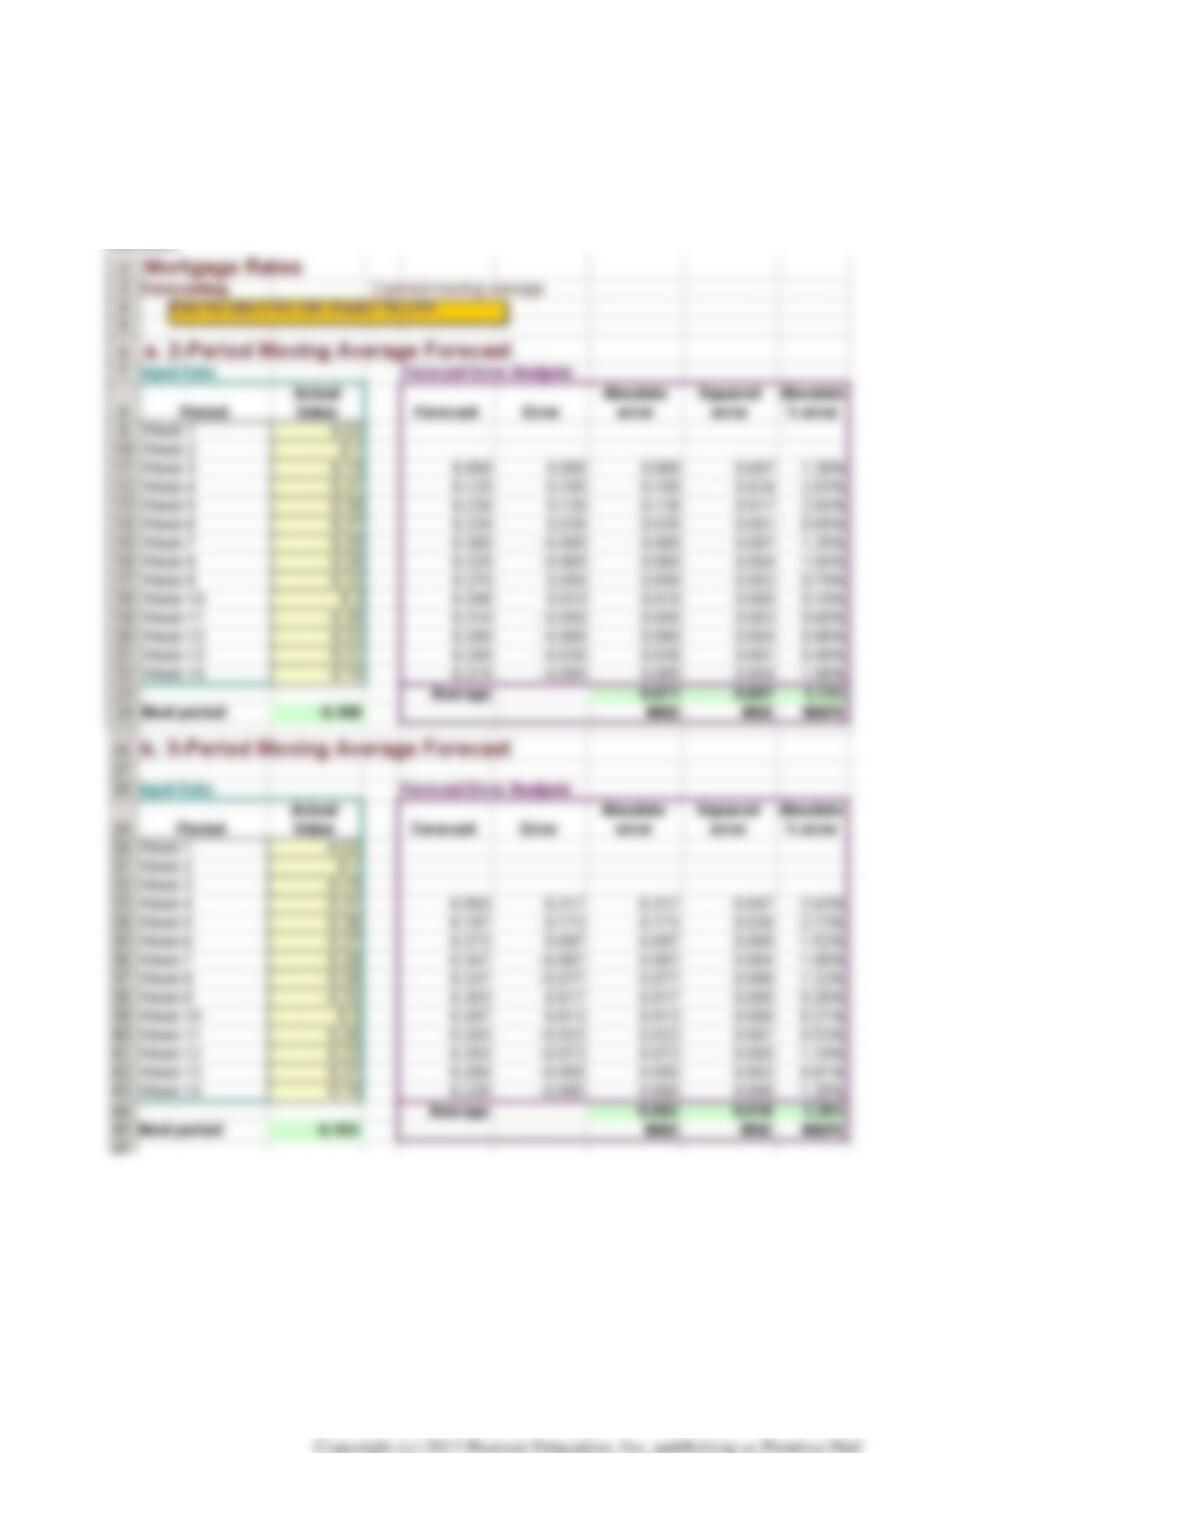
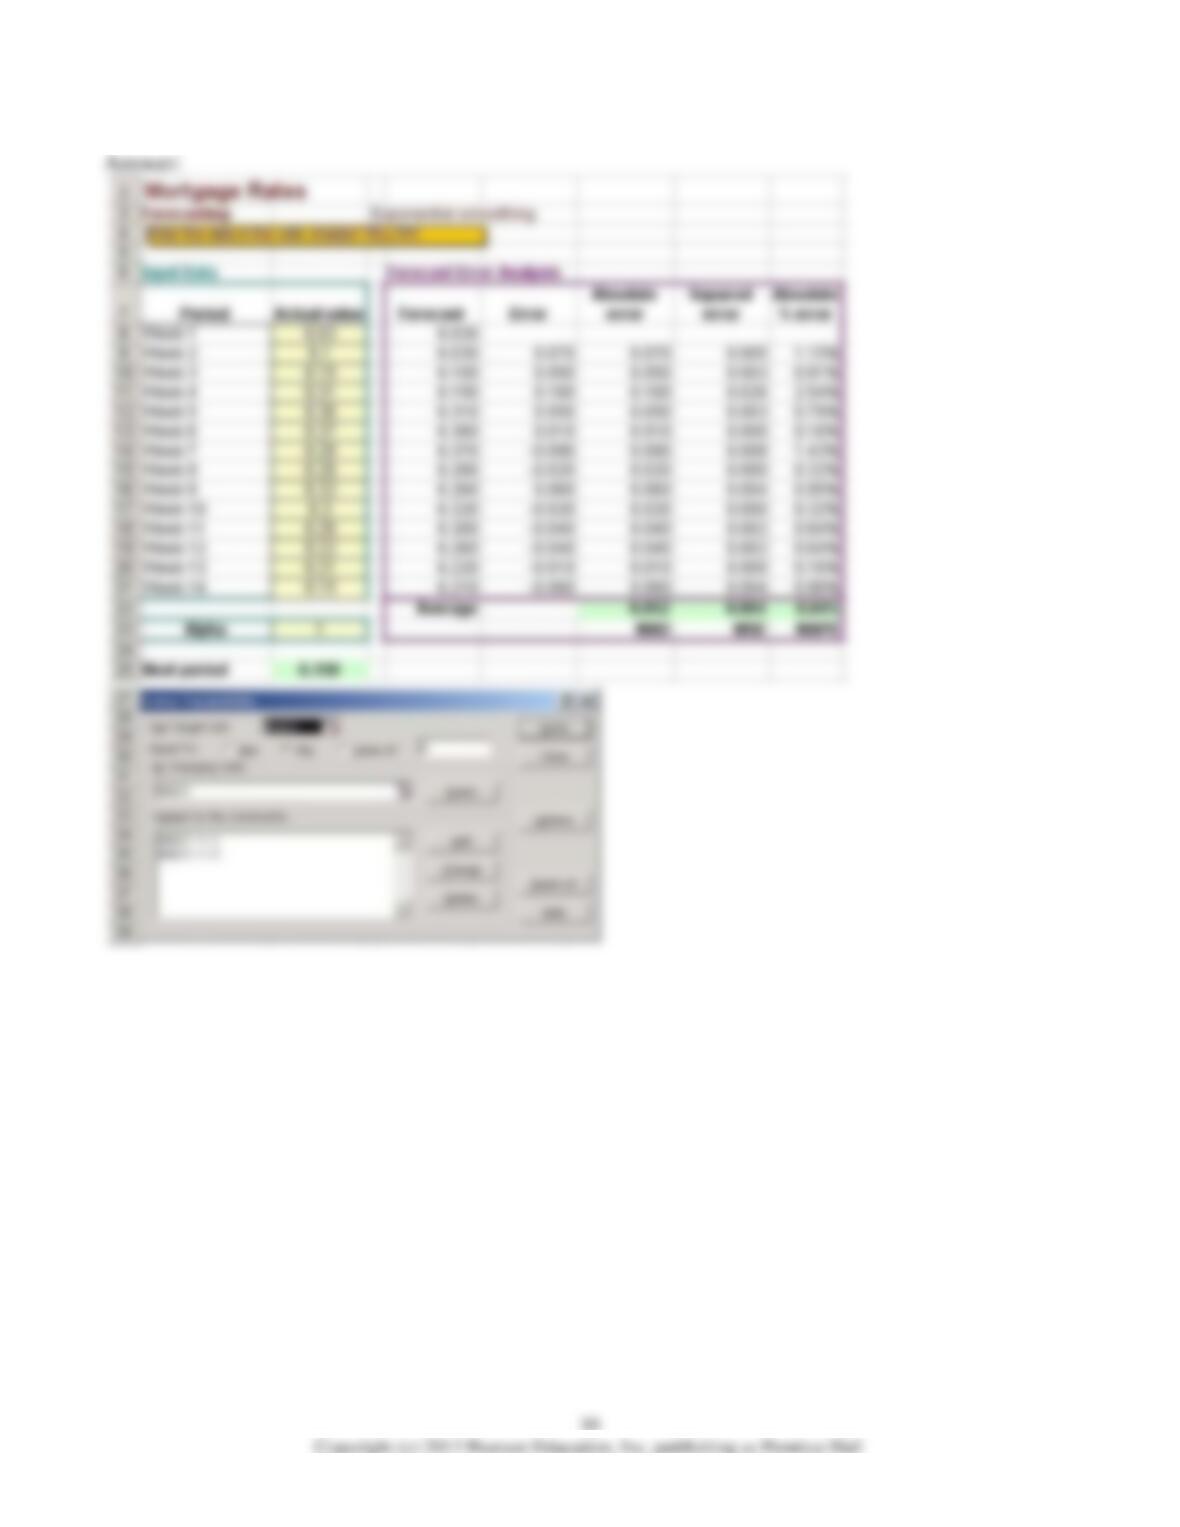
16) Refer to the table above.
a. Use a 2-period moving average to forecast the next weekly mortgage rate.
b. Use a 3-period moving average to forecast the next weekly mortgage rate.
c. Use a 4-period moving average to forecast the next weekly mortgage rate.
d. Which averaging period provides a better historical fit based on the MAD criterion?
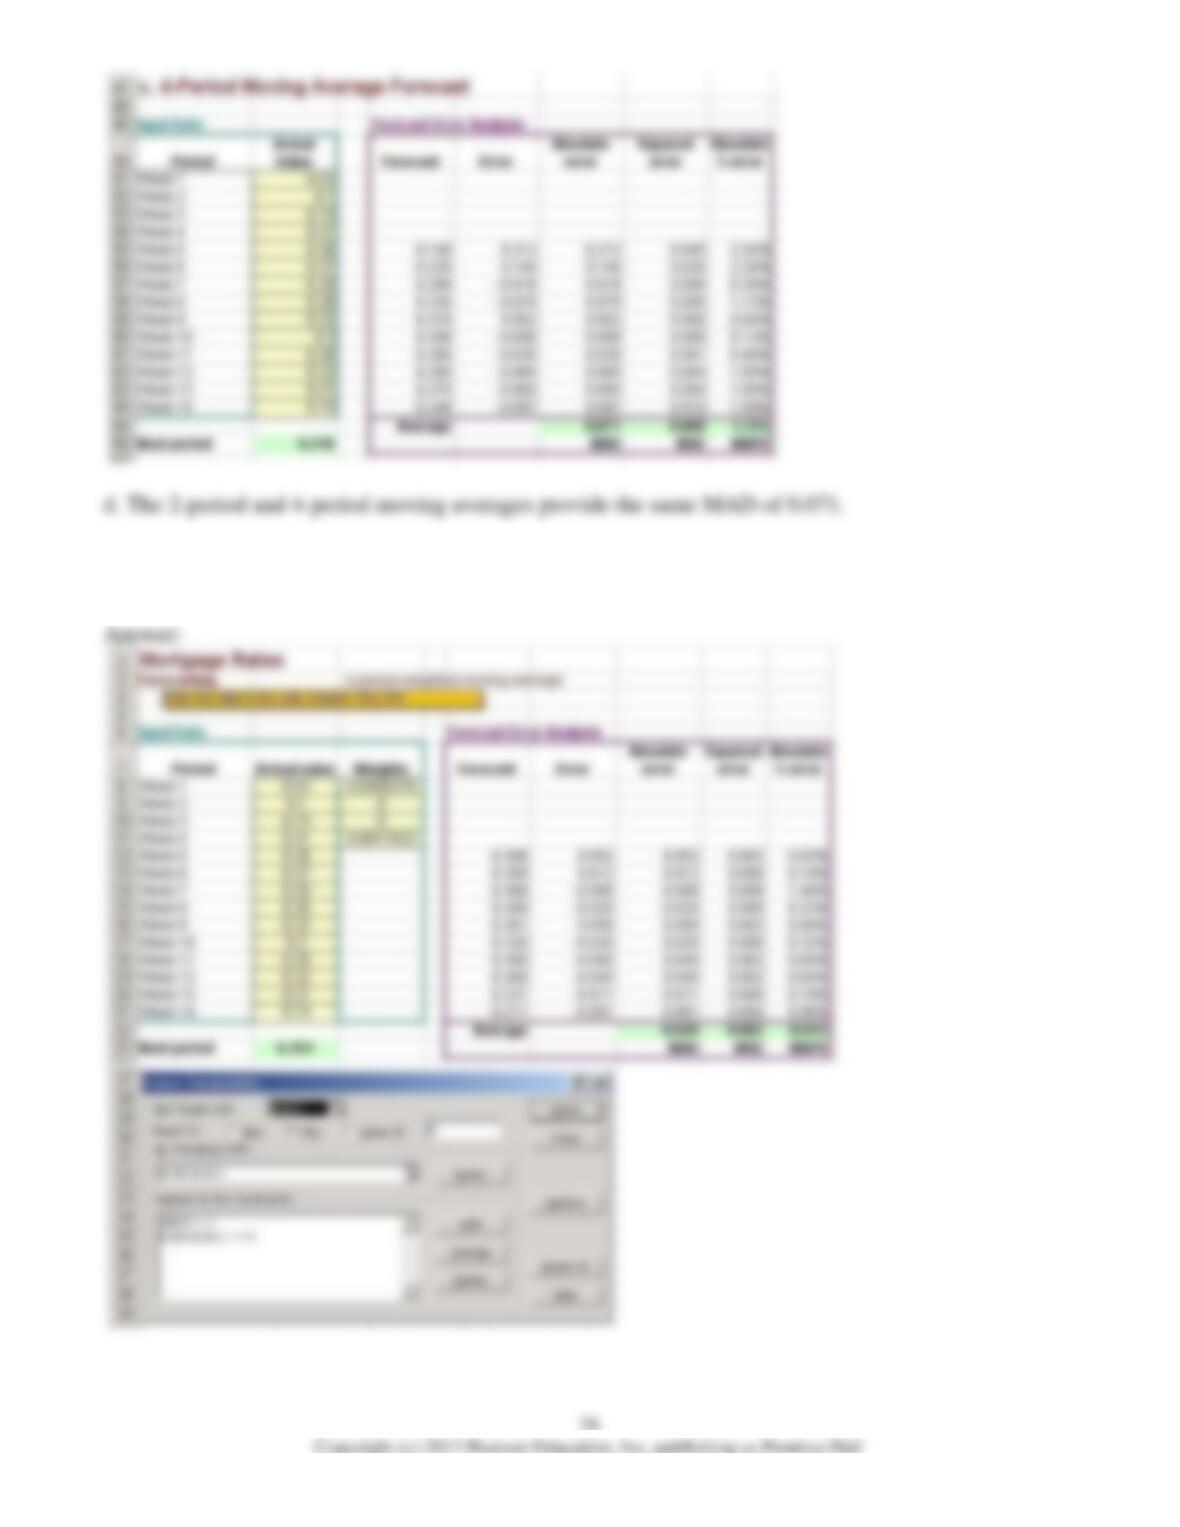
17) Refer to the table above. Use a 4-period weighted moving average to forecast the next weekly
mortgage rate. Use Solver to determine the optimal weights based on minimizing the MAD criterion.
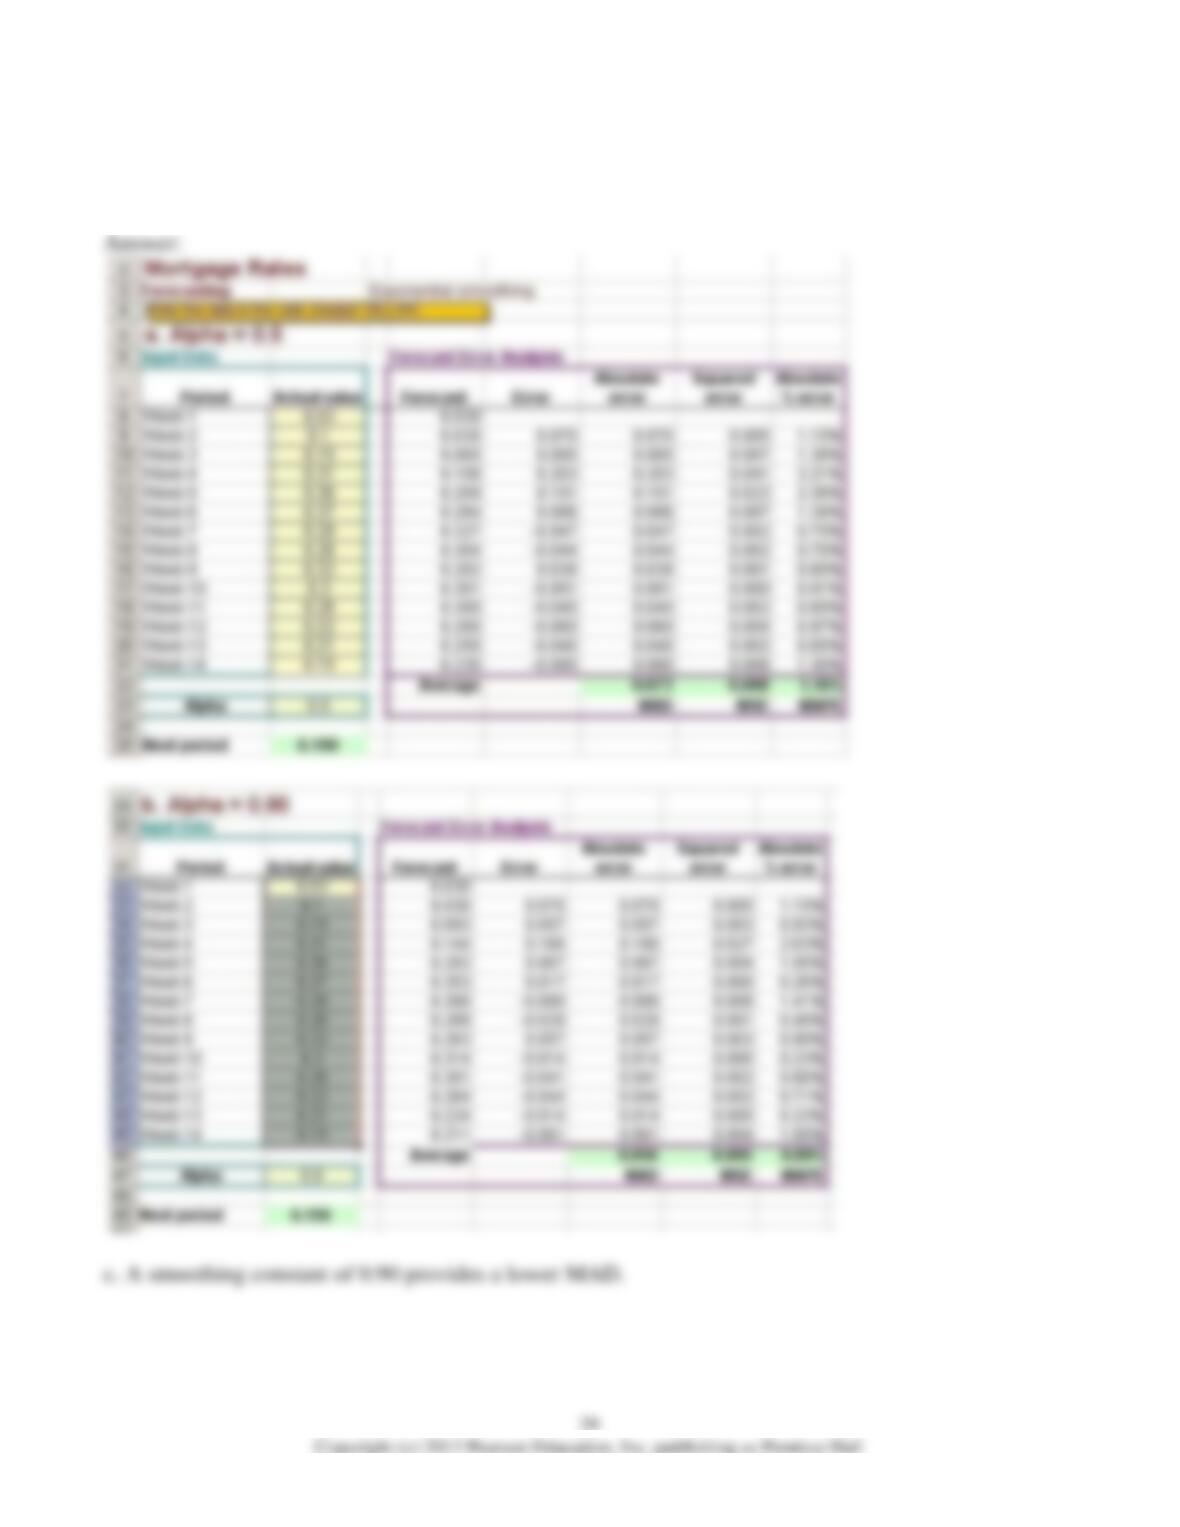
18) Refer to the table above.a. Use exponential smoothing with a smoothing constant of 0.5 to forecast
the next weekly mortgage rate.
b. Use exponential smoothing with a smoothing constant of 0.9 to forecast the next weekly mortgage
rate.
c. Which of the two methods provides a more accurate forecast based on the MAD criterion?
19) Refer to the table above. Use Solver to find the optimal alpha that minimizes MAD, and use
exponential smoothing to forecast the next weekly mortgage rate.
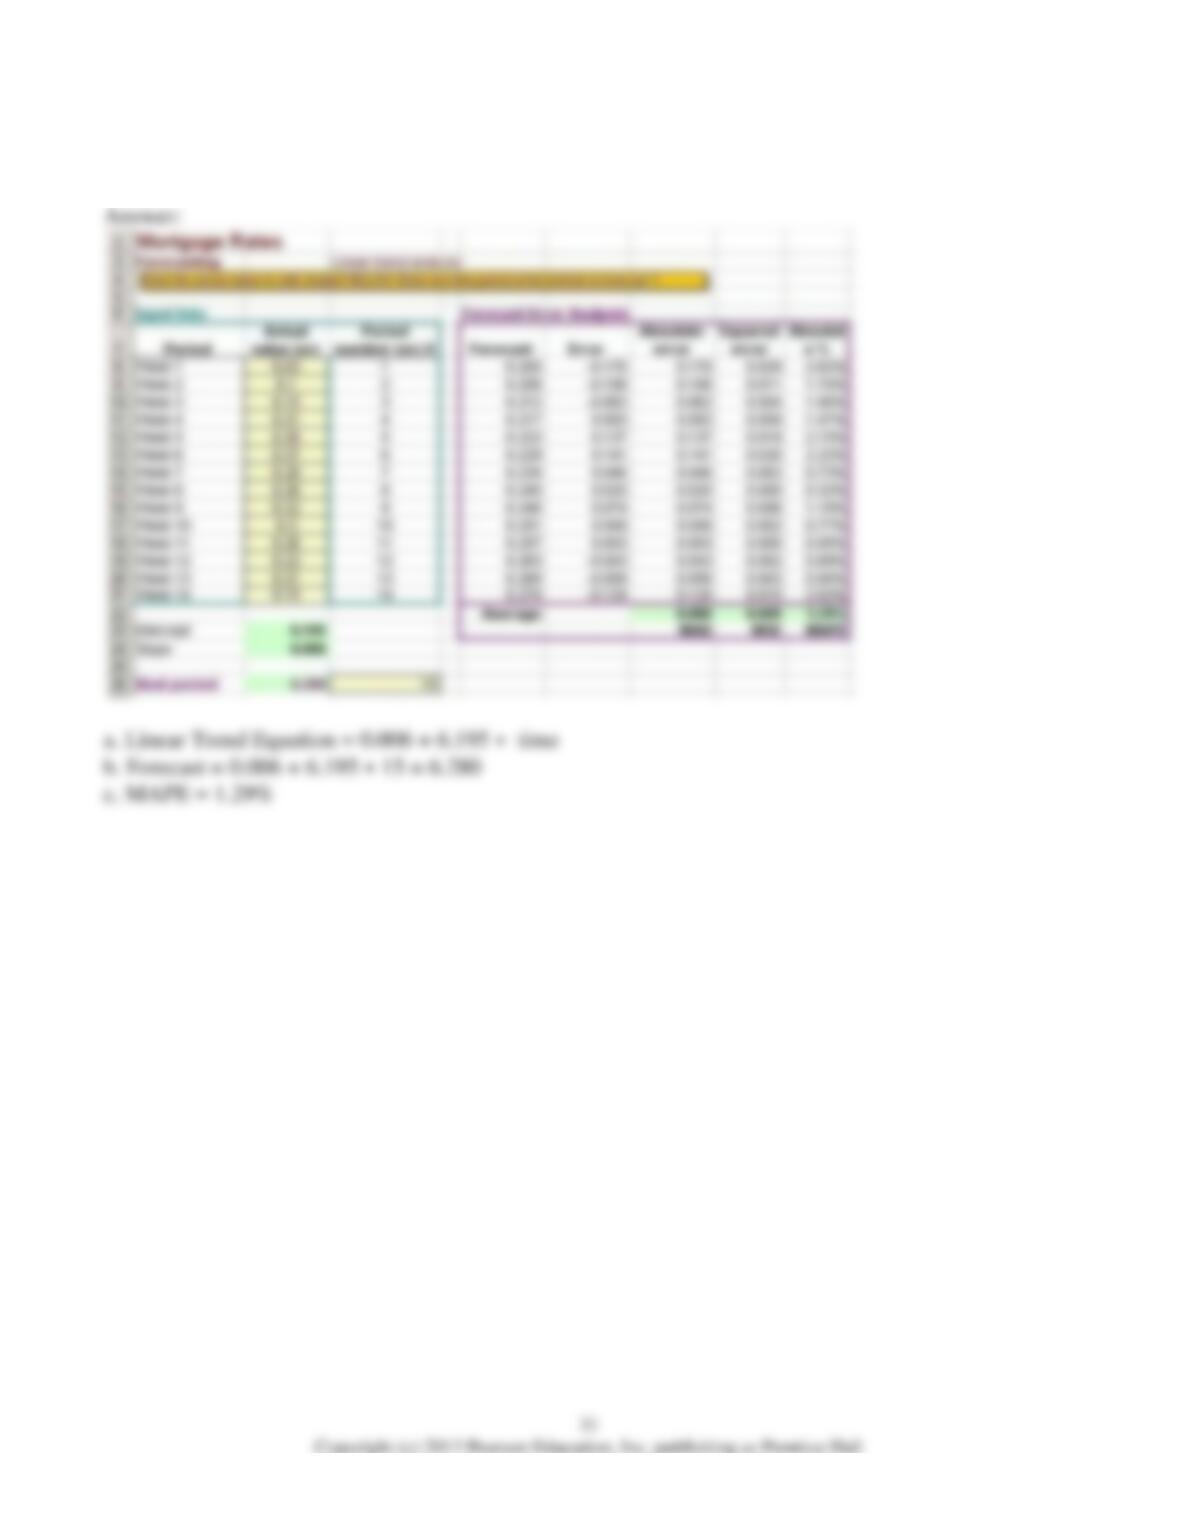
20) Refer to the table above.
a. What is the linear trend equation that best fits the data?
b. What is the forecast of the next weekly mortgage rate?
c. What is the MAPE for this method?
Use this information to answer the following questions.
A hot dog stand owner has collected the following time series data on the number of hot dogs sold over
the last 12 quarters.
Year
Quarter
Demand
1
Winter
29
1
Spring
65
1
Summer
56
1
Fall
45
2
Winter
23
2
Spring
57
2
Summer
48
2
Fall
32
3
Winter
14
3
Spring
55
3
Summer
52
3
Fall
25
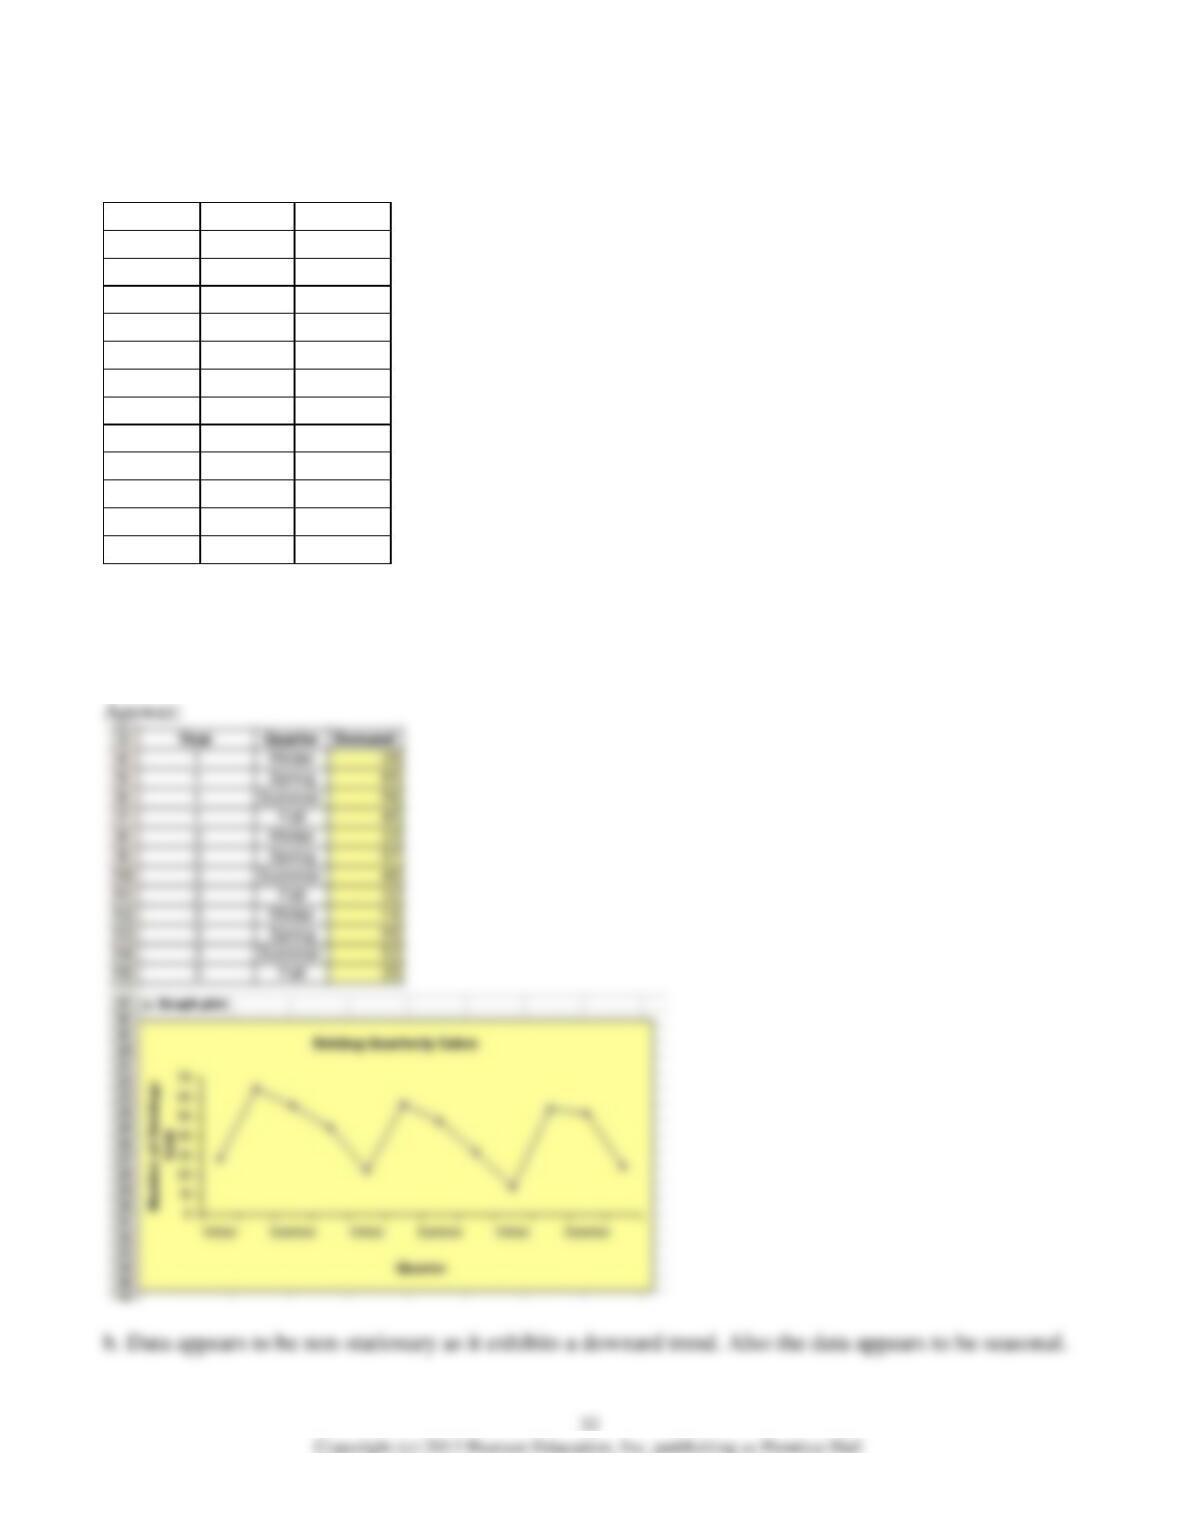
21) Refer to the table above.
a. Prepare a line graph of the time series data.
b. Do the data appear to be stationary or non-stationary?