33
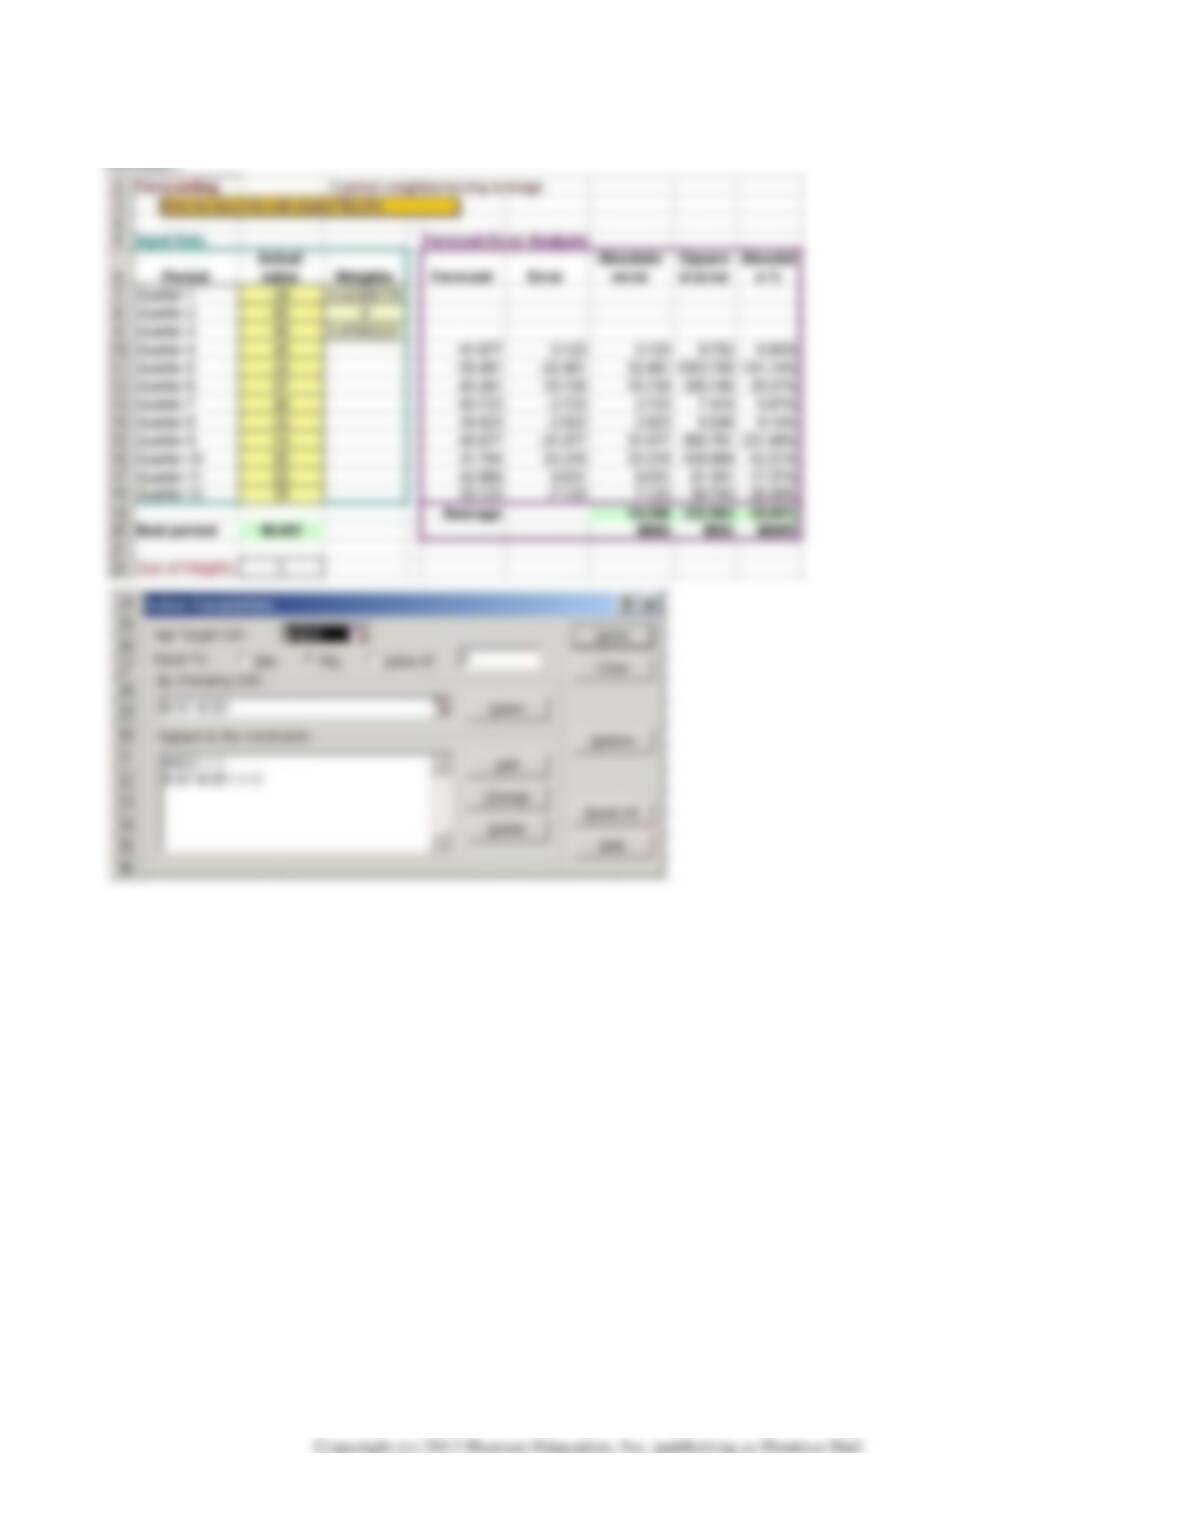
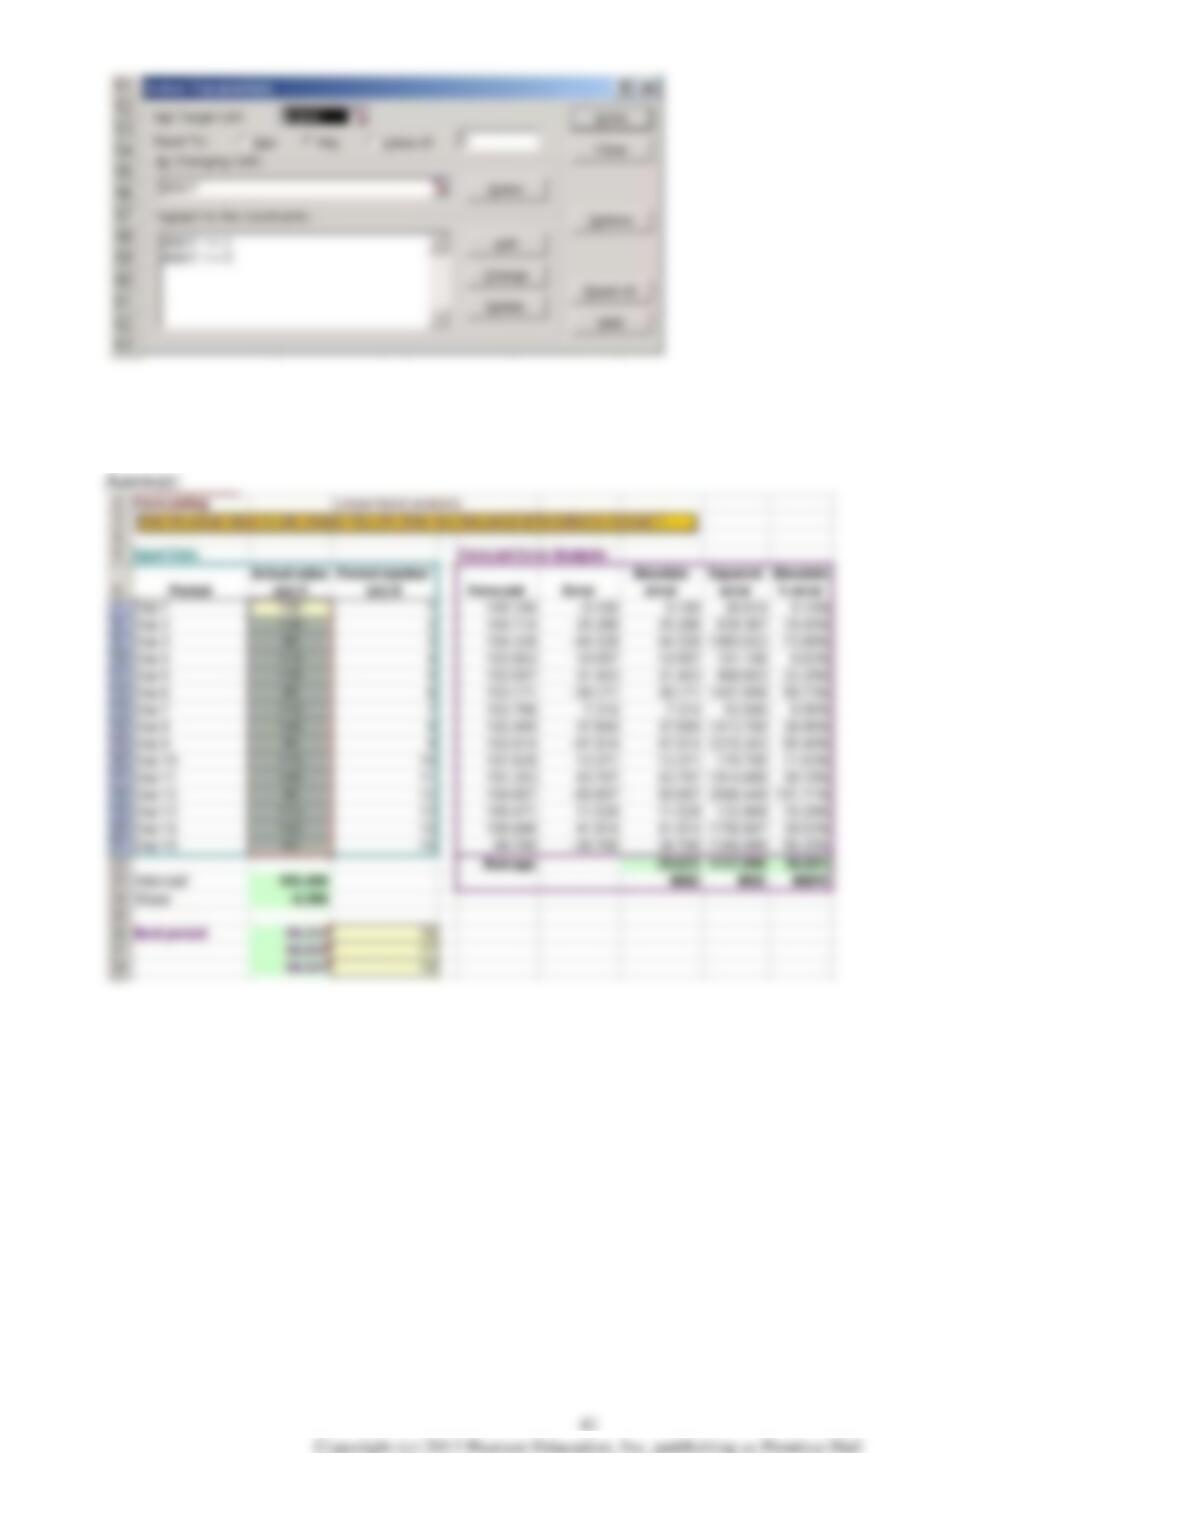
22) Refer to the table above. Forecast next quarterly sales using a 3-period weighted moving average.
Use Solver to determine the optimal weights that minimize MSE.
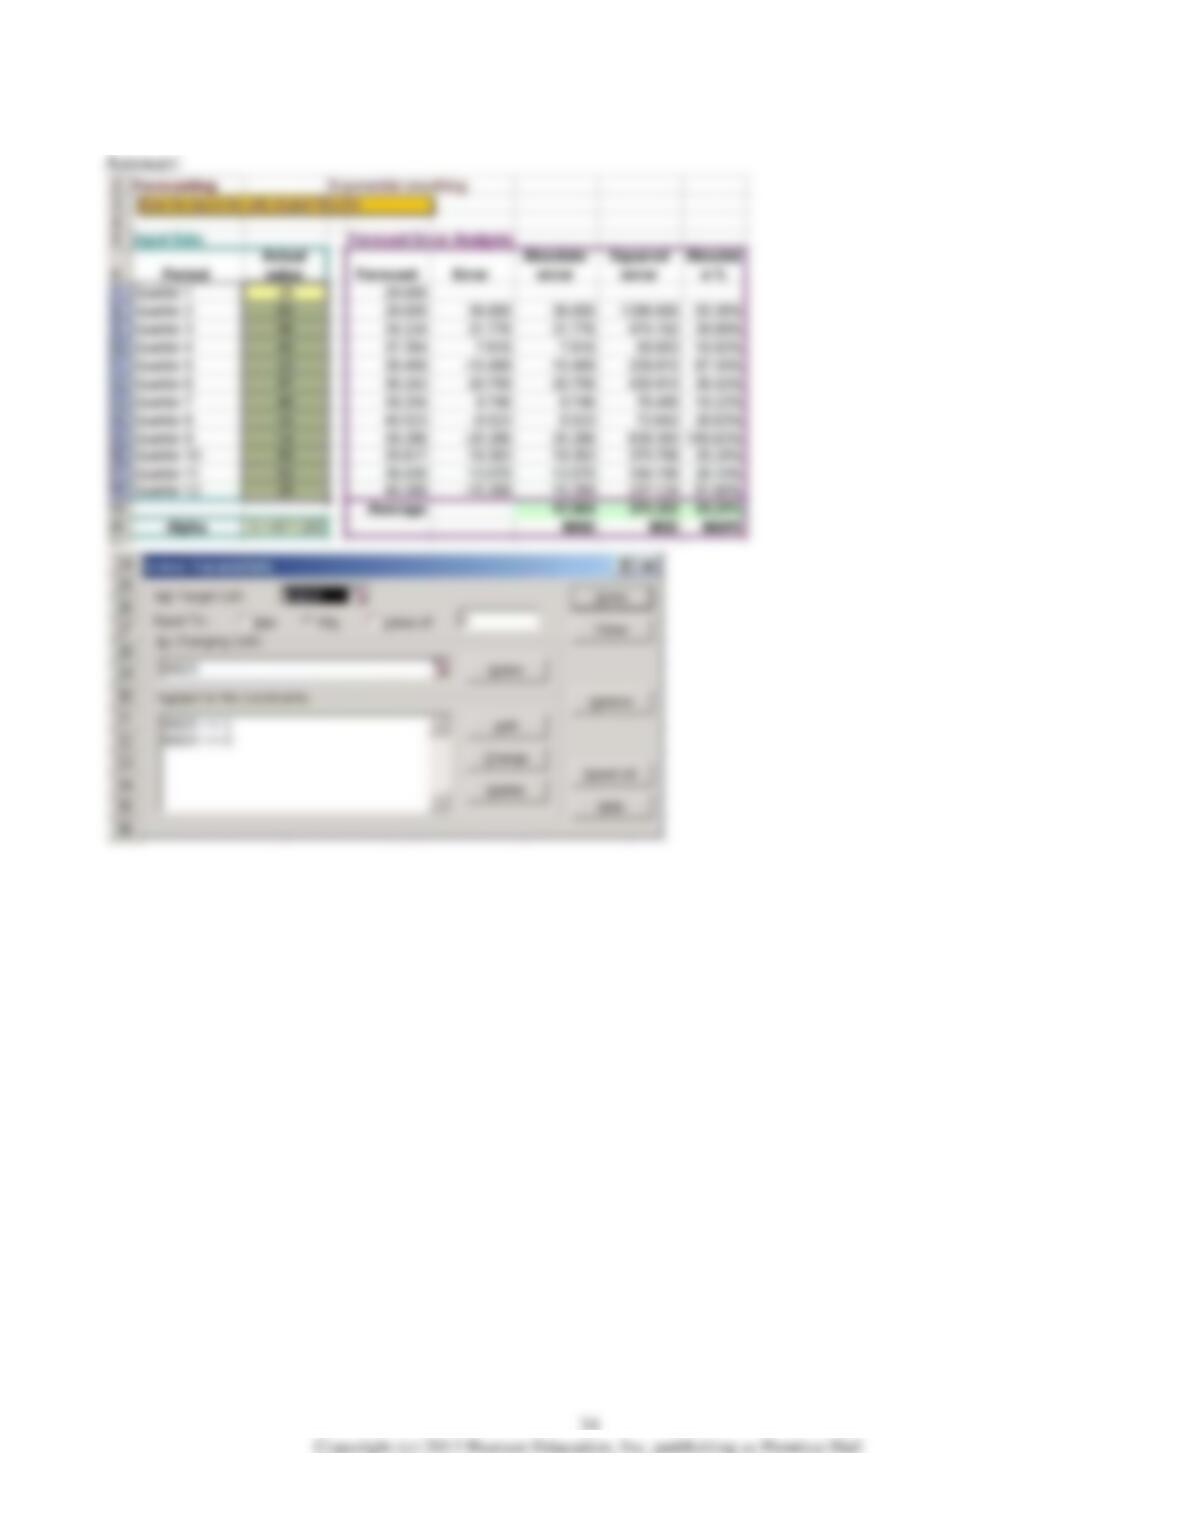
23) Refer to the table above. Forecast next quarterly sales using exponential smoothing. Use Solver to
find the optimal smoothing constant value that minimizes MSE.
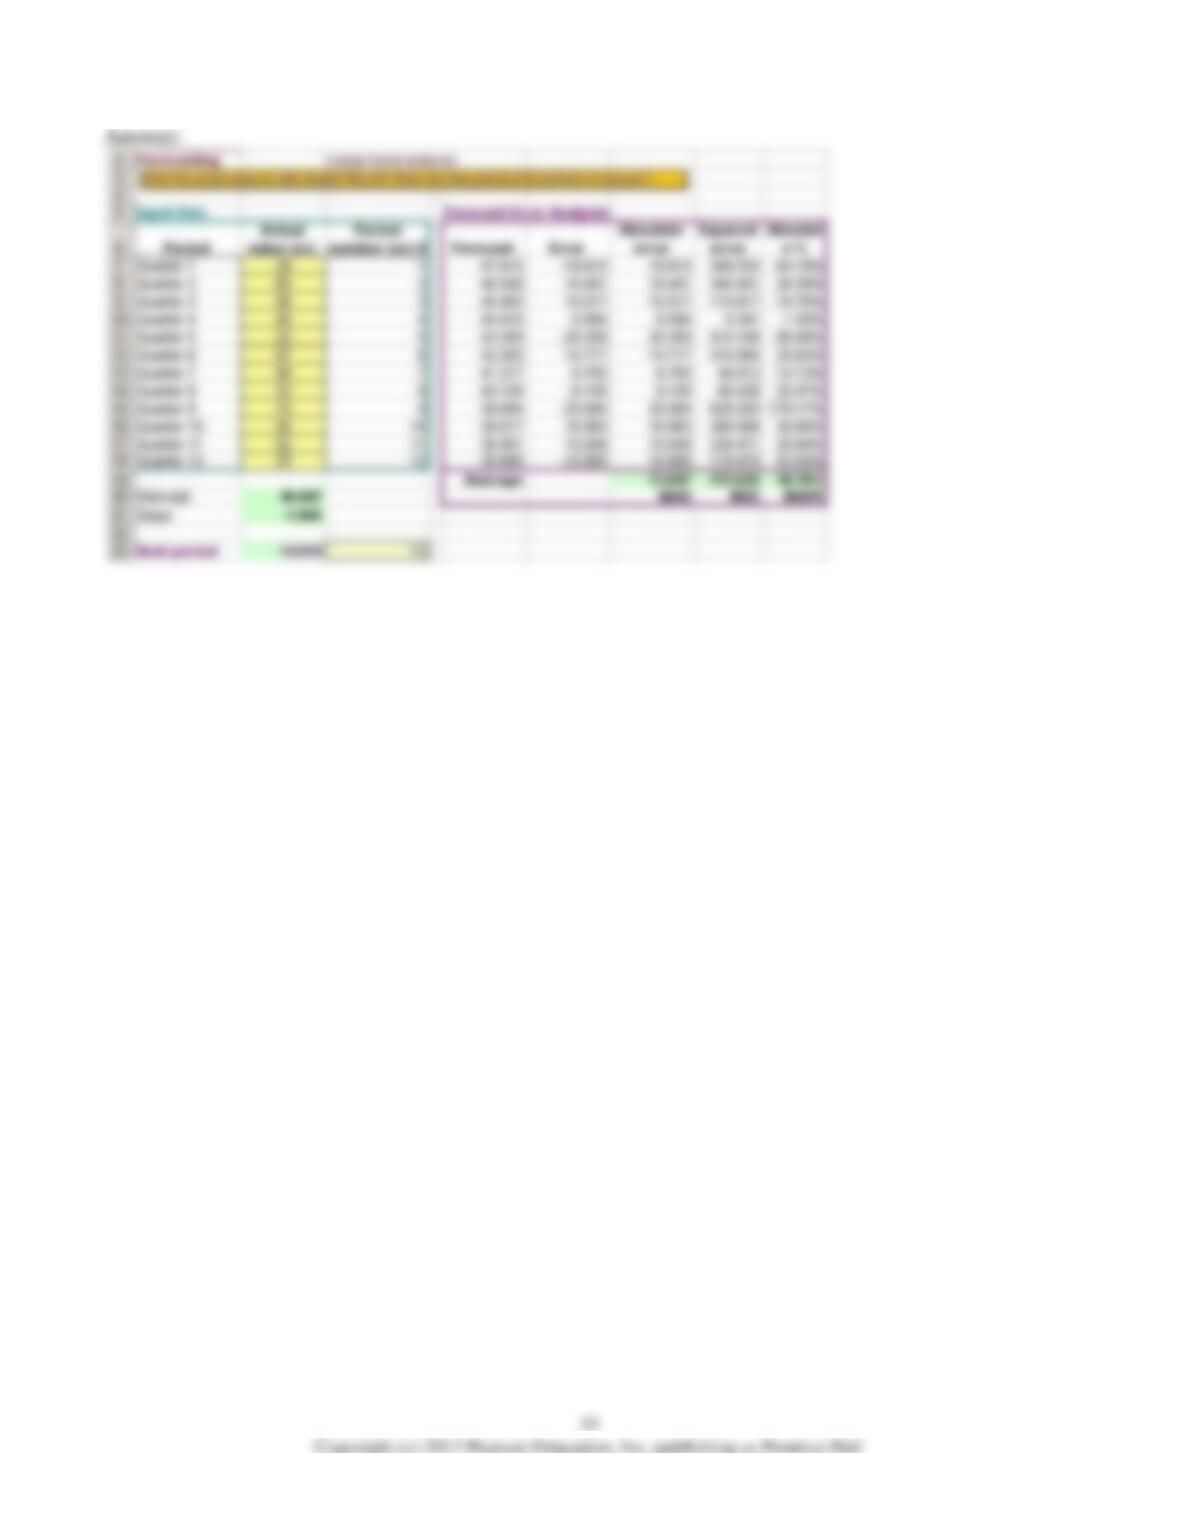
24) Refer to the table above. Use a linear trend equation to forecast next quarterly sales.
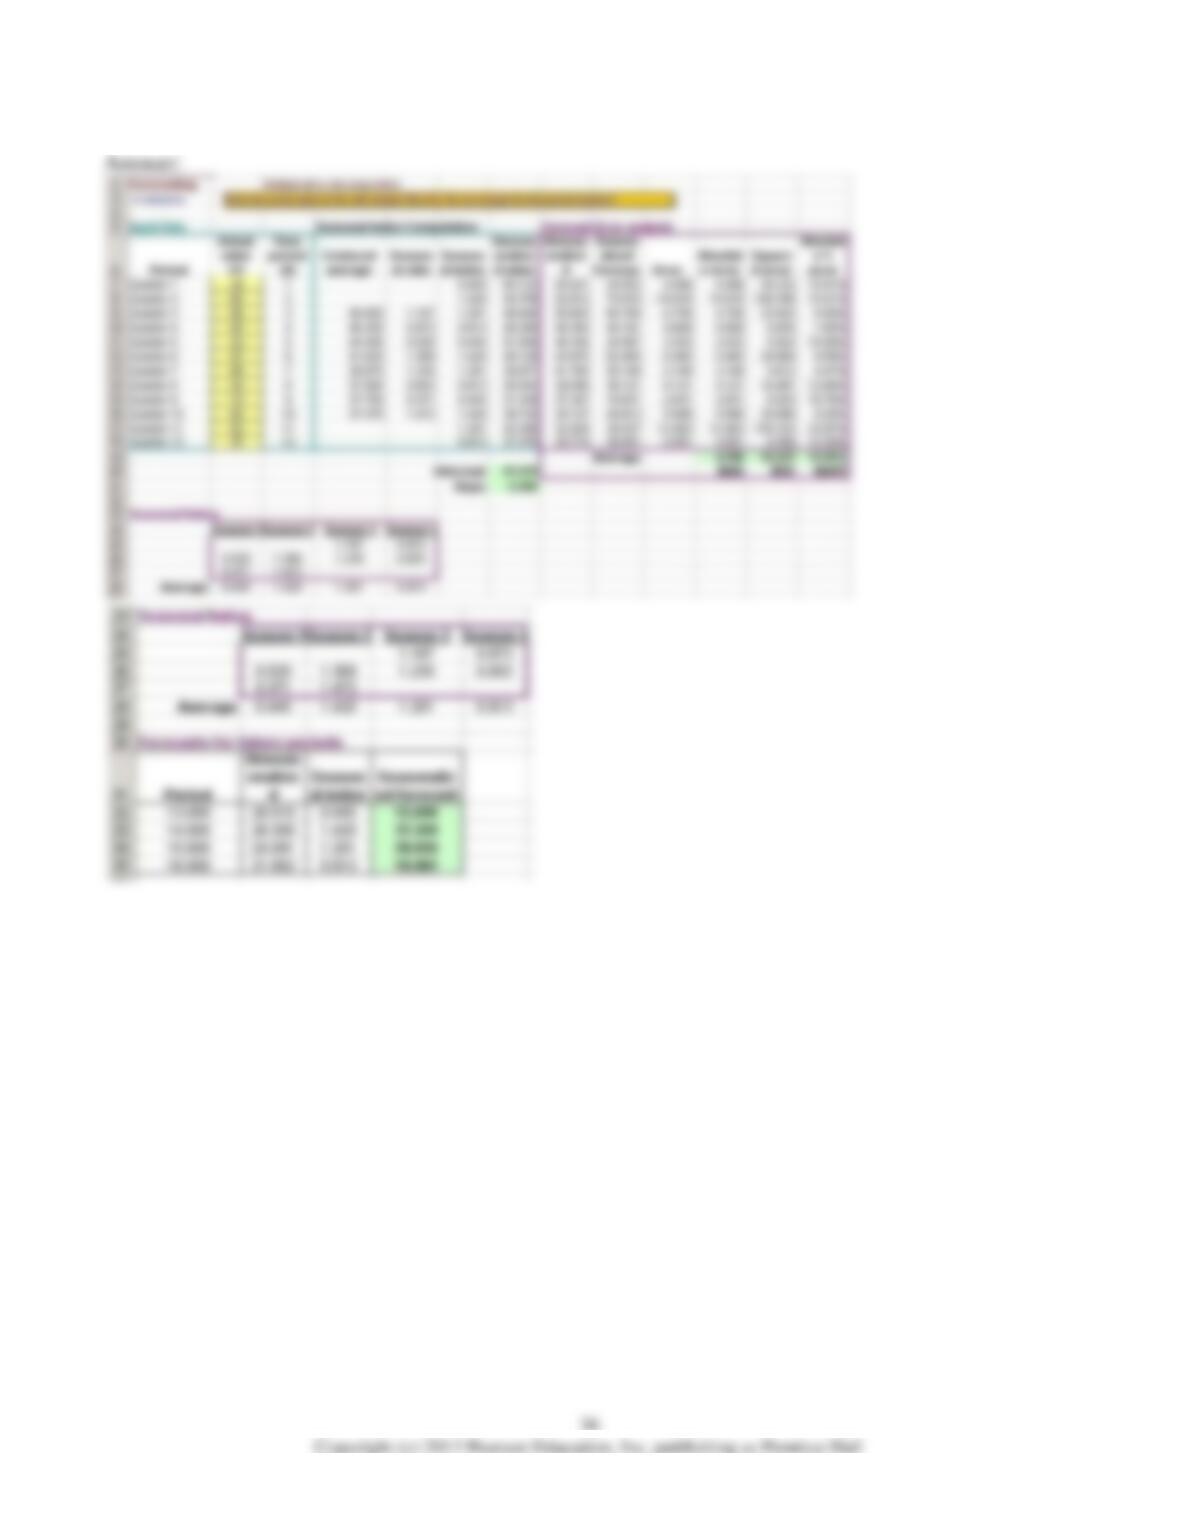
25) Refer to the table above. Using a multiplicative decomposition model, forecast the next four
quarterly sales data.
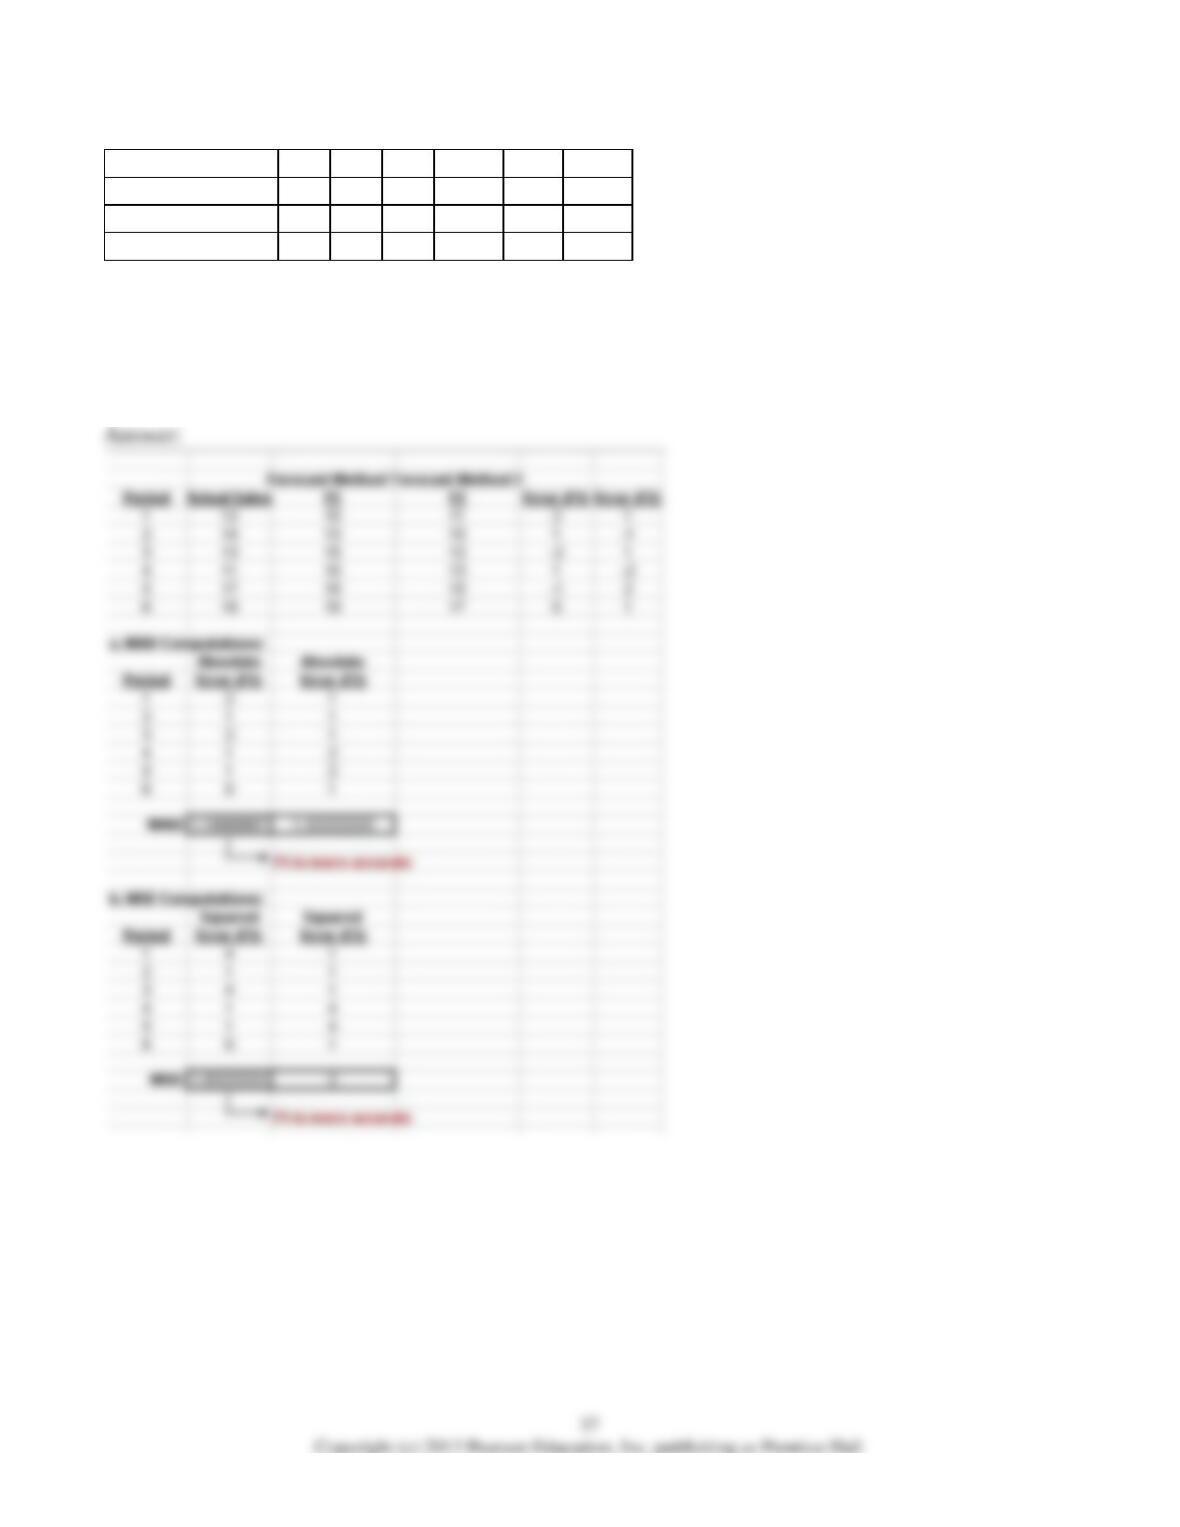
26) Two different forecasting techniques (F1 and F2) were used to forecast sales. Actual sales and the
two sets of forecasts are as follows:
Period
1
2
3
4
5
6
Actual Sales
12
14
13
11
17
18
F1
10
13
15
10
18
18
F2
11
15
12
13
15
17
a. Compute MAD for each forecasting technique. Which forecasting technique is more accurate based
on the MAD criterion?
b. Compute the MSE for each set of forecasts. Which forecasting technique is more accurate based on
the MSE criterion?
Use this information to answer the following questions.
Joe Smith operates an ice cream shop and works only three days a week. The number of ice cream
cones that he sells is shown as follows.
Friday
100
114
110
115
112
Saturday
130
135
140
145
142
Sunday
60
65
55
50
63
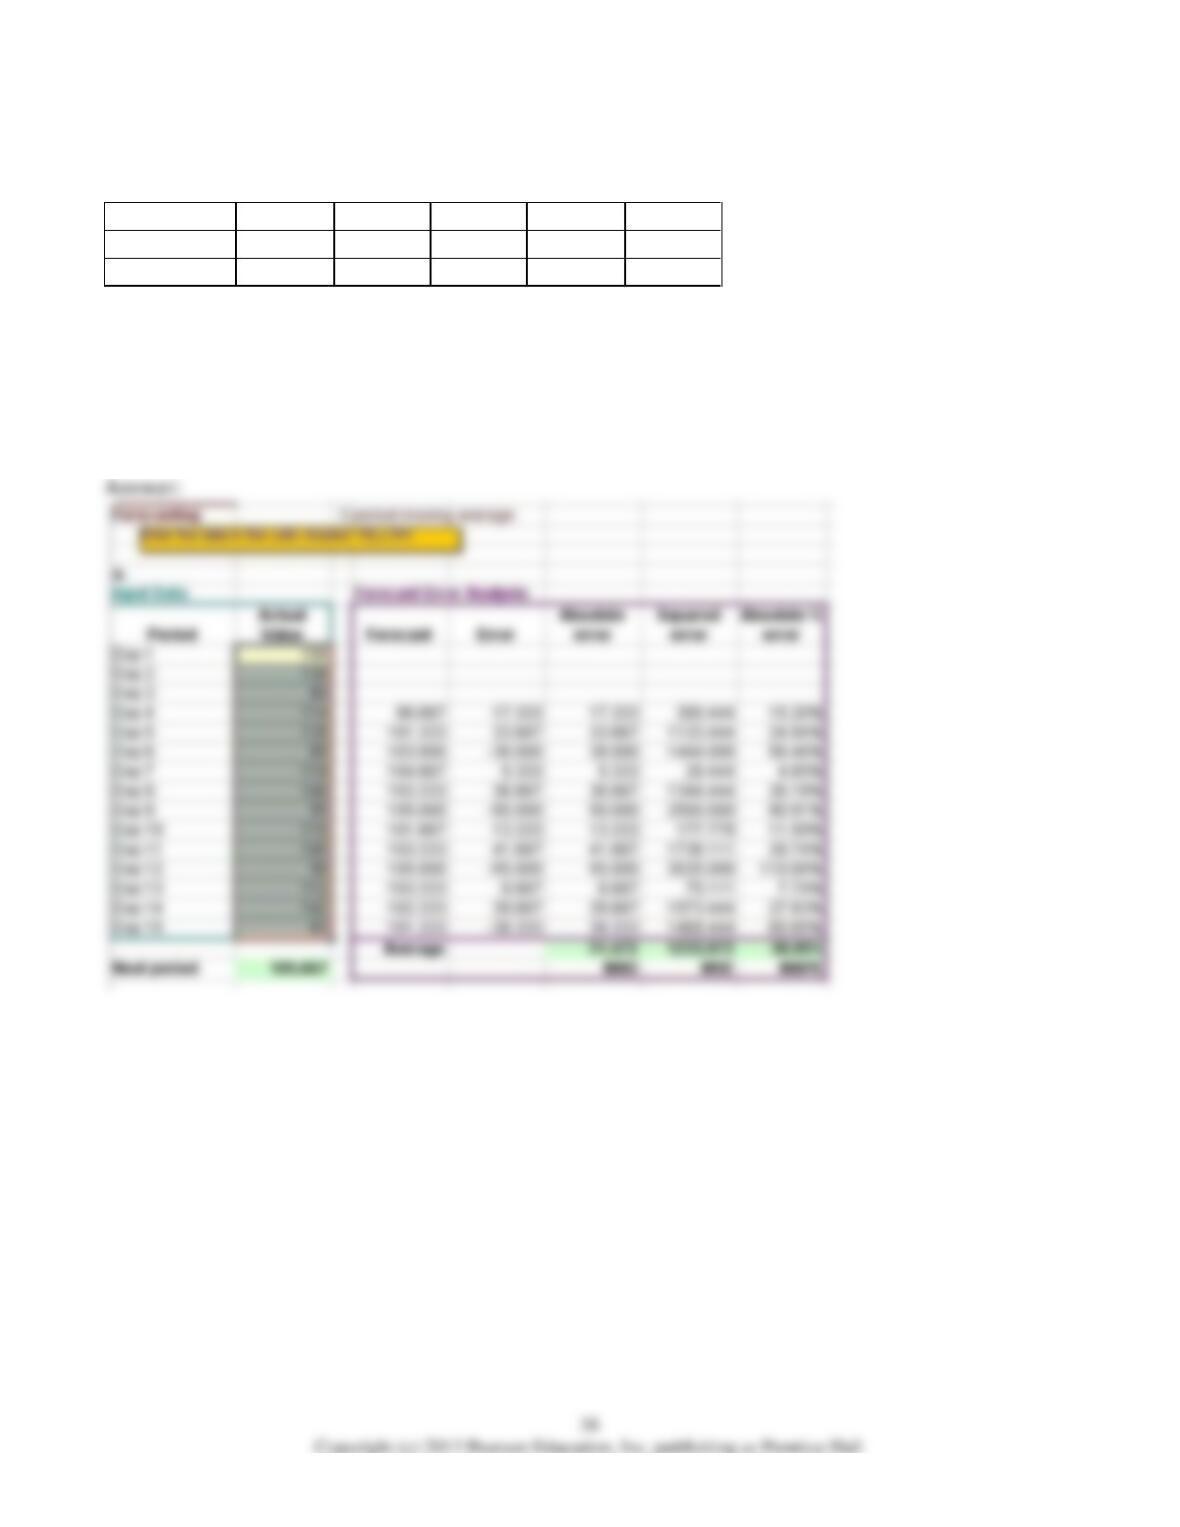
27) Refer to the table above.
a. Use a 3-period moving average to forecast next day’s sales.
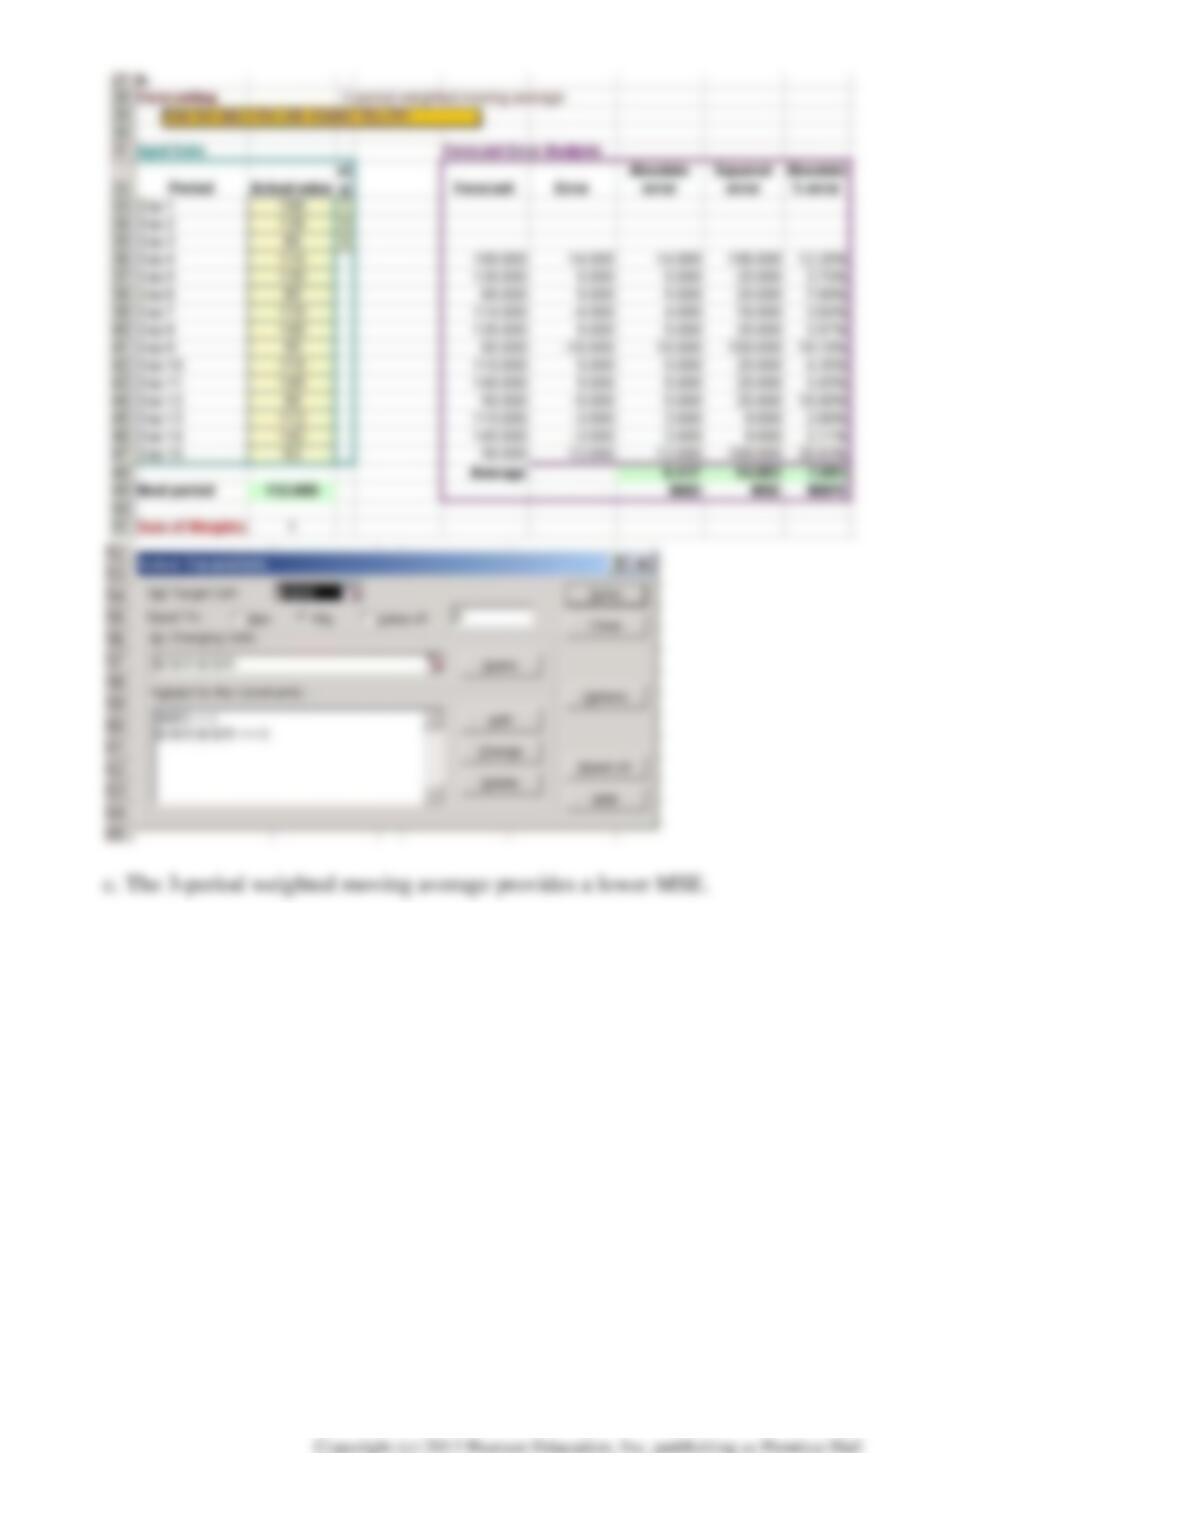
b. Use a 3-period weighted moving average to forecast next day’s sales. Use Solver to determine the
optimal weights.
c. Which one of the above forecasting techniques provides a lower MSE?
39
28) Refer to the table above.
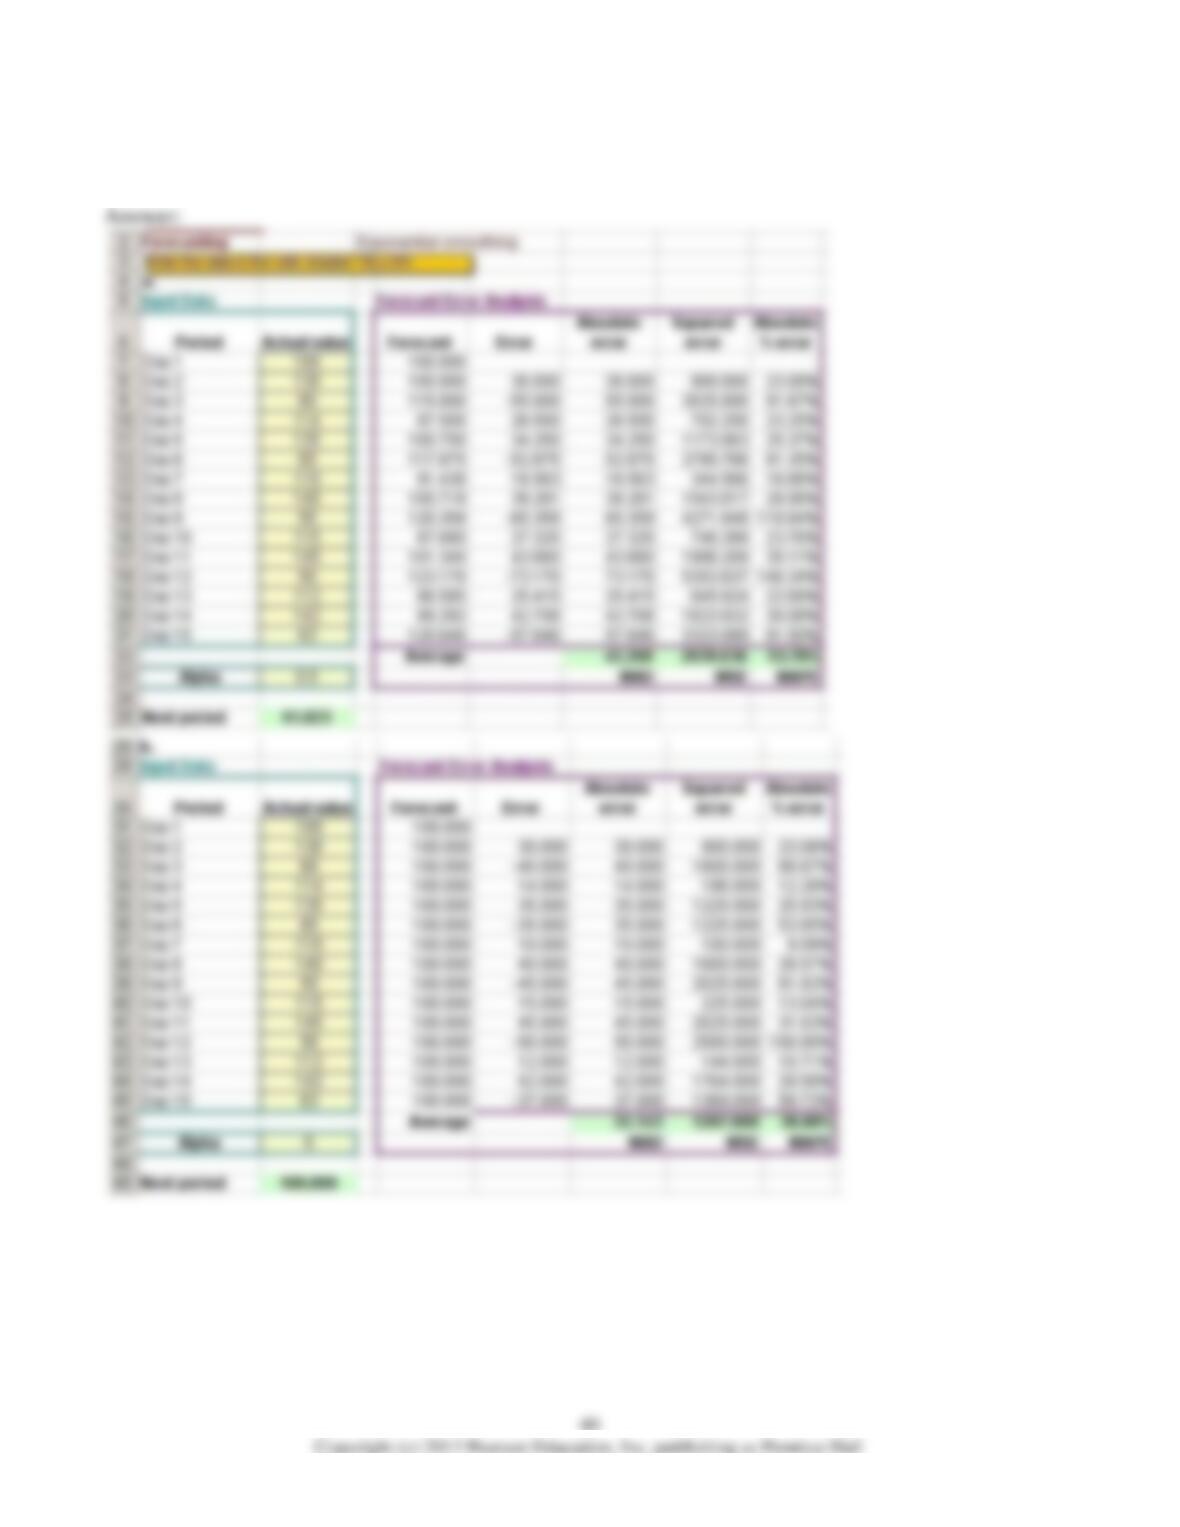
a. Use exponential smoothing with an alpha value of 0.5 to forecast next day’s sales.
b. Use Solver to determine the optimal alpha value that minimizes MSE. Forecast next day’s sales using
this optimal alpha value.
29) Refer to the table above. Use a linear trend line to forecast ice cream sales for the next three days.
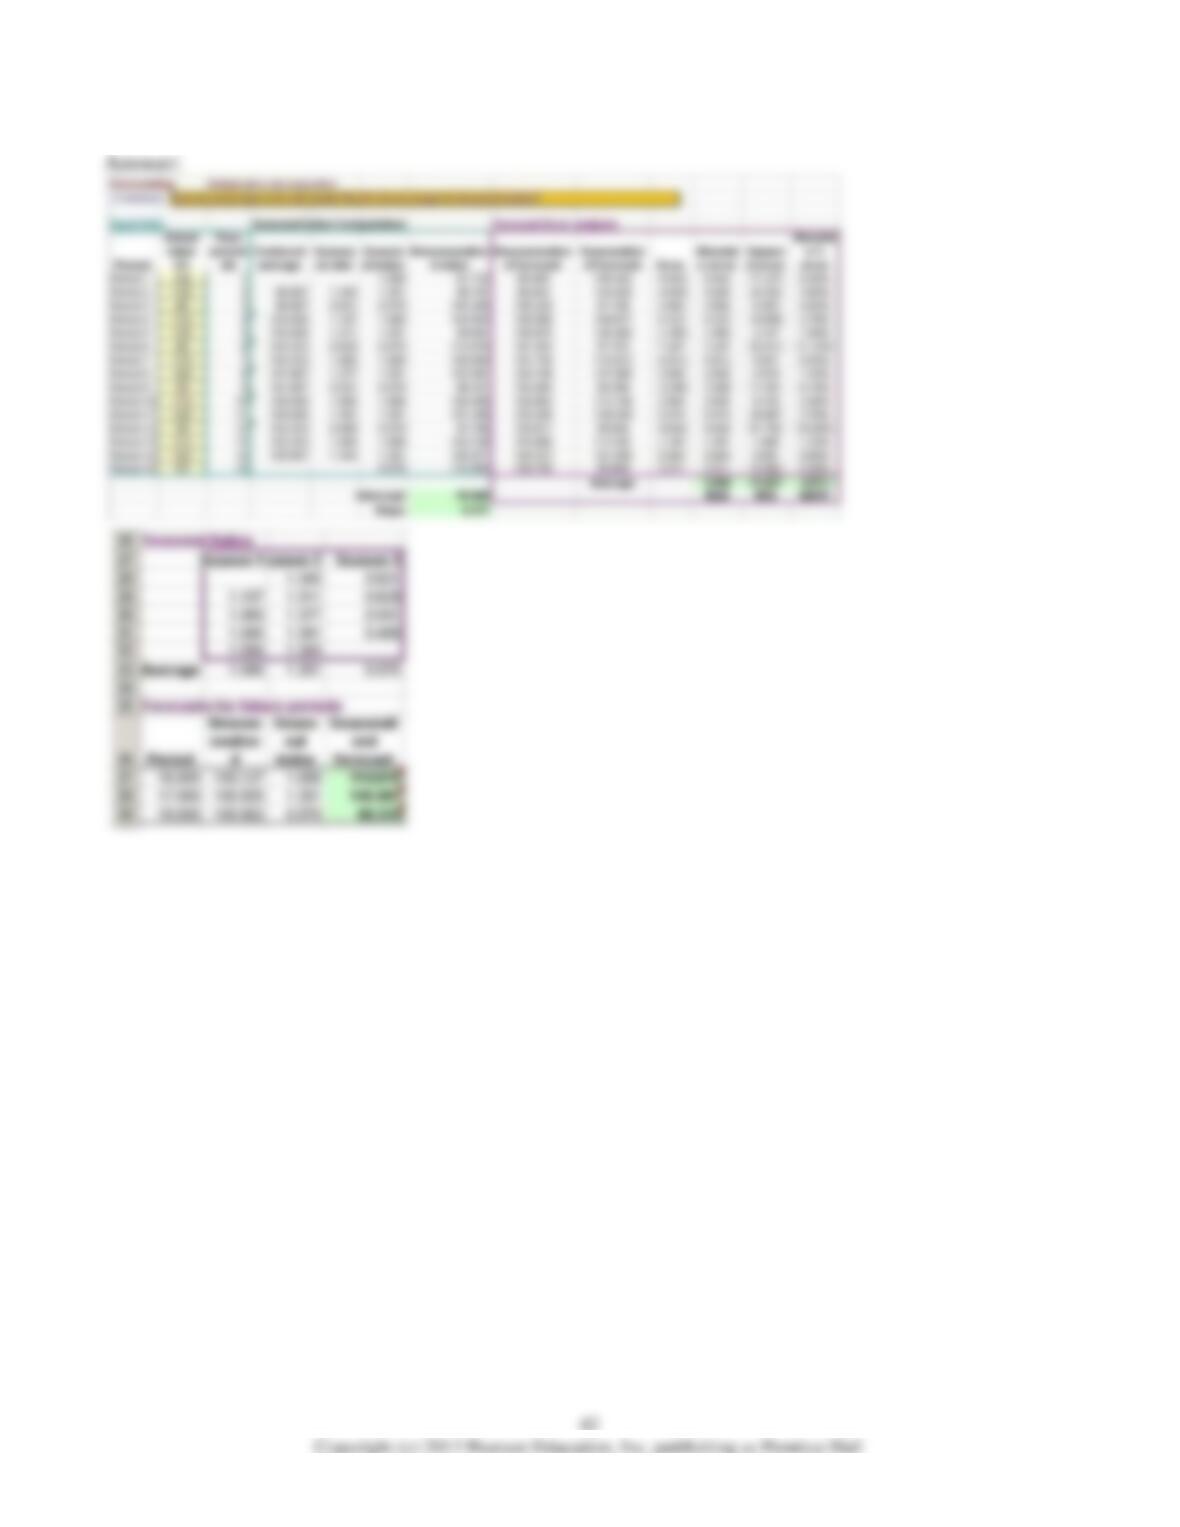
30) Refer to the table above. Using a multiplicative decomposition model, forecast ice cream sales for
the next three days.
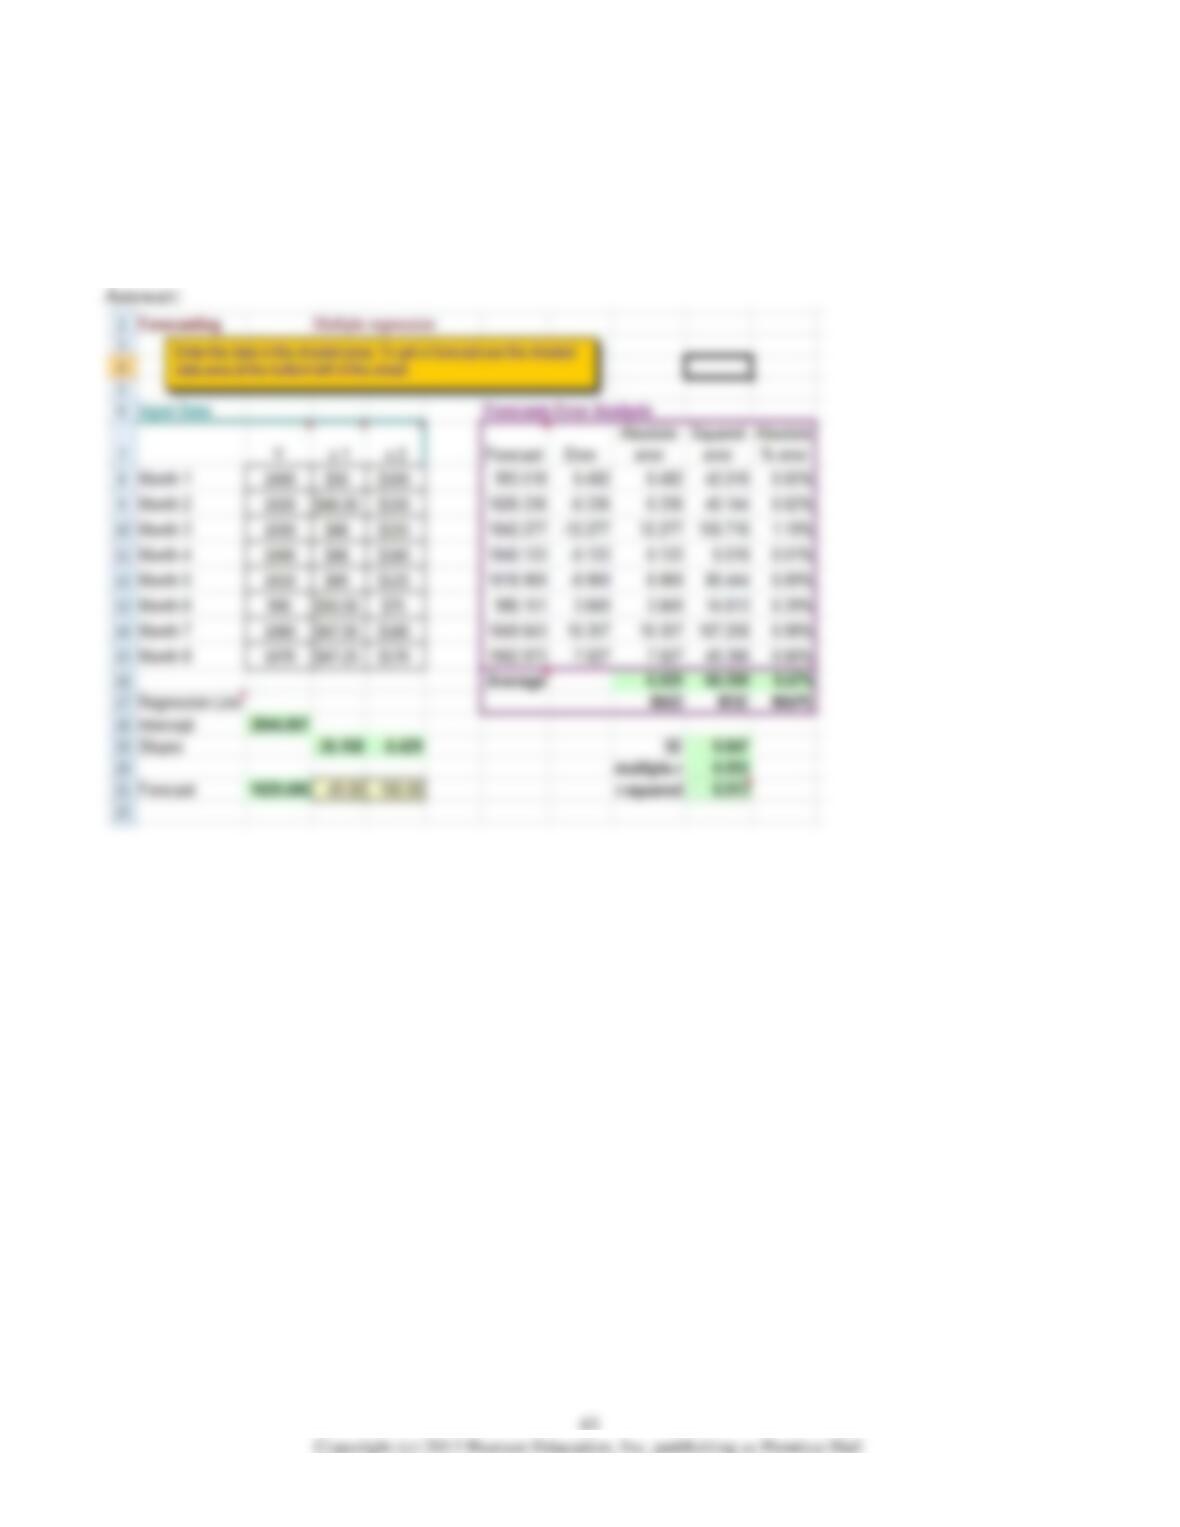
31) The data below represents demand, selling price, and advertising expenditures for an electronics
item.
a. Develop a multiple regression model to predict monthly demand.
b. What is the R-squared on this model?
c. Based on the model developed in part a, what would be the predicted monthly demand if the price of
the item is set to $49 and $100 is spent on advertising?