Unlock document.
This document is partially blurred.
Unlock all pages and 1 million more documents.
Get Access
OM5 C11
Test Bank
1
Chapter 11—Forecasting and Demand Planning
Multiple Choice
1. _____ forecasts are needed to plan workforce levels, allocate budgets among divisions, and
schedule jobs and resources.
a.
Long-range
b.
Intermediate-range
c.
Short-range
d.
Demand planning
2. _____ forecasts are necessary to plan for facility expansion.
a.
Long-range
b.
Intermediate-range
c.
Short-range
d.
Demand planning
3. _____ forecasts are needed for planning production schedules and to assign workers to jobs.
a.
Long-range
b.
Intermediate-range
c.
Short-range
d.
Demand planning
4. Which of the following is NOT a characteristic of a time series?
a.
Time bucket
b.
Trend
c.
Cyclical pattern
d.
Random variation
5. A(n) _____ is a one-time variation that is explainable.
a.
cyclical pattern
b.
random variation
c.
irregular variation
d.
seasonal variation
6. Repeatable periods of ups and downs over short periods of time are called _____.
a.
trends
b.
seasonal patterns
OM5 C11
Test Bank
2
c.
cyclical patterns
d.
irregular variations
7. Regular patterns in a data series that take place over long periods of time are called _____.
a.
trends
b.
seasonal patterns
c.
cyclical patterns
d.
irregular variations
For Questions #8 to #10
Using the data shown below in Table 1, compute the mean square error, mean absolute deviation,
and mean absolute percentage error for the forecasts shown and then answer Multiple Choice
Questions #8 to #10.
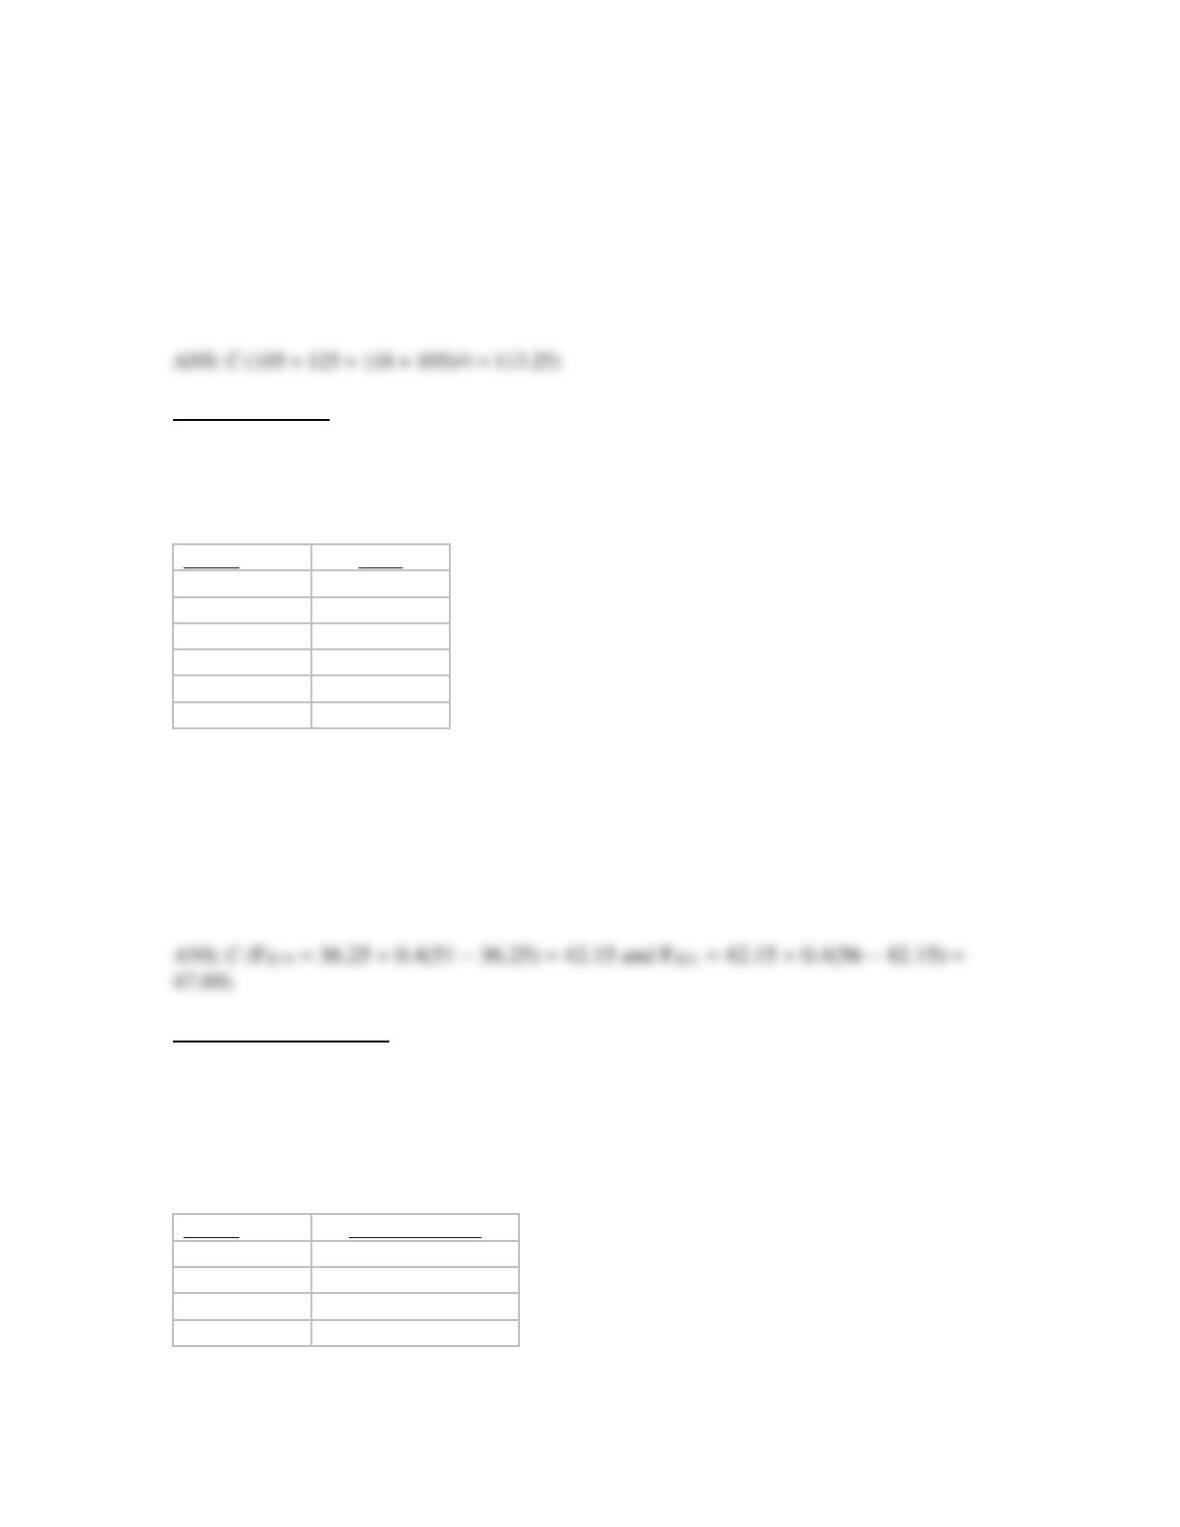
Table 1
Month
Forecast Demand
Actual Demand
April
170
180
May
225
200
June
210
200
July
260
240
August
200
230
8. The mean squared error (MSE) is:
a. less than or equal to 300.
b. more than 300 but less than or equal to 350.
c. more than 350 but less than or equal to 400.
d. more than 400 but less than or equal to 450.
9. The mean absolute deviation (MAD) is:
a. less than or equal to 20.
b. more than 20 but less than or equal to 30.
c. more than 30 but less than or equal to 40.
d. more than 40 but less than or equal to 50.
10. The mean absolute percentage error (MAPE) is:
a. less than or equal to 5%.
b. more than 5% but less than or equal to 10%.
OM5 C11
Test Bank
3
c. more than 10% but less than or equal to 15%.
d. more than 15% but less than or equal to 20%.
For Question #11 to #13
Using the sales data on a particular model of a DVD player shown below in Table 2, answer
questions #11 to #13.
Table 2
Month
Sales
Forecast 1
Forecast 2
Jan
35
30
33
Feb
29
28
32
Mar
39
43
35
Apr
42
40
45
May
51
48
52
Jun
56
55
52
11. The mean absolute deviation (MAD) for forecast 1 is:
a. less than or equal to 2.0.
b. more than 2.0 but less than or equal to 2.5.
c. more than 2.5 but less than or equal to 3.0.
d. more than 3.0 but less than or equal to 3.5.
12. The mean absolute deviation (MAD) for forecast 2 is:
a. less than or equal to 2.0.
b. more than 2.0 but less than or equal to 2.5.
c. more than 2.5 but less than or equal to 3.0.
d. more than 3.0 but less than or equal to 3.5.
13. For the data in Table 2, which forecast is better using the mean absolute deviation (MAD)
criterion given in the answer #11 and #12?
a. Forecast 1
b. Forecast 2
c. Forecast 1 and 2 are identical, with equal MADs
d. Neither forecast 1 nor forecast 2
Work sheet for Question #11 to #13
Month
Sales
Absolute Error, Forecast 1
Absolute Error, Forecast 2
Jan
35
5
2
OM5 C11
Test Bank
Feb
29
1
3
Mar
39
4
4
Apr
42
2
3
May
51
3
1
Jun
56
1
4
14. The forecasting error measurement that eliminates the measurement scale factor is the _____.
a.
mean square error (MSE)
b.
mean absolute deviation (MAD)
c.
root mean square error (RMSE)
d.
mean absolute percentage error(MAPE)
15. All of the following are important concepts in forecasting EXCEPT:
a.
determining the planning horizon length.
b.
determining the time bucket size (i.e., year, quarter, month, week, day, etc.).
c.
determining a relationship between a single dependent variable and one or more
independent variables.
d.
identifying cyclical patterns.
For Questions #16 to #18
Using the data shown below in Table 3 for the sales of a new CD at a store for the last 4 weeks,
answer the questions from #16 to #18.
Table 3
Week
1
2
3
4
Sales
112
105
125
118
16. The three-period moving average for the next week (week 5) is:
a. less than or equal to 100.
b. more than 100 but less than or equal to 110.
c. more than 110 but less than or equal to 120.
d. more than 120 but less than or equal to 130.
17. The four-period moving average for next week (week 5) is:
a. less than or equal to 100.
b. more than 100 but less than or equal to 110.
c. more than 110 but less than or equal to 120.
d. more than 120 but less than or equal to 130.
OM5 C11
Test Bank
5
18. The actual sales for week 5 were 105 units. The four-period moving average forecast for week
6 is:
a. less than or equal to 100.
b. more than 100 but less than or equal to 110.
c. more than 110 but less than or equal to 120.
d. more than 120 but less than or equal to 130.
For Question #19
Using the sales data on a particular model of a DVD player shown below in Table 4, answer
question #19.
Table 4
Month
Sales
Jan
35
Feb
29
Mar
39
Apr
42
May
51
Jun
56
19. The sales forecast for July using the data in Table 4, forecasts sales for May as 36.25, and a
simple exponential smoothing model with a smoothing constant of 0.40 is:
a. less than or equal to 35.
b. more than 35 but less than or equal to 40.
c. more than 40 but less than or equal to 50.
d. more than 50 but less than or equal to 55.
For Question #20 to #22
Based on the information shown below in Table 5, develop a forecast for June using both the two-
period moving average model and the exponential smoothing model with α = 0.10. For the
exponential smoothing model, assume the forecast for February is 800. Answer questions #20 to
#22.
Table 5
Month
Actual Demand
February
850
March
900
April
975
May
950
OM5 C11
Test Bank
6
20. The 2-period moving average forecast for June is:
a. less than or equal to 940.
b. more than 940 but less than or equal to 950.
c. more than 950 but less than or equal to 960.
d. more than or equal to 960.
21. The exponential smoothing model forecast for March is:
a. less than or equal to 840.
b. more than 840 but less than or equal to 850.
c. more than 850 but less than or equal to 860.
d. more than 870 but less than or equal to 880.
22. The exponential smoothing model forecast for June is _____.
a. less than or equal to 840
b. more than 840 but less than or equal to 850
c. more than 850 but less than or equal to 860
d. more than 870 but less than or equal to 880
23. Which of the following is NOT a statistical forecasting method?
a.
Delphi
b.
Exponential smoothing
c.
Moving average
d.
Linear regression
24. A moving average model works best when _____ in the time series.
a.
only irregular variation is present
b.
only a trend is present
c.
there is no trend, seasonal, or cyclical pattern
d.
trend, seasonal, and cyclical patterns exist
25. The forecasting technique that works best for short planning horizons is _____.
a.
regression
b.
moving average
c.
mean absolute percentage error (MAPE)
d.
Delphi
OM5 C11
Test Bank
7
26. Which of the following statements is TRUE about exponential smoothing technique?
a.
It uses a weighted average of past time-series values.
b.
It includes seasonal effects.
c.
It has the typical values of alpha in the range of 0.6 to 0.9.
d.
It will not overshoot the actual values if a negative trend exists.
27. A seven-month simple moving average would approximately equate with alpha (α) factor
_____ for simple exponential smoothing.
a. less than or equal to 0.10
b. more than 0.10 but less than or equal to 0.15
c. more than 0.15 but less than or equal to 0.20
d. more than 0.20 but less than or equal to 0.25
28. Which of the following statements is TRUE about single exponential smoothing?
a.
Large values of alpha (α) place more emphasis on recent data.
b.
α values range from 0.6 to 1.
c.
Smaller values of smoothing constant have the advantage of quickly adjusting the forecasts when
forecasting errors occur.
d.
Larger values of smoothing constant do not allow the forecast to react faster to changing conditions.
29. Which is NOT true regarding simple exponential smoothing?
a.
It forecasts the value of the time series in the next period
b.
It has a smoothing constant ranging between 0 and 1.
c.
It uses a weighted average of past time-series values.
d.
It includes trend or seasonal effects.
30. Which of the following statement is TRUE if the time series exhibits a negative trend in an
exponential smoothing technique?
a.
The forecast will lag the actual values.
b.
The forecast will overshoot the actual values.
c.
The mean square error will be zero.
d.
The alpha value will be one.
For Question #31 and #32
A Taiwan electronics company exports personal computers (PCs) to the U.S. Their PC sales (in
OM5 C11
Test Bank
8
thousands) over the past five years are given below in Table 6.
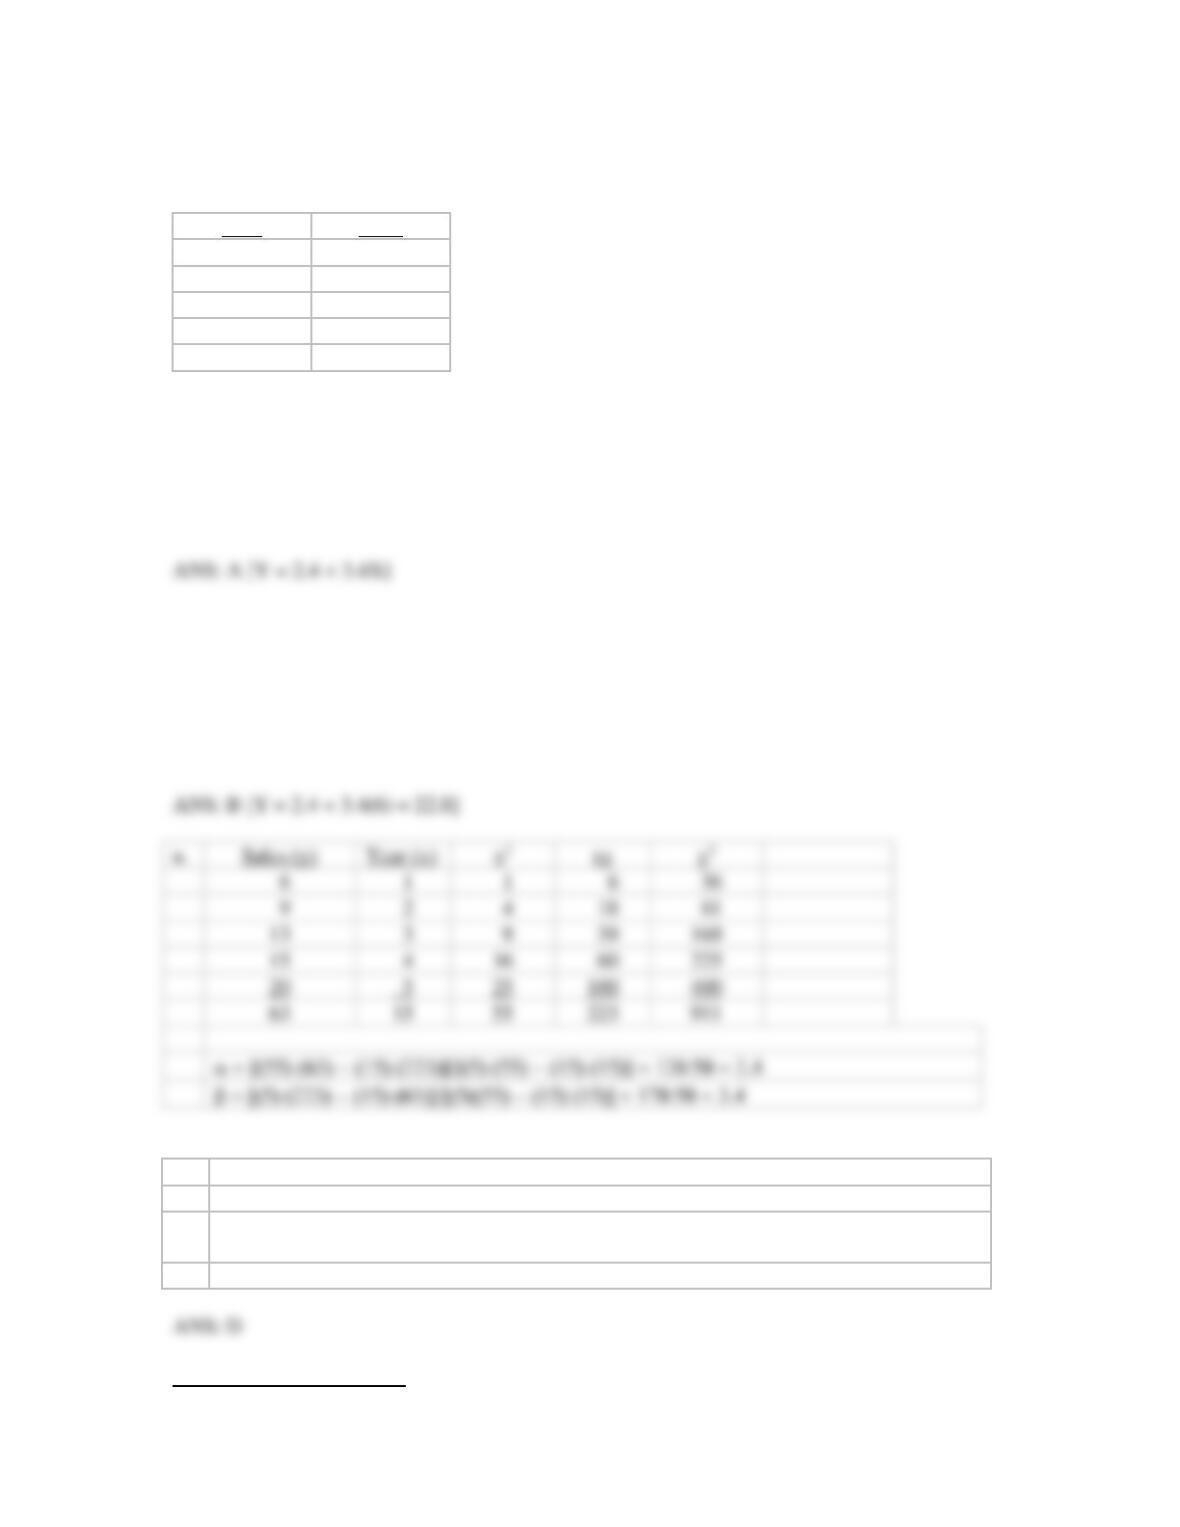
Table 6
Year
Sales
1
6
2
9
3
13
4
15
5
20
31. The simple regression intercept (a) and the slope (b) for the data in Table 6 is:
a. Y = 2.4 + 3.4X.
b. Y = 2.8 + 4.4X.
c. Y = 2.8 + 5.4X.
d. Y = 2.4 + 4.4X.
32. Using the data in Table 6 the forecast for sales in year 6 using the simple regression equation
is:
a. less than 20.
b. more than 20 but less than or equal to 25.
c. more than 25 but less than or equal to 30.
d. more than 30 but less than or equal to 35.
33. Regression analysis:
a.
is limited to one dependent and one independent variable.
b.
is best with nonlinear relationships.
c.
maximizes the sum of the squared deviations between the actual time-series value and
the estimated values of the dependent variable.
d.
can be used with time as the independent variable.
For Question #34 and #35
OM5 C11
Test Bank
The manager of a gas station along an interstate highway has observed that gasoline sales
generally increase each week over the summer months as more families travel by car on vacations.
He also believes that sales are sensitive to fluctuations in the price of gasoline. He developed the
following regression model:
Sales ($) = $59,407 + $509 (Week) + 16,463 (Price/gallon)
34. Which one of the following statements is TRUE?
a. Sales decrease as a function of time.
b. A $0.10 increase in the price of gas reduces weekly sales by 1,646 gallons.
c. As the price of a gallon of gas increases, sales increase.
d. None of the above is true.
35. The sales forecast for the 11th week of the summer if the price per gallon is estimated to be
$3.00 is:
a. less than or equal to 15,000.
b. more than 15,000 but less than or equal to 15,500.
c. more than 15,500 but less than or equal to 16,000.
d. more than 16,000 but less than or equal to 16,500.
36. An R2 of 0.80 means:
a.
80% of the variability in the independent variable is explained by the dependent variable.
b.
80% of the variability in the dependent variable is explained by the independent variable.
c.
80% of the variability in the dependent variable is not explained by the independent
variable.
d.
Multiple regression is used.
37. Which of the following statements does NOT fit with the Delphi method?
a.
Judgments and opinions of experts is gathered.
b.
Group of people from only inside the organization are asked to make predictions.
c.
Process iterates until a consensus is reached.
d.
It is a complex approach in judgmental forecasting.
38. Which of the following is NOT a valid approach to gather data for judgmental forecasting?
a.
Questionnaire
b.
Telephone contact
c.
Personal interview
d.
Company records

39. All of the following are important criteria in choosing a forecasting method EXCEPT:
a.
the smoothing constant (α).
b.
the time span for which the forecast is made.
c.
the data requirements.
d.
the quantitative skills needed.
40. A tracking signal provides a method for monitoring a forecast by quantifying _____.
a.
bias
b.
error
c.
accuracy
d.
outliers
41. A group of international experts published a set of principles of forecasting that includes all of
the following EXCEPT:
a.
use quantitative rather than qualitative methods.
b.
combine forecasts from approaches that are similar.
c.
ask experts to justify their forecasts in writing.
d.
use multiple measures of forecast accuracy.
True/False Questions
1. Better operational decisions can be made by integrating forecasting with value chain and
capacity management systems.
2. Top managers need small-range forecasts of unit sales for individual products (e.g., brands and
sizes), for decisions involving financial planning, and for sizing and locating new facilities.
3. Long-range forecasts expressed in sales dollars are more meaningful to top managers than to
managers at the operations level.
4. An alternate name for planning horizon is time bucket.
5. A long-range forecast typically covers a planning horizon of 3 to 12 months.

11
6. Random variation is the unexplained deviation of a time series from a predictable pattern, such
as a trend, seasonal, or cyclical pattern.
7. Trends are characterized by repeatable periods of ups and downs over short periods of time.
8. Seasonal patterns can occur over the weeks during a month, over days during a week, or hours
during a day.
9. Forecasts are never 100% accurate because of random variations.
10. In forecasting, irregular variation that is explainable can normally be discarded.
11. Irregular variation and random variation both refer to unexplainable deviation of a time series
from a predictable pattern.
12. Mean absolute deviation (MAD), mean square error (MSE), and mean absolute percentage
error (MAPE) forecast error metrics generally giving similar numerical results so it does not
matter which one is used.
13. A major difference between mean square error (MSE) and mean absolute deviation (MAD) is
that MAD is influenced much more by large forecast errors than by small errors.
14. The values of mean absolute deviation (MAD) and mean square error (MSE) depend on the
measurement scale of the time-series data.
15. Statistical forecasting is based upon the assumption that the future will be an extrapolation of
the past.
16. A single moving average is most appropriate for data with identifiable trends.

OM5 C11
Test Bank
17. As the value of k is increased in a moving average forecasting model, the forecast reacts more
slowly to recent changes in the time series.
18. Single exponential smoothing is a forecasting technique that uses a weighted average of past
time-series values to forecast the value of the time series in the next period.
19. The smoothing constant, α, used in the basic exponential smoothing model, can range in value
from −1 to +1.
20. Exponential smoothing models never forget past data as long as the smoothing constant is
strictly between 0 and 1. In contrast, moving average methods completely forget all data older
than k periods in the past.
21. In an exponential smoothing model, larger values of alpha (i.e., closer to 1) place less
emphasis on recent data.
22. In a regression model, both the dependent and independent variables must be numerical.
23. An exponential smoothing model can be found easily by applying Excel’s Add Trendline
option to a time series.
24. The method of least squares maximizes the sum of the squared deviations between the actual
time-series values and the estimated values of the dependent variable.
25. An R2 of 0.70 mean 30% of the variability in the dependent variable was explained by the
independent variable.
26. Regression models are often used in forecasting to incorporate causal variables that may
influence a time series.


