Chapter 11—Multiple Regression
MULTIPLE CHOICE QUESTIONS
11.1 The difference between multiple regression and simple regression is that
11.2+ Assume that we generated a prediction just by adding together the number of
stressful events you report experiencing over the last month, the number of close
friends you have, and your score on a measure assessing how much control you
feel you have over events in your life (i.e., prediction = stress + friends + control).
The regression coefficient for stressful events would be
11.3+ In the previous question the intercept would be
11.4 In multiple regression the intercept is usually denoted as
11.5+ Given the following regression equation (
Y
ˆ
= 3.5 X1 + 2X2 + 12), the coefficient
for X1 would mean that
11.6+ In the previous question, a student who scored 0 on both X1 and X2 would be
expected to have a dependent variable score of
Chapter 11
293
11.7 If one independent variable has a larger coefficient than another, this means
11.8 If we want to compare the contribution of several predictors to the prediction of a
dependent variable, we can get at least a rough idea by comparing
11.9+ When we speak of the correlations among the independent variables, we are
speaking of
11.10 Before running a multiple regression, it is smart to look at the distribution of each
variable. We do this because
11.11 In multiple regression an outlier is one that
11.12+ If you have a number of scores that are outliers you should
Test Bank
294
11.13 If we have three predictors and they are all individually correlated with the
dependent variable, we know that
11.14+ If two variables are each correlated significantly with the dependent variable, then
the multiple correlation will be
11.15 The multiple correlation of several variables with a dependent variable is
11.16 In simple correlation a squared correlation coefficient tells us the percentage of
variability in Y associated with variability in X. In multiple regression, the
squared multiple correlation coefficient
11.17+ If two variables taken together account for 65% of the variability in Y, and a third
variable has a simple squared correlation with Y of .10, then adding that variable
to the equation will allow us to account for
11.18+ If our regression equation is
ˆ
Y
= 0.75
age + 0.50
experience – 0.10
grade
point average – 2.0, and if our first subject had scores of 16, 4, and 3.0 on those
three variables, respectively, then that subject’s predicted score would be
Chapter 11
11.19 Suppose that in the previous question another subject had a predicted score of
10.3, and actually obtained a score of 12.4. For this subject the residual score
would be
11.20 If we find all of the residuals when predicting our obtained values of Y from the
regression equation, the sum of squared residuals would be expected to be
_______ the sum of the squared residuals for a new set of data.
11.21+ If the multiple correlation is high, we would expect to have _______ residuals
than if the multiple correlation is low.
11.22 If we predict anxiety from stress and intrusive thoughts, and if the multiple
regression is significant, that means that
11.23+ When testing null hypotheses about multiple regression we
11.24 The statistical tests on regression coefficients are usually
Test Bank
296
11.25+ If we know that a regression coefficient is statistically significant, we know that
11.26 In an example in Chapter 10 we found that the relationship between how a student
evaluated a course, and that student’s expected grade was significant. In this
chapter Grade was not a significant predictor. The difference is
11.27 The Analysis of Variance section in computer results for multiple regression
11.28 If the overall analysis of variance is NOT significant
11.29+ If you drop a predictor from the regression equation
11.30 Many of the procedures for finding an optimal regression equation (whatever that
means) are known as
11.31+ The text generally recommended against formal procedures for finding an optimal
regression procedure because
Chapter 11
297
11.32 The example in Chapter 11 of predicting weight from height and sex showed that
11.33 The example in the text predicting distress in cancer patients used distress at an
earlier time as one of the predictors. This was done
11.34 A multiple regression analysis was used to test the values of visual acuity, swing
power, and cost of clubs for predicting golf scores. The regression analysis
showed that visual acuity and swing power predicted significant amounts of the
variability in golf scores, but cost of clubs did not. What can be concluded from
these results?
11.35+ The following regression equation was found for a sample of college students.
predicted happiness = 32.8 GPA + 17.3
pocket money + 7.4
Which of the following can be concluded?
11.36 Multiple regression analysis yielded the following regression equation:
Predicted Happiness = .36
friends – .13
stress + 1.23
Which of the following is true?
Test Bank
298
11.37 We want to predict a person’s happiness from the following variables: degree of
optimism, success in school, and number of close friends. What type of statistical
test can tell us whether these variables predict a person’s happiness?
11.38 A table in which each variable is correlated with every other variable is called
TRUE/FALSE QUESTIONS
correlated with one another.
the number of delinquent peers in the social network, and parental under control,
R2 = .60. This means each of the variables accounted for 36% of the variability in
delinquent behavior.
one independent variable.
between individual independent variables and the criterion variable AND the
degree of association between the set of independent variables and the criterion
variable.
significant in a multiple regression equation predicting the same criterion
variable.
predictor and the criterion variable controlling for other predictors in the equation.
criterion variable if R is not different from 0 (i.e., if the entire model is not
significant).
Chapter 11
299
OPEN-ENDED QUESTIONS
11.49 Estimate Y based on the equation
Y
ˆ
= .75 X -.40 Z + 5 using the following
values.
a) X = 10; Z = 0
b) X = 0; Z = 0
c) X = 20; Z = 100
11.50 Based on the same formula (
Y
ˆ
= .75 X -.40 Z + 5), calculate the missing predictor
variables based on the following information.
a)
Y
ˆ
= 100; X = 0
b)
Y
ˆ
= 0; Z = -20
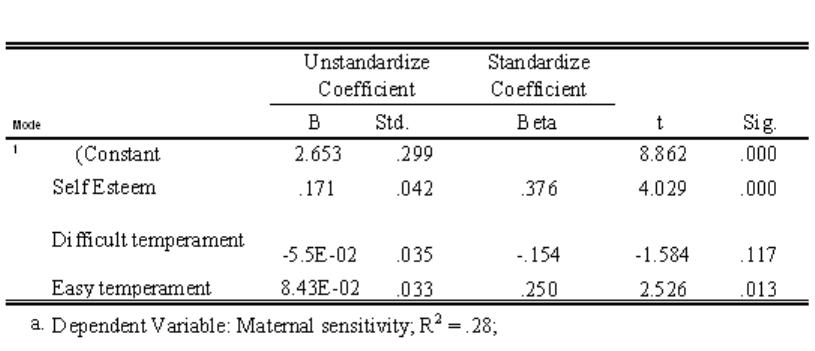
11.51 Write a sentence explaining the analysis presented in the following table (i.e.,
what are the predictor variables, what is the criterion variable).
11.52 Are the set of predictors significantly associated with maternal sensitivity?
11.53 Which individual predictors are significantly associated with maternal sensitivity?
11.54 How much variability in maternal sensitivity is accounted for by the set of
predictors?
11.55 How do the regression results vary from the simple correlations presented below?
Explain why this may be the case.

Test Bank
300
Correlation
s
.38
0
**
–.290
**
.28
4
**
–.137
–.089
–.291
**
–
Pearson
Correlation
Pearson
Correlation
Pearson
Correlation
Pearson
Correlation
1. Maternal
sensitivity
2. Self
esteem
3. Difficult
temperament
4. Easy
temperament
1.
2.
3.
4.
Correlation is significant at the 0.01
level (2-tailed).
**.
11.56 If you wanted to identify mothers who needed a parenting intervention to enhance
sensitivity and could only collect two pieces of information from each family due
to time and costs, which of the measures in the previous example would you
select? Why?
11.57 Given the information in the following table, create the corresponding regression
equation.
Coefficients
a
1.044
.220
4.749
.000
-.131
.047
-.236
-2.800
.006
.515
.080
.541
6.413
.000
(Constant)
Social support
General anxiety
Model
1
B
Std. Error
Unstandardized
Coefficients
Beta
Standardized
Coefficients
t
Sig.
Dependent Variable: Cancer anxiety
a.
11.58 Based on the previous regression equation you just created, estimate cancer
anxiety given the following values.
a) social support = 100; general anxiety = 50
b) social support = 25; general anxiety = 7
Answers to Open-ended Questions
Chapter 11
301