Page 1
1.
A _____ is an organization that produces goods or services for sale.
A)
production function
B)
firm
C)
variable input
D)
fixed input
2.
In the short run:
A)
all inputs are fixed.
B)
all inputs are variable.
C)
some inputs are fixed and some inputs are variable.
D)
all costs are variable.
3.
The _____ is the increase in output that is produced when a firm hires an additional
worker.
A)
average product
B)
total product
C)
marginal product
D)
marginal cost
4.
Lauren has 11 people working in her tangerine grove. The marginal product of the
eleventh worker is 13 bushels of tangerines. If she hires a twelfth worker, the marginal
product of that worker will be:
A)
14 bushels.
B)
15 bushels.
C)
12 bushels.
D)
The answer cannot be determined with the information available.
5.
The total product curve:
A)
shows the relation between output and the quantity of a variable input for varying
levels of the fixed input.
B)
will become flatter as output increases if there are diminishing returns to the
variable input.
C)
will be downward-sloping if there are diminishing returns to the variable input.
D)
will become horizontal when the marginal product of the variable input is constant.
Page 2
Use the following to answer questions 6-7:
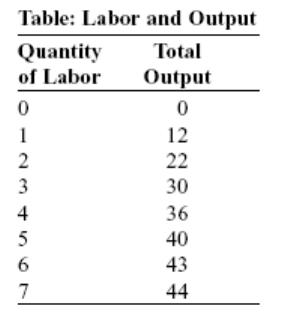
6.
(Table: Labor and Output) Look at the table Labor and Output. The marginal product of
the fifth worker is:
A)
8.
B)
4.
C)
3.
D)
40.
7.
(Table: Labor and Output) Look at the table Labor and Output. The marginal product of
the fourth worker is:
A)
9.
B)
36.
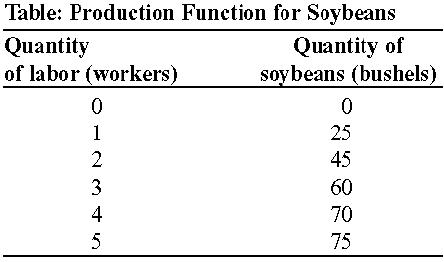
C)
10.
D)
6.
8.
The term diminishing returns refers to:
A)
a falling interest rate that can be expected as one’s investment in a single asset
increases.
B)
a reduction in profits caused by increasing output beyond the optimal point.
C)
a decrease in total output due to the firm hiring uneducated workers.
D)
a decrease in the extra output due to the use of an additional unit of a variable input
when all other inputs are held constant.
Page 3
9.
The idea of diminishing returns to an input in production suggests that if a local college
adds more custodians, the marginal product of labor for the custodial staff will:
A)
increase at an increasing rate.
B)
increase at a decreasing rate.
C)
decrease.
D)
not change.
10.
Diminishing returns to an input occur:
A)
when all inputs are fixed.
B)
when some inputs are fixed and some are variable.
C)
when all inputs are variable.
D)
only when there are no fixed inputs.
11.
If two firms are identical in all respects except that one has more of the fixed input
capital than another, the total product curve for the firm with more capital:
A)
must equal the total product curve for the firm with less capital.
B)
will lie above the total product curve for the firm with less capital.
C)
will lie below the total product curve for the firm with less capital.
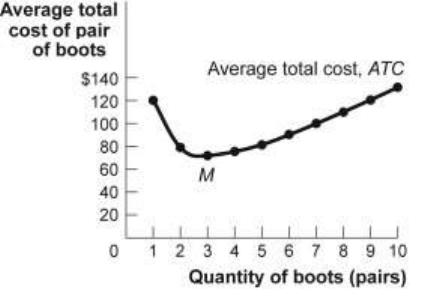
D)
will show no diminishing marginal returns.
12.
If two firms are identical in all respects except that one has more of the fixed input
capital than another, the marginal product curve for the firm with more capital:
A)
must equal the marginal product curve for the firm with less capital.
B)
will lie above the marginal product curve for the firm with less capital.
C)
will lie below the total marginal curve for the firm with less capital.
D)
will show no diminishing marginal returns.
Page 4
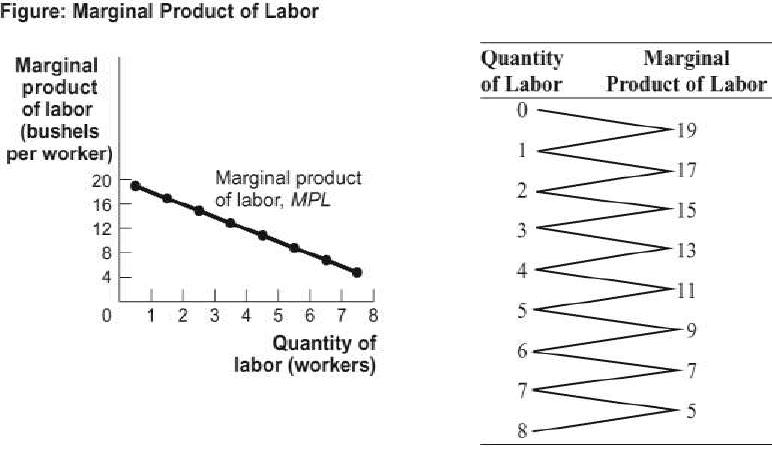
Use the following to answer questions 13-15:
13.
(Figure: Marginal Product of Labor) Look at the figure The Marginal Product of Labor.
The total product for three workers is _____ bushels.
A)
51
B)
45
C)
39
D)
15
14.
(Figure: Marginal Product of Labor) Look at the figure The Marginal Product of Labor.
The total product of labor for five workers is _____ bushels.
A)
11
B)
45
C)
55
D)
75
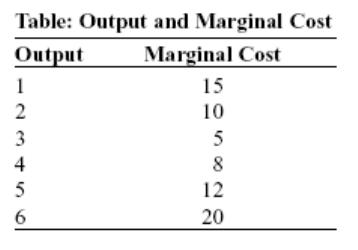
15.
(Figure: Marginal Product of Labor) Look at the figure The Marginal Product of Labor.
The total product of labor for eight workers is _____ bushels.
A)
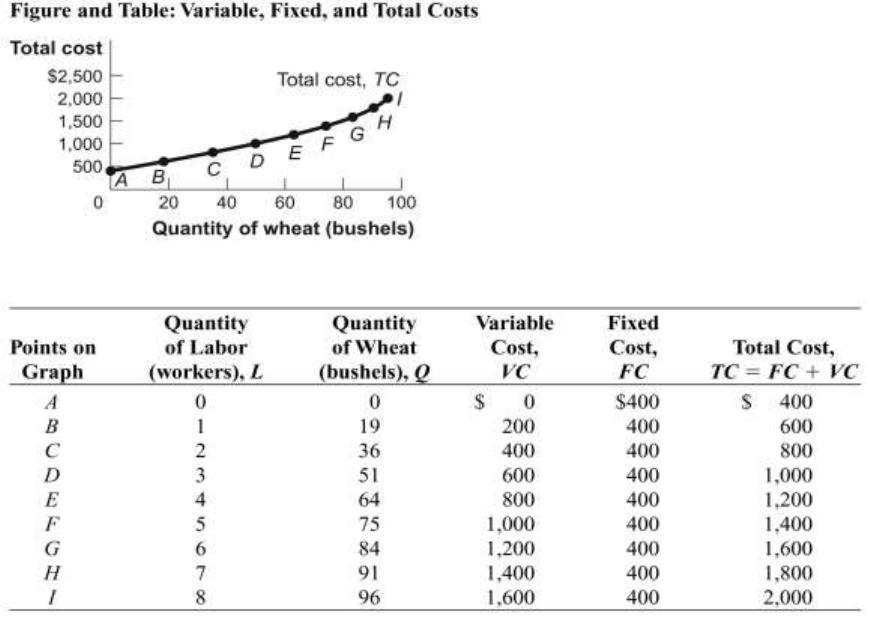
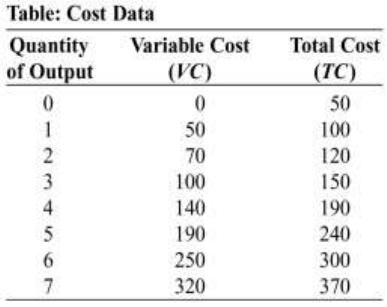
40
B)
35
C)
96
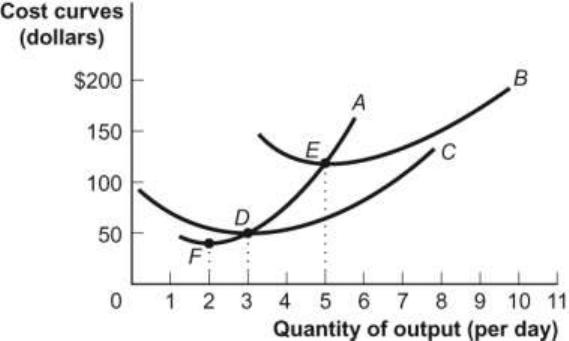
D)
75
Page 5
16.
In economics, the short run is defined as:
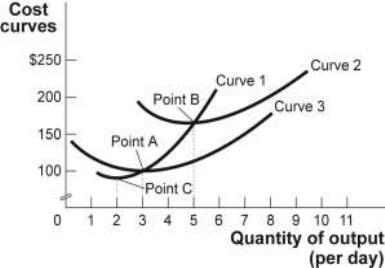
A)
less than 1 year.
B)
less than 6 months.
C)
the period in which some inputs are considered to be fixed in quantity.
D)
the period in which some inputs are fixed, but it cannot exceed 1 year.
17.
In economics, the short run is:
A)
less than 1 week.
B)
less than 1 month.
C)
enough time to vary output but not plant capacity.
D)
enough time to change all inputs to production.
18.
An input whose quantity can be changed in the short run is a(n) _____ input.
A)
marginal
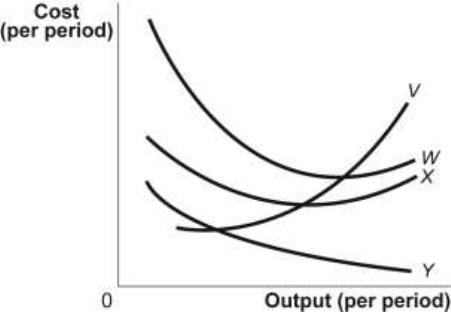
B)
fixed
C)
incremental
D)
variable
19.
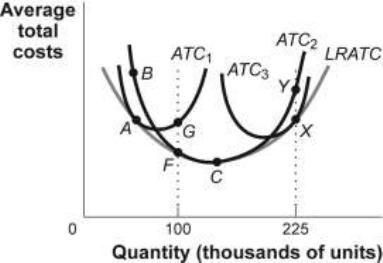
An input whose quantity CANNOT be changed in the short run is:
A)
marginal.
B)
fixed.
C)
incremental.
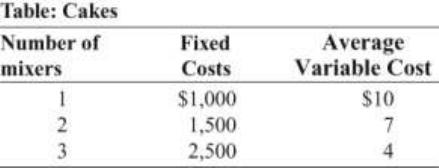
D)
variable.
20.
A fixed input is one:
A)
that exists in nature, and there is only so much of it.
B)
that can be used for one thing only.
C)
that can never produce more or less in any period.
D)
whose quantity cannot be changed in the short run.
21.
The long run is a planning period:
A)
over which a firm can consider all inputs as variable.
B)
of at least five years.
C)
of more than six months.
D)
of 6 months to 5 years.
Page 6
22.
In the long run:
A)
all inputs are fixed.
B)
inputs are neither variable nor fixed.
C)
at least one input is variable and one input is fixed.
D)
all inputs are variable.
23.
The _____ curve shows the quantities of output that can be obtained from different
quantities of a variable input, assuming other inputs are fixed.
A)
total input
B)
marginal input
C)
total product
D)
average total quantity
24.
A total product curve indicates the relationship between _____ when all other inputs are
fixed.
A)
a variable input and price
B)
a variable input and variable cost
C)
a variable input and output
D)
output and price
25.
The marginal product of labor is:
A)
the change in labor divided by the change in total product.
B)
the slope of the total product of labor curve.
C)
the change in average product divided by the change in the quantity of labor.
D)
the change in output that occurs when capital increases by one unit.
26.
A farm can produce 1,000 bushels of wheat per year with two workers and 1,300
bushels of wheat per year with three workers. The marginal product of the third worker
is _____ bushels.
A)
100
B)
300
C)
1,300
D)
2,300
Page 7
27.
When Caroline’s dress factory hires two workers, the total product is 50 dresses. When
she hires three workers, total product is 60, and when she hires four workers, total
product is 65. The slope of the marginal product curve when two to four workers are
hired is:
A)
upward.
B)
horizontal.
C)
vertical.
D)
downward.
28.
When Caroline’s dress factory hires two workers, the total product is 50 dresses. When
she hires three workers, total product is 60, and when she hires four workers, total
product is 75. The slope of the marginal product curve when two to four workers are
hired is:
A)
upward.
B)
downward.
C)
vertical.
D)
horizontal.
29.
When Caroline’s dress factory hires two workers, the total product is 50 dresses. When
she hires three workers, total product is 48, and when she hires four workers, total
product is 45. The marginal product of the third and fourth workers is:
A)
increasing and positive.
B)
increasing and negative.
C)
decreasing and positive.
D)
decreasing and negative.
Use the following to answer questions 30-32:
Page 8
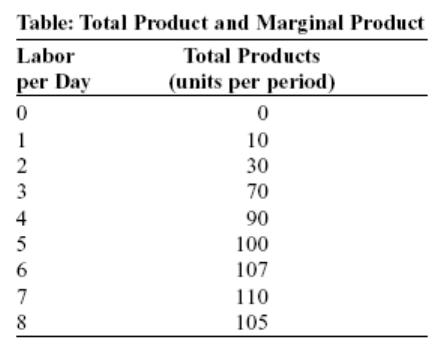
30.
(Table: Total Product and Marginal Product) Look at the table Total Product and
Marginal Product. The marginal product of the second worker is:
A)
10.
B)
15.
C)
20.
D)
30.
31.
(Table: Total Product and Marginal Product) Look at the table Total Product and
Marginal Product. The marginal product of the fourth worker is _____ units.
A)
20
B)
22.5
C)
50
D)
90
32.
(Table: Total Product and Marginal Product) Look at the table Total Product and
Marginal Product. Negative marginal returns begin when the _____ worker is added.
A)
fifth
B)
sixth
C)
seventh
D)
eighth
Use the following to answer questions 33-39:
Figure: The Total Product
Page 9
33.
(Figure: The Total Product) Look at the figure The Total Product. Between points A and
B the marginal product of labor is:
A)
increasing.
B)
zero.
C)
falling.
D)
infinite.
34.
(Figure: The Total Product) Look at the figure The Total Product. Labor added from L1
and up to L2 is:
A)
subject to diminishing marginal returns.
B)
adding increasing amounts to total product.
C)
adding negative amounts to total product.
D)
adding negative amounts to total product and subject to diminishing marginal
returns.
35.
(Figure: The Total Product) Look at the figure The Total Product. As labor is hired
between L1 and L2, the total product is _____ and the marginal product is _____.
A)
rising; positive
B)
falling; zero
C)
rising; negative
D)
rising; zero
36.
(Figure: The Total Product) Look at the figure The Total Product. For hiring labor
between zero and L1:
A)
the marginal product of labor is increasing.
B)
the marginal product of labor is decreasing.
C)
the total product is increasing at a diminishing rate.
D)
the total product is decreasing.
37.
(Figure: The Total Product) Look at the figure The Total Product. After hiring L2 labor
and producing at point B on the total product curve, hiring more labor beyond L2 would
cause the:
A)
marginal product of labor to rise.
B)
marginal product of labor to be negative.
C)
total product to be negative.
D)
total product to be zero.
Page 10
38.
(Figure: The Total Product) Look at the figure The Total Product. When L2 labor is
hired, the total product is at a _____ and the marginal product of labor is _____.
A)
minimum; zero
B)
maximum; zero
C)
maximum; positive
D)
minimum; positive but falling
39.
(Figure: The Total Product) Look at the figure The Total Product. If the firm hires more
than L2 labor, the total product will _____ because the marginal product of labor is
_____.
A)
decrease; positive
B)
increase; positive
C)
decrease; negative
D)
increase; negative
40.
When an additional unit of a variable input adds less to total product than the previous
unit, the firm has:
A)
increasing returns.
B)
diminishing marginal returns.
C)
diminishing total returns.
D)
diminishing marginal returns and diminishing total returns.
41.
Diminishing marginal returns occur when:
A)
each additional unit of a variable factor adds more to total output than the previous
unit.
B)
each additional unit of a variable factor adds less to total output than the previous
unit.
C)
the marginal product of a variable factor is increasing at a decreasing rate.
D)
total product decreases.
42.
You own a deli. Which of the following is most likely a fixed input at your deli?
A)
the dining room
B)
the bread used to make sandwiches
C)
the tomato sauce used to make soups
D)
the employees
Page 11
43.
You own a deli. Which of the following is a decision most likely to be made in the
LONG run at your deli?
A)
You order more breadsticks.
B)
You order more soft drinks for next week.
C)
You renovate the second floor of your building to increase the size of the dining
room.
D)
You advertise for part-time workers.
Use the following to answer question 44:
Figure: The Unknown Curve
44.
(Figure: The Unknown Curve) Look at the figure The Unknown Curve. You are a
cabinetmaker. You employ several workers to produce kitchen and bathroom cabinets.
Your summer intern has drawn a graph showing a relationship between the number of
cabinetmakers you employ and the number of cabinets produced. Unfortunately, your
intern has failed to identify this curve. It is likely to be the _____ curve:
A)
total cost
B)
total product
C)
marginal product
D)
total variable cost
Page 12
Use the following to answer questions 45-46:
45.
(Table: Production of Cabinets) Look at the table The Production of Cabinets. After the
_____ worker the firm begins to have diminishing returns to labor.
A)
first
B)
second
C)
third
D)
fourth
46.
(Table: Production of Cabinets) Look at the table The Production of Cabinets. If each
cabinetmaker could be hired at no cost, how many workers would your firm employ?
A)
two
B)
six
C)
seven
D)
eight
Page 13
Use the following to answer questions 47-48:
Figure: Change in the Total Product
47.
(Figure: Change in the Total Product) Look at the figure Change in the Total Product.
Which of the following choices is a likely cause of the shift in production function from
TP1 to TP2?
A)
Workers in the firm are less productive on average.
B)
The firm employed more of a variable input in the short run.
C)
Available technology has decreased.
D)
The firm employed more of a fixed input in the long run.
48.
(Figure: Change in the Total Product) Look at the figure Change in the Total Product.
As indicated by the change in a production function from TP1 to TP2, the marginal
product of labor curve has:
A)
shifted upward.
B)
shifted downward.
C)
not moved.
D)
become inverted.
49.
A factor of production whose quantity can be changed during the SHORT run is a(n)
_____ factor of production.
A)
marginal
B)
fixed
C)
incremental
D)
variable
Page 14
50.
A factor of production whose quantity CANNOT be changed during the short run is a(n)
_____ factor of production.
A)
marginal
B)
fixed
C)
incremental
D)
variable
51.
Think about running a restaurant. Probably:
A)
cooks and hosts are variable resources.
B)
a building is a variable resource in the short run.
C)
cheese and other wholesale food items are fixed resources in the short run.
D)
valet parking staff is a fixed resource in the long run.
52.
As defined in the text, the long run is a planning period:
A)
in which a firm can adjust all resources.
B)
that is at least five years long.
C)
during which the firm must increase sales to stay in business.
D)
in which variable resources become fixed.
53.
A planning period during which all of a firm’s resources are variable is the _____ run.
A)
long
B)
fixed
C)
short
D)
nominal
54.
In the long run:
A)
the firm has time to change the level of all inputs.
B)
inputs are neither variable nor fixed.
C)
at least one input is free.
D)
all inputs are more expensive.
55.
The long run is:
A)
long enough to vary the quantities of all factors of production.
B)
long enough to vary all factors of production except for the amount of capital
available.
C)
more than one month.
D)
at least one year.

Page 15
Use the following to answer questions 56-58:
56.
(Table: Production of Bagels) Look at the table Production of Bagels. The marginal
product of the third worker is _____ bagels.
A)
9,000
B)
10,000
C)
12,000
D)
15,000
57.
(Table: Production of Bagels) Look at the table Production of Bagels. The marginal
product of the fifth worker is _____ bagels.
A)
5,000
B)
9,000
C)
10,000
D)
12,000
58.
(Table: Production of Bagels) Look at the table Production of Bagels. Diminishing
marginal returns begin with the addition of the _____ worker.
A)
third
B)
fourth
C)
fifth
D)
sixth
Page 16
59.
Diminishing marginal returns means that:
A)
each additional unit of an input will decrease output.
B)
each additional unit of an input will increase output, but by smaller and smaller
amounts.
C)
each additional unit of an input will increase output by larger and larger amounts.
D)
the firm is maximizing profit.
60.
Assuming that all other factors of production are held constant, marginal product is the
change in _____ output resulting from a one-unit change in _____.
A)
total; a variable input
B)
total; a fixed input
C)
total; total product
D)
per unit; a fixed input
61.
The marginal product of labor is the change in _____ divided by the change in _____.
A)
labor; total product
B)
total output; the quantity of labor
C)
average output; the quantity of labor
D)
total costs; the quantity of labor
62.
A farm can produce 1,000 bushels of wheat per year with two workers or 1,300 bushels
of wheat per year with four workers. The marginal product of the fourth worker is
_____ bushels.
A)
100
B)
300
C)
1,300
D)
150
63.
The marginal product of labor is all of the following EXCEPT:
A)
the change in output resulting from a one-unit change in labor.
B)
the slope of the total product curve.
C)
positive at some levels of input and possibly negative at others.
D)
total product divided by total labor.
64.
Suppose that the first four workers generate corresponding total outputs of baby diapers
of 200, 350, 450, and 500, respectively. The marginal product of the second worker is:
A)
50.
B)
100.
C)
150.
D)
200.
Page 17
65.
Suppose that when a coal-mining firm hires one, two, three, four, and five workers, the
corresponding total outputs are 10, 15, 19, 22, and 24 tons, respectively. The marginal
product of the third worker is _____ tons.
A)
3
B)
4
C)
15
D)
19
66.
When a firm has diminishing marginal returns:
A)
its output is falling.
B)
marginal product is falling but is likely to be still positive.
C)
total product falls because marginal product is falling and positive.
D)
marginal product is always negative.
67.
The long run refers to the period for which:
A)
a fixed input exists.
B)
all inputs are variable.
C)
marginal costs are decreasing.
D)
diminishing returns raise marginal cost.
68.
The costs associated with variable inputs are _____, and the costs associated with _____
inputs are _____.
A)
variable; fixed; fixed
B)
fixed; fixed; variable
C)
variable; fixed; variable
D)
fixed; fixed; fixed
69.
Which of the following cost concepts is correctly defined?
A)
MC = TC / FC
B)
ATC = VC + FC
C)
ATC = AVC + AFC
D)
TC = AVC + AFC
70.
A cost that does not depend on the quantity of output produced is:
A)
marginal.
B)
fixed.
C)
variable.
D)
average.
Page 18
Use the following to answer questions 71-72:
71.
(Table: Total Cost Data) Look at the table Total Cost Data. What is the total fixed cost
for this bicycle firm?
A)
$40
B)
$50
C)
$100
D)
$70
72.
(Table: Total Cost Data) Look at the table Total Cost Data. What is the total variable
cost for this bicycle firm when the firm produces 5 bicycles?
A)
$50
B)
$240
C)
$60
D)
$190
73.
The total cost curve for a snowmobile dealership shows how _____ cost depends on the
quantity of _____.
A)
total; fixed inputs
B)
average; variable inputs
C)
total; output
D)
marginal; output
74.
A fixed cost:
A)
will exist only in the long run.
B)
depends on the level of output.
C)
can be positive, even if the firm doesn’t produce any output in the short run.
D)
decreases until the point of diminishing returns is reached.
Page 19
75.
The sum of fixed and variable costs is _____ cost.
A)
total
B)
marginal
C)
variable
D)
average
Use the following to answer questions 76-84:
76.
(Table: Production Function for Soybeans) Look at the table Production Function for
Soybeans. Assume that the fixed input, capital, is 10 acres of land and a tractor, which
have a combined cost of $150 per day. The cost of labor is $100 per worker per day.
The fixed cost of producing 25 bushels of soybeans is:
A)
$50.
B)
$100.
C)
$150.
D)
$250.
77.
(Table: Production Function for Soybeans) Look at the table Production Function for
Soybeans. Assume that the fixed input, capital, is 10 acres of land and a tractor, which
have a combined cost of $150 per day. The cost of labor is $100 per worker per day.
The variable cost of producing 25 bushels of soybeans is:
A)
$50.
B)
$100.
C)
$150.
D)
$250.
Page 20
78.
(Table: Production Function for Soybeans) Look at the table Production Function for
Soybeans. Assume that the fixed input, capital, is 10 acres of land and a tractor, which
have a combined cost of $150 per day. The cost of labor is $100 per worker per day.
The total cost of producing 25 bushels of soybeans is:
A)
$50.
B)
$100.
C)
$150.
D)
$250.
79.
(Table: Production Function for Soybeans) Look at the table Production Function for
Soybeans. Assume that the fixed input, capital, is 10 acres of land and a tractor, which
have a combined cost of $150 per day. The cost of labor is $100 per worker per day.
The variable cost of producing 45 bushels of soybeans is:
A)
$100.
B)
$200.
C)
$350.
D)
$4,500.
80.
(Table: Production Function for Soybeans) Look at the table Production Function for
Soybeans. Assume that the fixed input, capital, is 10 acres of land and a tractor, which
have a combined cost of $150 per day. The cost of labor is $100 per worker per day.
The total cost of producing 45 bushels of soybeans is:
A)
$100.
B)
$200.
C)
$350.
D)
$4,500.
81.
(Table: Production Function for Soybeans) Look at the table Production Function for
Soybeans. Assume that the fixed input, capital, is 10 acres of land and a tractor, which
have a combined cost of $150 per day. The cost of labor is $100 per worker per day.
The variable cost of producing 60 bushels of soybeans is:
A)
$5.
B)
$100.
C)
$150.
D)
$300.
Page 21
82.
(Table: Production Function for Soybeans) Look at the table Production Function for
Soybeans. Assume that the fixed input, capital, is 10 acres of land and a tractor, which
have a combined cost of $150 per day. The cost of labor is $100 per worker per day.
The total cost of producing 60 bushels of soybeans is:
A)
$150.
B)
$450.
C)
$750.
D)
$900.
83.
(Table: Production Function for Soybeans) Look at the table Production Function for
Soybeans. Assume that the fixed input, capital, is 10 acres of land and a tractor, which
have a combined cost of $150 per day. The cost of labor is $100 per worker per day.
The total cost of producing 70 bushels of soybeans is:
A)
$250.
B)
$400.
C)
$550.
D)
$1,024.
84.
(Table: Production Function for Soybeans) Look at the table Production Function for
Soybeans. Assume that the fixed input, capital, is 10 acres of land and a tractor, which
have a combined cost of $150 per day. The cost of labor is $100 per worker per day.
The total cost of producing 75 bushels of soybeans is:
A)
$650.
B)
$1,150.
C)
$1,225.
D)
$7,650.
85.
The total cost curve is:
A)
positively sloped.
B)
negatively sloped.
C)
vertical.
D)
horizontal.
86.
The fixed cost curve is:
A)
positively sloped.
B)
negatively sloped.
C)
vertical.
D)
horizontal.
Page 22
87.
Once diminishing returns have set in, as output increases, the total cost curve:
A)
gets steeper.
B)
gets flatter.
C)
becomes horizontal.
D)
increases at first, and then decreases.
88.
The total cost curve gets steeper as output increases because of:
A)
increasing returns to the variable input.
B)
decreasing returns to the variable input.
C)
increases in fixed cost.
D)
decreases in overhead costs.
89.
The change in total output resulting from a one-unit increase in the quantity of an input
used, holding the quantities of all other inputs constant, is:
A)
average cost.
B)
average product.
C)
marginal cost.
D)
marginal product.
90.
Austin’s total fixed cost at the bakery is $3,600 a month. Austin employs 20 workers and
pays each worker $8 an hour. The marginal product of the twentieth worker is 12 iced
cupcakes an hour. What is the marginal cost of the last cupcake produced by the last
worker Austin hired?
A)
$0.26
B)
$0.66
C)
$3.81
D)
$8.00
91.
For Heidi, the marginal cost of producing one additional photograph equals the change
in _____ divided by the change in the _____ of photographs.
A)
total cost; number
B)
marginal cost; number
C)
total cost; marginal product
D)
average cost; number
Page 23
92.
When a cherry orchard in Oregon adds a worker, the total cost of production increases
by $24,000. Adding the worker increases total cherry output by 600 pounds. Therefore,
the marginal cost of the last pound of cherries produced is:
A)
$40.
B)
$19.
C)
$4,000.
D)
$24,000.
93.
Marginal cost can be calculated as:
A)
TC / Q, where TC is total cost and Q is output.
B)
VC / Q, where VC is variable cost and Q is output.
C)
the slope of the total cost curve.
D)
TC / Q, where TC is total cost and Q is output; VC / Q, where VC is variable
cost and Q is output; and as the slope of the total cost curve.
94.
If the marginal cost of producing the seventh sports jersey is $21, then the total cost of
seven sports jerseys is:
A)
$21.
B)
$60.
C)
$147.
D)
The answer cannot be determined from the information provided.
95.
If Marie Marionettes is operating under conditions of diminishing marginal product, the
marginal costs will be:
A)
equal to average total cost.
B)
decreasing.
C)
increasing.
D)
constant.
96.
Buford Bus Manufacturing installs a new assembly line. As a result, the output per
worker increases. The marginal cost of output at Buford:
A)
will increase (the MC curve will shift up).
B)
will decrease (the MC curve will shift down).
C)
will be unchanged.
D)
is at its maximum.
Page 24
97.
If the marginal cost of the first sports jersey is $21, the marginal cost of the second
sports jersey is $40, and the marginal cost of the third jersey is $17, what is the total
variable cost of producing three jerseys?
A)
$26
B)
$78
C)
$17
D)
$61
98.
The shape of the marginal cost curve is the mirror image of the shape of the _____
curve.
A)
total product
B)
average product
C)
marginal product
D)
average total cost
99.
Ashley Bakery expects its marginal cost curve will eventually slope upward, because as
with most production processes, baking has:
A)
constant opportunity costs.
B)
a maximum efficient scale.
C)
diminishing marginal returns.
D)
decreasing opportunity costs.
100.
The _____ curve shows the additional cost of producing each additional unit of output.
A)
average cost
B)
total cost
C)
marginal product
D)
marginal cost
101.
Marginal cost is the change in _____ cost resulting from a one-unit change in _____.
A)
total; a variable input
B)
total; output
C)
total; average cost
D)
average; output
102.
A firm’s marginal cost is:
A)
the ratio of the change in total cost to the change in the quantity of output.
B)
the change in total cost divided by the change in labor input.
C)
the slope of the average fixed cost curve.
D)
total cost divided by output.
Page 25
103.
Marginal cost _____ over the range of increasing marginal returns and _____ over the
range of diminishing marginal returns.
A)
increases; decreases
B)
decreases; increases
C)
is constant; decreases
D)
increases; is constant
104.
Which of the following statements is FALSE?
A)
When the marginal product of labor is upward-sloping, the marginal cost curve is
upward-sloping.
B)
The average fixed cost curve is downward-sloping and approaches the horizontal
axis.
C)
The marginal cost curve intersects the average variable cost curve at the minimum
of average variable cost.
D)
When the marginal cost curve is above the average cost curve, the average cost
curve is upward-sloping.
105.
The curve that shows the additional cost of each additional unit of output is called the
_____ curve.
A)
average cost
B)
total cost
C)
marginal product
D)
marginal cost
106.
Marginal cost is the change in:
A)
total product resulting from a one-unit change in a variable input.
B)
total cost resulting from a one-unit change in quantity of a variable input.
C)
total cost divided by the change in output.
D)
average cost resulting from a one-unit change in quantity of output.
107.
The change in total cost resulting from a one-unit change in quantity is _____ cost.
A)
average fixed
B)
average variable
C)
marginal
D)
average total
Page 26
108.
A firm’s marginal cost is:
A)
the ratio of the change in fixed cost to the change in the quantity of output.
B)
the slope of the total cost curve.
C)
the slope of the average variable cost curve.
D)
the ratio of the change in total output to the change in the quantity of labor.
109.
Marginal cost is the:
A)
increase in total cost when one more unit of output is produced.
B)
reduction in cost from economies of scale.
C)
ratio of average total cost to total cost.
D)
increase in output from the addition of one unit of labor.
110.
The larger the output, the more output over which fixed cost is distributed. Called the
_____ effect, this leads to a ______ average _____ cost.
A)
spreading; lower; fixed
B)
spreading; higher; fixed
C)
diminishing returns; lower; variable
D)
diminishing returns; higher; variable
111.
The larger the output, the more variable input required to produce additional units.
Called the _____ effect, this leads to a ______ average _____ cost.
A)
spreading; lower; fixed
B)
spreading; higher; fixed
C)
diminishing returns; lower; variable
D)
diminishing returns; higher; variable
112.
The average total cost curve has a U shape because the ______ effect is dominant at low
levels of output, and the _____ effect is dominant at high levels of output.
A)
diminishing returns; spreading
B)
spreading; diminishing returns
C)
comparative advantage; absolute advantage
D)
absolute advantage; comparative advantage
113.
The rent for Oscar’s sporting goods store is $2,500 per month. Oscar pays his staff $9
per hour, and his monthly electricity bill averages $700, depending on his total hours of
operation. Oscar’s fixed costs of production equal:
A)
$2,500 per month.
B)
$3,200 per month.
C)
$9 per hour multiplied by total hours of work plus $700.
D)
$9 per hour multiplied by total hours of work plus $3,200.
Page 27
114.
Krista’s dry-cleaning business incurs $900 per month in fixed costs. Last month her total
output was 3,000 pounds of clothes. This month her total output fell to 2,700 pounds.
This means her average fixed cost _____ by a little more than _____.
A)
fell; 3.33 cents
B)
increased; 3.33 cents
C)
fell; 2.50 cents
D)
increased; 2.50 cents
115.
Darren runs a barbershop with average fixed costs of $60 per day and a total output of
50 haircuts per day. Darren shuts down every year during the last week of July and the
first week of August. What is his annual fixed cost if he is open six days per week?
A)
$18,000
B)
$3,000
C)
$60
D)
The answer cannot be determined with the information available.
116.
The average total cost of producing cell phones in a factory is $20 at the current output
level of 100 units per week. If fixed cost is $1,200 per week:
A)
average fixed cost is $20.
B)
total cost is $3,200.
C)
variable cost is $2,000.
D)
average variable cost is $8.
117.
Average variable cost equals all of the following EXCEPT:
A)
variable cost divided by output.
B)
the quantity total cost minus fixed cost divided by output.
C)
average total cost minus average fixed cost.
D)
variable cost times output.
118.
You run a business producing picture frames. This month your total cost of production
is $10,000, your variable cost of production is $6,000, and you produce 3,000 picture
frames. It follows that average _____ cost is _____.
A)
variable; $2
B)
total; $3
C)
total; $1
D)
fixed; $1
Page 28
119.
For most restaurants, the average total cost curve _____ at _____ levels of output, then
_____ at _____ levels.
A)
falls; low; rises; high
B)
rises; low; falls; high
C)
rises; high; rises; low
D)
falls; high; falls; low
120.
In the short run, the average total cost curve slopes upward because of:
A)
economies of scale.
B)
diseconomies of scale.
C)
increasing returns.
D)
diminishing returns.
121.
The _____ cost curve is NOT affected by diminishing returns.
A)
average fixed
B)
average variable
C)
average total
D)
marginal
122.
The _____ cost curve continually declines as more output is produced in the short run.
A)
marginal
B)
average variable
C)
average fixed
D)
average total
Use the following to answer questions 123-125:
Figure: The Average Total Cost Curve
Page 29
123.
(Figure: The Average Total Cost Curve) Look at the figure The Average Total Cost
Curve. The total cost of producing three pairs of boots is approximately:
A)
$24.
B)
$72.
C)
$75.
D)
$216.
124.
(Figure: The Average Total Cost Curve) Look at the figure The Average Total Cost
Curve. The total cost of producing five pairs of boots is approximately:
A)
$408.
B)
$82.
C)
$108.
D)
$17.
125.
(Figure: The Average Total Cost Curve) Look at the figure The Average Total Cost
Curve. The total cost of producing 10 pairs of boots is approximately:
A)
$13.
B)
$54.
C)
$131.
D)
$1,308.
126.
Average total cost is:
A)
the change in cost divided by the change in output.
B)
total cost divided by output.
C)
the change in output divided by the change in costs.
D)
total cost times output.
127.
Total cost divided by the quantity of output produced is:
A)
average total cost.
B)
average fixed cost.
C)
average product.
D)
marginal cost.
128.
Average variable cost is:
A)
variable cost per unit multiplied by output.
B)
total variable cost divided by output.
C)
the difference between average total cost and total variable cost.
D)
the difference between total cost and total variable cost.
Page 30
129.
Average variable cost is the ratio of:
A)
total cost to marginal cost.
B)
total cost to the amount of variable input.
C)
variable cost to the quantity of output.
D)
marginal cost to the quantity of output.
130.
A business produces 10 pairs of eyeglasses. It incurs $30 in average variable cost and $5
in average fixed cost. The average total cost of producing 10 pairs of eyeglasses is:
A)
$30.
B)
$35.
C)
$50.
D)
$300.
131.
A business produces 10 pairs of eyeglasses. It incurs $35 in average total cost and $5 in
average fixed cost. The average variable cost of producing 10 pairs of eyeglasses is:
A)
$30.
B)
$35.
C)
$50.
D)
$300.
132.
A business produces 10 pairs of eyeglasses. It incurs $30 in average variable cost and $5
in average fixed cost. The total cost of producing 10 pairs of eyeglasses is:
A)
$35.
B)
$50.
C)
$300.
D)
$350.
133.
A business produces 10 pairs of eyeglasses. It incurs $30 in average variable cost and
$35 in average total cost. The total fixed cost of producing 10 pairs of eyeglasses is:
A)
$3.
B)
$35.
C)
$50.
D)
$300.
134.
Average total cost is:
A)
the change in variable cost divided by the change in quantity.
B)
total cost divided by quantity.
C)
the change in quantity divided by the change in labor costs.
D)
total cost times quantity.
Page 31
135.
Average variable cost is:
A)
variable cost per unit multiplied by quantity.
B)
total variable cost divided by quantity.
C)
the difference between average total cost and total cost.
D)
the difference between total cost and total fixed cost.
136.
Average total cost is the ratio of _____ cost to _____.
A)
total; marginal cost
B)
total; quantity of output
C)
total; amount of variable input
D)
marginal; amount of variable input
137.
Total cost divided by the quantity of output produced is:
A)
always increasing.
B)
always decreasing.
C)
average total cost.
D)
marginal cost.
138.
Average variable cost is the ratio of:
A)
total cost to the marginal cost.
B)
variable inputs to fixed inputs.
C)
variable cost to the quantity of output.
D)
fixed costs to variable cost.
139.
Variable cost divided by the quantity of output produced is _____ cost.
A)
marginal
B)
average total
C)
average fixed
D)
average variable
140.
Tankao makes earbuds for mobile devices. When Tankao produces 20 sets of earbuds,
its average variable cost is $5 per set and its average total cost is $8 per set. Tankao’s:
A)
marginal cost is less than $3 per set.
B)
marginal cost is $3 per set.
C)
average fixed cost is $3 per set.
D)
marginal cost is equal to its average fixed cost.
Page 32
141.
Tankao makes Bluetooth sets for mobile devices. When 50 Bluetooth sets are produced
in the short run, the average variable cost is $30. Tankao’s average _____ cost is _____.
A)
total; $30.
B)
total; greater than $30.
C)
total; less than $30.
D)
fixed; $30.
142.
Austin’s total fixed cost is $3,600 a month at his cupcake bakery. Austin employs 20
workers and pays each worker $600 a month. If labor is his only variable cost, what is
Austin’s total cost?
A)
$3,600
B)
$1,200
C)
$15,600
D)
$12,000
143.
When marginal cost is rising:
A)
average variable cost must be rising.
B)
average total cost must be rising.
C)
average variable cost and average total cost must be falling.
D)
both average variable cost and average total cost may be rising or falling.
144.
When Aishe’s Bar-B-Que produces 10 pork sandwiches, the total cost is $5. When 11
pork sandwiches are produced, the total cost rises to $6. From this we know that the
marginal cost of the eleventh pork sandwich:
A)
is equal to the average cost of 11 pork sandwiches.
B)
is greater than the average cost of 11 pork sandwiches.
C)
is less than the average cost of 11 pork sandwiches.
D)
can’t be calculated without more information.
145.
Suppose the marginal cost curve in the short run first decreases and then increases. If
marginal cost is decreasing, _____ must be _____ and _____ must be _____.
A)
marginal product; increasing; average fixed cost; decreasing
B)
average variable cost; decreasing; average fixed cost; increasing
C)
average total cost; increasing; marginal cost; decreasing
D)
marginal product; increasing; average variable cost; decreasing
Page 33
146.
Suppose the marginal cost curve in the short run first decreases and then increases. If
marginal cost is increasing, _____ must be _____.
A)
marginal product; increasing
B)
average variable cost; increasing
C)
average total cost; increasing
D)
marginal product; decreasing
147.
At the current level of output, Becca Furniture’s marginal cost curve is above the
average total cost curve. This means Becca Furniture’s average total cost curve:
A)
must be rising.
B)
must be flat.
C)
must be falling.
D)
may be rising, falling, or flat depending on other things.
148.
The marginal cost curve intersects the average variable cost curve at:
A)
its lowest point.
B)
its maximum.
C)
its end point.
D)
no point; the curves don’t intersect.
149.
When marginal cost is BELOW average variable cost, average variable cost must be:
A)
at its minimum.
B)
at its maximum.
C)
falling.
D)
rising.
150.
When marginal cost is ABOVE average variable cost, average variable cost must be:
A)
at its minimum.
B)
at its maximum.
C)
falling.
D)
rising.
151.
If marginal cost is GREATER THAN average total cost:
A)
average total cost is increasing.
B)
average total cost is decreasing.
C)
average total cost is unchanged.
D)
marginal cost is decreasing.
Page 34
152.
If marginal cost is equal to average total cost:
A)
average total cost is increasing.
B)
average total cost is at its maximum.
C)
average total cost is at its minimum.
D)
marginal cost is decreasing.
153.
If an increase in output results in a decrease in average total cost, the corresponding
marginal cost is:
A)
less than average total cost.
B)
greater than average total cost.
C)
equal to average total cost.
D)
negative.
154.
When a fine caterer produces 30 catered meals, its marginal cost and average variable
cost each equal $10. Therefore, assuming normally shaped cost curves, at 29 meals its
marginal cost is _____ $10 and its average variable cost is _____ $10.
A)
more than; less than
B)
less than; more than
C)
more than; more than
D)
equal to; equal to
155.
When marginal cost is below average variable cost, average variable cost must be:
A)
above average total cost.
B)
below average fixed cost.
C)
falling.
D)
rising.
156.
When marginal cost is above average variable cost, average variable cost must be:
A)
at its minimum.
B)
at its maximum.
C)
greater than average total cost.
D)
increasing.
157.
If marginal cost is greater than average total cost, then average total cost is:
A)
at its maximum.
B)
at its minimum.
C)
increasing.
D)
decreasing.
Page 35
158.
If marginal cost is less than average total cost, then _____ cost is _____.
A)
average total; increasing
B)
average total; decreasing
C)
marginal; necessarily increasing
D)
marginal; necessarily decreasing
159.
Suppose Cyd knows the average total cost of producing 9 scones is $5, while the
average total cost of producing 10 scones is $5.20. What is the marginal cost of the tenth
scone?
A)
$7.00
B)
$5.20
C)
$0.20
D)
$5.00
Use the following to answer question 160:
160.
(Table: Output and Marginal Cost) Look at the table Output and Marginal Cost. After
graduation you achieve your dream of opening an art shop that specializes in selling
mud statues. How many statues should you produce to minimize your average variable
costs?
A)
two
B)
three
C)
four
D)
five
161.
Kaile Cakes produces 10 cakes per day. The marginal cost of the tenth cake is $24, and
average total cost of 10 cakes is $6. The average total cost of 9 cakes is:
A)
$4.
B)
$5.
C)
$6.
D)
$8.
Page 36
162.
Cindy operates Birds-R-Us, a small store manufacturing and selling 100 bird feeders per
month. Cindy’s monthly total fixed costs are $500, and her monthly total variable costs
are $2,500. If for some reason Cindy’s fixed cost fell to $400, then her _____ costs
would _____.
A)
average fixed; increase
B)
average total; decrease
C)
marginal; decrease
D)
average variable; decrease
163.
In the short run, as output gets larger:
A)
fixed cost gets smaller.
B)
the average variable cost curve gets closer to the average total cost curve.
C)
marginal cost gets smaller.
D)
average total cost decreases after the point of diminishing returns.
Use the following to answer questions 164-168:
Page 37
164.
(Figure and Table: Variable, Fixed, and Total Costs) Look at the figure and table
Variable, Fixed, and Total Costs. The marginal cost of increasing production from 19 to
36 bushels of wheat is:
A)
$23.53.
B)
$11.76.
C)
$22.22.
D)
$11.11.
165.
(Figure and Table: Variable, Fixed, and Total Costs) Look at the figure and table
Variable, Fixed, and Total Costs. The marginal cost of increasing production from 51 to
64 bushels of wheat is:
A)
$16.00.
B)
$15.38.
C)
$12.50.
D)
$18.75.
166.
(Figure and Table: Variable, Fixed, and Total Costs) Look at the figure and table
Variable, Fixed, and Total Costs. The marginal cost of increasing production from 84 to
91 bushels of wheat is:
A)
$13.00.
B)
$19.78.
C)
$22.22.
D)
$28.57.
167.
(Figure and Table: Variable, Fixed, and Total Costs) Look at the figure and table
Variable, Fixed, and Total Costs. When 51 bushels of wheat is produced, the average
fixed cost is _____, average variable cost is _____, and average total cost is _____.
A)
$7.84; $11.76; $19.60
B)
$133.33; $200.00; $333.33
C)
$400.00; $600.00; $1,000.00
D)
$5.33; $13.33; $18.67
168.
(Figure and Table: Variable, Fixed, and Total Costs) Look at the figure and table
Variable, Fixed, and Total Costs. When 96 bushels of wheat is produced, the average
fixed cost is _____, average variable cost is _____, and average total cost is _____.
A)
$7.84; $11.76; $19.60
B)
$133.33; $200.00; $333.33
C)
$4.17; $16.67; $20.83
D)
$5.33; $13.33; $18.67
Page 38
Use the following to answer questions 169-173:
Figure: Short-Run Costs
169.
(Figure: Short-Run Costs) Look at the figure Short-Run Costs. A is the _____ cost
curve.
A)
average total
B)
average variable
C)
marginal
D)
total
170.
(Figure: Short-Run Costs) Look at the figure Short-Run Costs. B is the _____ cost
curve.
A)
average total
B)
average variable
C)
marginal
D)
total
171.
(Figure: Short-Run Costs) Look at the figure Short-Run Costs. C is the _____ cost
curve.
A)
average total
B)
total
C)
marginal
D)
average variable
Page 39
172.
(Figure: Short-Run Costs) Look at the figure Short-Run Costs. The vertical difference
between curve B and curve C at any quantity of output is _____ cost.
A)
marginal
B)
fixed
C)
average fixed
D)
average variable
173.
(Figure: Short-Run Costs) Look at the figure Short-Run Costs. At 7 units of output,
average fixed cost is approximately _____, and average variable cost is approximately
_____.
A)
$100; $100
B)
$10; $135
C)
$40; $100
D)
$140; $140
Use the following to answer questions 174-181:
Figure: Short-Run Costs II
174.
(Figure: Short-Run Costs II) Look at the figure Short-Run Costs II. Curve 1 is the _____
cost curve.
A)
average total
B)
average variable
C)
marginal
D)
total
Page 40
175.
(Figure: Short-Run Costs II) Look at the figure Short-Run Costs II. Curve 2 is the _____
cost curve.
A)
average total
B)
average variable
C)
marginal
D)
total
176.
(Figure: Short-Run Costs II) Look at the figure Short-Run Costs II. Curve 3 is the _____
cost curve.
A)
average total
B)
total
C)
marginal
D)
average variable
177.
(Figure: Short-Run Costs II) Look at the figure Short-Run Costs II. Curve 1 crosses the
average variable cost curve at:
A)
3 units of output.
B)
approximately 5.3 units of output.
C)
the minimum value of curve 2.
D)
the level of output at which diminishing marginal returns begin.
178.
(Figure: Short-Run Costs II) Look at the figure Short-Run Costs II. Curve 1 crosses the
average total cost curve at:
A)
the minimum value of curve 2.
B)
approximately 4.3 units of output.
C)
approximately 2.8 units of output.
D)
point A.
179.
(Figure: Short-Run Costs II) Look at the figure Short-Run Costs II. At 6 units of output,
marginal cost is approximately:
A)
$100.
B)
$120.
C)
$250.
D)
$200.
Page 41
180.
(Figure: Short-Run Costs II) Look at the figure Short-Run Costs II. At 6 units of output,
average total cost is approximately:
A)
$100.
B)
$120.
C)
$170.
D)
$250.
181.
(Figure: Short-Run Costs II) Look at the figure Short-Run Costs II. At 6 units of output,
average variable cost is approximately:
A)
$100.
B)
$120.
C)
$200.
D)
$250.
Use the following to answer questions 182-195:
182.
(Table: Cost Data) Look at the table Cost Data. When the purse factory produces 5 units
of output (purses):
A)
marginal cost is above average total cost, and average total cost is rising.
B)
average total cost is above average variable cost, and average variable cost is
falling.
C)
marginal cost is below average variable cost, and average variable cost is falling.
D)
marginal cost is above average variable cost and below average total cost, and
average total cost is rising.
Page 42
183.
(Table: Cost Data) Look at the table Cost Data. The average variable cost of producing
2 purses is:
A)
$190.
B)
$70.
C)
$50.
D)
$35.
184.
(Table: Cost Data) Look at the table Cost Data. The average fixed cost of producing 2
purses is:
A)
$0.
B)
$50.
C)
$25.
D)
$2.
185.
(Table: Cost Data) Look at the table Cost Data. The average total cost of producing 2
purses is:
A)
$60.
B)
$120.
C)
$190.
D)
$220.
186.
(Table: Cost Data) Look at the table Cost Data. The marginal cost of producing the
second purse is:
A)
$60.
B)
$50.
C)
$35.
D)
$20.
187.
(Table: Cost Data) Look at the table Cost Data. The average variable cost of producing
4 purses is:
A)
$190.00.
B)
$140.00.
C)
$47.50.
D)
$35.00.
Page 43
188.
(Table: Cost Data) Look at the table Cost Data. The average fixed cost of producing 4
purses is:
A)
$12.50.
B)
$47.50.
C)
$50.00.
D)
$82.50.
189.
(Table: Cost Data) Look at the table Cost Data. The average total cost of producing 4
purses is:
A)
$12.50.
B)
$47.50.
C)
$50.00.
D)
$82.50.
190.
(Table: Cost Data) Look at the table Cost Data. The marginal cost of producing the
fourth purse is:
A)
$60.
B)
$50.
C)
$40.
D)
$20.
191.
(Table: Cost Data) Look at the table Cost Data. The average total cost of producing 6
purses is:
A)
$190.
B)
$70.
C)
$50.
D)
$35.
192.
(Table: Cost Data) Look at the table Cost Data. The average fixed cost of producing 5
purses is:
A)
$0.
B)
$50.
C)
$25.
D)
$10.
Page 44
193.
(Table: Cost Data) Look at the table Cost Data. The average variable cost of producing
5 purses is:
A)
$10.
B)
$38.
C)
$48.
D)
$190.
194.
(Table: Cost Data) Look at the table Cost Data. The average total cost of producing 5
purses is:
A)
$10.
B)
$38.
C)
$48.
D)
$240.
195.
(Table: Cost Data) Look at the table Cost Data. The marginal cost of producing the fifth
purse is:
A)
$60.
B)
$50.
C)
$35.
D)
$20.
Use the following to answer questions 196-198:
Figure: A Firm’s Cost Curves
Page 45
196.
(Figure: A Firm’s Cost Curves) Look at the figure A Firm’s Cost Curves. The curve
labeled V represents the firm’s _____ cost curve.
A)
total
B)
average total
C)
marginal
D)
average variable
197.
(Figure: A Firm’s Cost Curves) Look at the figure A Firm’s Cost Curves. The curve
labeled W represents the firm’s _____ cost curve.
A)
average fixed
B)
average total
C)
average variable
D)
total variable
198.
(Figure: A Firm’s Cost Curves) Look at the figure A Firm’s Cost Curves. The curve X
represents the firm’s _____ cost curve.
A)
marginal
B)
average total
C)
average fixed
D)
average variable
199.
The long-run average total cost curve is tangent to an infinite number of short-run _____
cost curves.
A)
total
B)
marginal
C)
average variable
D)
average total
200.
At the long-run quantity of output, where the long-run average total cost curve is at its
lowest point, it is tangent to the _____ of the corresponding short-run average total cost
curve.
A)
minimum
B)
maximum
C)
right of the minimum
D)
left of the minimum
Page 46
201.
At quantities less than the long-run minimum cost per unit of output, the long-run
average total cost curve is _____ of the corresponding short-run average total cost
curve.
A)
tangent to the minimum
B)
tangent to the maximum
C)
to the right of the minimum
D)
to the left of the minimum
202.
At quantities greater than the long-run minimum cost per unit of output, the long-run
average total cost curve is _____ of the corresponding short-run average total cost
curve.
A)
tangent to the minimum
B)
tangent to the maximum
C)
to the right of the minimum
D)
to the left of the minimum
Use the following to answer questions 203-204:
Figure: Long-Run and Short-Run Average Cost Curves
203.
(Figure: Long-Run and Short-Run Average Cost Curves) Look at the figure Long-Run
and Short-Run Average Cost Curves. If a firm faced the long-run average total cost
curve shown in the figure and it expected to produce 100,000 units of the good in the
long run, the firm should build the plant associated with:
A)
ATC1.
B)
ATC2.
C)
ATC3.
D)
ATC1 or ATC2.
Page 47
204.
(Figure: Long-Run and Short-Run Average Cost Curves) Look at the figure Long-Run
and Short-Run Average Cost Curves. If a firm is producing at point C on the ATC2 but
anticipates increasing output to 225,000 units in the long run, the firm will build a
_____ plant and have _____ of scale.
A)
smaller; economies
B)
smaller; diseconomies
C)
bigger; economies
D)
bigger; diseconomies
205.
In the long run, all costs are:
A)
fixed.
B)
constant.
C)
variable.
D)
marginal.
206.
In the long run:
A)
all factors are fixed.
B)
all factors are variable.
C)
production choices are more limited than in the short run.
D)
production is always greater than zero.
207.
When a firm adds physical capital, in the short run fixed costs will:
A)
increase.
B)
decrease.
C)
remain the same.
D)
decrease at first and then increase.
208.
When a firm adds capital, in the short run workers will be:
A)
less productive and let the machines do most of the work.
B)
more productive, since they have more equipment.
C)
at the same level of productivity.
D)
more productive at first and then less productive after a few weeks.
209.
When a firm adds capital, in the short run variable costs for any level of output will:
A)
increase.
B)
decrease.
C)
remain the same.
D)
increase at first and then decrease.
Page 48
Use the following to answer questions 210-236:
210.
(Table: Cakes) Look at the table Cakes. Pat is opening a bakery to make and sell special
birthday cakes. She is trying to decide how many mixers to purchase. Her estimated
fixed and average variable costs if she purchases one, two, or three mixers are shown in
the table. Assume that average variable costs do not vary with the quantity of output. If
Pat purchases one mixer and bakes 100 cakes per day, what is her average fixed cost?
A)
$10,000
B)
$1,000
C)
$15
D)
$10
211.
(Table: Cakes) Look at the table Cakes. Pat is opening a bakery to make and sell special
birthday cakes. She is trying to decide how many mixers to purchase. Her estimated
fixed and average variable costs if she purchases one, two, or three mixers are shown in
the table. Assume that average variable costs do not vary with the quantity of output. If
Pat purchases one mixer and bakes 100 cakes per day, what is her average total cost?
A)
$1,010
B)
$20
C)
$15
D)
$10
212.
(Table: Cakes) Look at the table Cakes. Pat is opening a bakery to make and sell special
birthday cakes. She is trying to decide how many mixers to purchase. Her estimated
fixed and average variable costs if she purchases one, two, or three mixers are shown in
the table. Assume that average variable costs do not vary with the quantity of output. If
Pat purchases one mixer and bakes 200 cakes per day, what is her average fixed cost?
A)
$5
B)
$10
C)
$200
D)
$1,000
Page 49
213.
(Table: Cakes) Look at the table Cakes. Pat is opening a bakery to make and sell special
birthday cakes. She is trying to decide how many mixers to purchase. Her estimated
fixed and average variable costs if she purchases one, two, or three mixers are shown in
the table. Assume that average variable costs do not vary with the quantity of output. If
Pat purchases one mixer and bakes 200 cakes per day, what is her average total cost?
A)
$5
B)
$15
C)
$200
D)
$1,000
214.
(Table: Cakes) Look at the table Cakes. Pat is opening a bakery to make and sell special
birthday cakes. She is trying to decide how many mixers to purchase. Her estimated
fixed and average variable costs if she purchases one, two, or three mixers are shown in
the table. Assume that average variable costs do not vary with the quantity of output. If
Pat purchases one mixer and bakes 400 cakes per day, what is her average fixed cost?
A)
$0.025
B)
$2.50
C)
$1,000
D)
$400,000
215.
(Table: Cakes) Look at the table Cakes. Pat is opening a bakery to make and sell special
birthday cakes. She is trying to decide how many mixers to purchase. Her estimated
fixed and average variable costs if she purchases one, two, or three mixers are shown in
the table. Assume that average variable costs do not vary with the quantity of output. If
Pat purchases one mixer and bakes 400 cakes per day, what is her average total cost?
A)
$2.50
B)
$10
C)
$12.50
D)
$1,010
216.
(Table: Cakes) Look at the table Cakes. Pat is opening a bakery to make and sell special
birthday cakes. She is trying to decide how many mixers to purchase. Her estimated
fixed and average variable costs if she purchases one, two, or three mixers are shown in
the table. Assume that average variable costs do not vary with the quantity of output. If
Pat purchases one mixer, her average fixed cost _____ in the range of output between
100 and 400 cakes.
A)
increases
B)
decreases
C)
remains the same
D)
can’t be calculated
Page 50
217.
(Table: Cakes) Look at the table Cakes. Pat is opening a bakery to make and sell special
birthday cakes. She is trying to decide how many mixers to purchase. Her estimated
fixed and average variable costs if she purchases one, two, or three mixers are shown in
the table. Assume that average variable costs do not vary with the quantity of output. If
Pat purchases one mixer, her average total cost _____ in the range of output between
100 and 400 cakes.
A)
increases
B)
decreases
C)
remains the same
D)
can’t be calculated
218.
(Table: Cakes) Look at the table Cakes. Pat is opening a bakery to make and sell special
birthday cakes. She is trying to decide how many mixers to purchase. Her estimated
fixed and average variable costs if she purchases one, two, or three mixers are shown in
the table. Assume that average variable costs do not vary with the quantity of output. If
Pat purchases two mixers and bakes 100 cakes per day, what is her average fixed cost?
A)
$10,000
B)
$1,000
C)
$15
D)
$10
219.
(Table: Cakes) Look at the table Cakes. Pat is opening a bakery to make and sell special
birthday cakes. She is trying to decide how many mixers to purchase. Her estimated
fixed and average variable costs if she purchases one, two, or three mixers are shown in
the table. Assume that average variable costs do not vary with the quantity of output. If
Pat purchases two mixers and bakes 100 cakes per day, what is her average total cost?
A)
$8
B)
$10
C)
$15
D)
$22
220.
(Table: Cakes) Look at the table Cakes. Pat is opening a bakery to make and sell special
birthday cakes. She is trying to decide how many mixers to purchase. Her estimated
fixed and average variable costs if she purchases one, two, or three mixers are shown in
the table. Assume that average variable costs do not vary with the quantity of output. If
Pat purchases two mixers and bakes 200 cakes per day, what is her average fixed cost?
A)
$300,000
B)
$1,508
C)
$187.50
D)
$7.50
Page 51
221.
(Table: Cakes) Look at the table Cakes. Pat is opening a bakery to make and sell special
birthday cakes. She is trying to decide how many mixers to purchase. Her estimated
fixed and average variable costs if she purchases one, two, or three mixers are shown in
the table. Assume that average variable costs do not vary with the quantity of output. If
Pat purchases two mixers and bakes 200 cakes per day, what is her average total cost?
A)
$8
B)
$14.50
C)
$1,492
D)
$1,508
222.
(Table: Cakes) Look at the table Cakes. Pat is opening a bakery to make and sell special
birthday cakes. She is trying to decide how many mixers to purchase. Her estimated
fixed and average variable costs if she purchases one, two, or three mixers are shown in
the table. Assume that average variable costs do not vary with the quantity of output. If
Pat purchases two mixers and bakes 400 cakes per day, what is her average fixed cost?
A)
$0.02
B)
$3.75
C)
$500
D)
$1,508
223.
(Table: Cakes) Look at the table Cakes. Pat is opening a bakery to make and sell special
birthday cakes. She is trying to decide how many mixers to purchase. Her estimated
fixed and average variable costs if she purchases one, two, or three mixers are shown in
the table. Assume that average variable costs do not vary with the quantity of output. If
Pat purchases two mixers and bakes 400 cakes per day, what is her average total cost?
A)
$0.02
B)
$10.75
C)
$500
D)
$1,507
224.
(Table: Cakes) Look at the table Cakes. Pat is opening a bakery to make and sell special
birthday cakes. She is trying to decide how many mixers to purchase. Her estimated
fixed and average variable costs if she purchases one, two, or three mixers are shown in
the table. Assume that average variable costs do not vary with the quantity of output. If
Pat purchases two mixers, her average fixed cost _____ in the range of output between
100 and 400 cakes.
A)
increases
B)
decreases
C)
remains the same
D)
can’t be calculated
Page 52
225.
(Table: Cakes) Look at the table Cakes. Pat is opening a bakery to make and sell special
birthday cakes. She is trying to decide how many mixers to purchase. Her estimated
fixed and average variable costs if she purchases one, two, or three mixers are shown in
the table. Assume that average variable costs do not vary with the quantity of output. If
Pat purchases two mixers, her average total cost _____ in the range of output between
100 and 400 cakes.
A)
increases
B)
decreases
C)
remains the same
D)
can’t be calculated
226.
(Table: Cakes) Look at the table Cakes. Pat is opening a bakery to make and sell special
birthday cakes. She is trying to decide how many mixers to purchase. Her estimated
fixed and average variable costs if she purchases one, two, or three mixers are shown in
the table. Assume that average variable costs do not vary with the quantity of output. If
Pat purchases three mixers and bakes 100 cakes per day, what is her average fixed cost?
A)
$4
B)
$25
C)
$2,496
D)
$10,000
227.
(Table: Cakes) Look at the table Cakes. Pat is opening a bakery to make and sell special
birthday cakes. She is trying to decide how many mixers to purchase. Her estimated
fixed and average variable costs if she purchases one, two, or three mixers are shown in
the table. Assume that average variable costs do not vary with the quantity of output. If
Pat purchases three mixers and bakes 100 cakes per day, what is her average total cost?
A)
$4
B)
$25
C)
$29
D)
$625
228.
(Table: Cakes) Look at the table Cakes. Pat is opening a bakery to make and sell special
birthday cakes. She is trying to decide how many mixers to purchase. Her estimated
fixed and average variable costs if she purchases one, two, or three mixers are shown in
the table. Assume that average variable costs do not vary with the quantity of output. If
Pat purchases three mixers and bakes 200 cakes per day, what is her average fixed cost?
A)
$0.05
B)
$2.50
C)
$5.00
D)
$12.50
Page 53
229.
(Table: Cakes) Look at the table Cakes. Pat is opening a bakery to make and sell special
birthday cakes. She is trying to decide how many mixers to purchase. Her estimated
fixed and average variable costs if she purchases one, two, or three mixers are shown in
the table. Assume that average variable costs do not vary with the quantity of output. If
Pat purchases three mixers and bakes 200 cakes per day, what is her average total cost?
A)
$50.00
B)
$12.50
C)
$16.50
D)
$800.00
230.
(Table: Cakes) Look at the table Cakes. Pat is opening a bakery to make and sell special
birthday cakes. She is trying to decide how many mixers to purchase. Her estimated
fixed and average variable costs if she purchases one, two, or three mixers are shown in
the table. Assume that average variable costs do not vary with the quantity of output. If
Pat purchases three mixers and bakes 400 cakes per day, what is her average fixed cost?
A)
$0.05
B)
$2.50
C)
$5.00
D)
$6.25
231.
(Table: Cakes) Look at the table Cakes. Pat is opening a bakery to make and sell special
birthday cakes. She is trying to decide how many mixers to purchase. Her estimated
fixed and average variable costs if she purchases one, two, or three mixers are shown in
the table. Assume that average variable costs do not vary with the quantity of output. If
Pat purchases three mixers and bakes 400 cakes per day, what is her average total cost?
A)
$10.25
B)
$12.50
C)
$16.50
D)
$2,504.00
232.
(Table: Cakes) Look at the table Cakes. Pat is opening a bakery to make and sell special
birthday cakes. She is trying to decide how many mixers to purchase. Her estimated
fixed and average variable costs if she purchases one, two, or three mixers are shown in
the table. Assume that average variable costs do not vary with the quantity of output. If
Pat purchases three mixers, her average fixed cost _____ in the range of output between
100 and 400 cakes.
A)
increases
B)
decreases
C)
remains the same
D)
can’t be calculated
Page 54
233.
(Table: Cakes) Look at the table Cakes. Pat is opening a bakery to make and sell special
birthday cakes. She is trying to decide how many mixers to purchase. Her estimated
fixed and average variable costs if she purchases one, two, or three mixers are shown in
the table. Assume that average variable costs do not vary with the quantity of output. If
Pat purchases three mixers, her average total cost _____ in the range of output between
100 and 400 cakes.
A)
increases
B)
decreases
C)
remains the same
D)
can’t be calculated
234.
(Table: Cakes) Look at the table Cakes. Pat is opening a bakery to make and sell special
birthday cakes. She is trying to decide how many mixers to purchase. Her estimated
fixed and average variable costs if she purchases one, two, or three mixers are shown in
the table. Assume that average variable costs do not vary with the quantity of output.
How many mixers should Pat buy to get the lowest average total cost if she plans to
make 100 cakes?
A)
one
B)
two
C)
three
D)
Can’t be determined without more information
235.
(Table: Cakes) Look at the table Cakes. Pat is opening a bakery to make and sell special
birthday cakes. She is trying to decide how many mixers to purchase. Her estimated
fixed and average variable costs if she purchases one, two, or three mixers are shown in
the table. Assume that average variable costs do not vary with the quantity of output.
How many mixers should Pat buy to get the lowest average total cost if she plans to
make 200 cakes?
A)
one
B)
two
C)
three
D)
Can’t be determined without more information

Page 55
236.
(Table: Cakes) Look at the table Cakes. Pat is opening a bakery to make and sell special
birthday cakes. She is trying to decide how many mixers to purchase. Her estimated
fixed and average variable costs if she purchases one, two, or three mixers are shown in
the table. Assume that average variable costs do not vary with the quantity of output.
How many mixers should Pat buy to get the lowest average total cost if she plans to
make 400 cakes?
A)
one
B)
two
C)
three
D)
Can’t be determined without more information
237.
The long-run average cost curve will be upward-sloping when the firm has:
A)
economies of scale.
B)
diseconomies of scale.
C)
constant returns to scale.
D)
diminishing returns.
Use the following to answer question 238:
Table: Long-Run Total Cost
Quantity of
Soybeans
(bushels)
Long-Run
Total Cost
1
$ 50
2
80
3
90
4
120
5
200
6
300
238.
(Table: Long-Run Total Cost) Look at the table Long-Run Total Cost. This soybean
grower receives constant returns to scale over the _____ and _____ bushels.
A)
first; second
B)
third; fourth
C)
fourth; fifth
D)
fifth; sixth
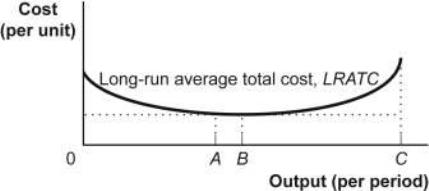
Page 56
239.
When an increase in the firm’s output reduces its long-run average total cost, it achieves
_____ scale.
A)
economies of
B)
diseconomies of
C)
constant returns to
D)
variable returns to
240.
A university that benefits from lower costs per enrolled student as it builds more
buildings and enrolls more students is an example of a service provider with:
A)
economies of scale.
B)
diseconomies of scale.
C)
increasing opportunity costs.
D)
scale reduction.
241.
The slope of a long-run average total cost curve exhibiting diseconomies of scale is:
A)
zero.
B)
infinite.
C)
positive.
D)
negative.
242.
When diseconomies of scale occur:
A)
long-run average cost rises.
B)
marginal cost declines.
C)
average total cost declines.
D)
average variable cost declines.
Use the following to answer questions 243-247:
Figure: Long-Run Average Cost
Page 57
243.
(Figure: Long-Run Average Cost) Look at the figure Long-Run Average Cost. This firm
has _____ in the output region from 0 to A.
A)
diseconomies of scale
B)
constant returns to scale
C)
economies of scale
D)
negative costs of production
244.
(Figure: Long-Run Average Cost) Look at the figure Long-Run Average Cost. This firm
has _____ in the output region from A to B.
A)
constant returns to scale
B)
economies of scale
C)
diseconomies of scale
D)
constant total cost as output increases
245.
(Figure: Long-Run Average Cost) Look at the figure Long-Run Average Cost. This firm
has _____ in the output region from B to C.
A)
constant returns to scale
B)
diseconomies of scale
C)
economies of scale
D)
falling marginal cost
246.
(Figure: Long-Run Average Cost) Look at the figure Long-Run Average Cost. This firm
has _____ in the output region from 0 to A.
A)
decreasing returns to scale
B)
constant returns to scale
C)
increasing returns to scale
D)
negative costs of production
247.
(Figure: Long-Run Average Cost) Look at the figure Long-Run Average Cost. This firm
has _____ in the output region from B to C.
A)
constant returns to scale
B)
decreasing returns to scale
C)
increasing returns to scale
D)
falling marginal cost
Page 58
248.
A firm that is able to use its inputs more efficiently as it increases production in the long
run best demonstrates:
A)
economies of scale.
B)
diseconomies of scale.
C)
labor-intensive production.
D)
capital-intensive production.
249.
A firm that has diminishing returns in the management’s ability to use and disseminate
information as it increases production in the long run best demonstrates:
A)
economies of scale.
B)
diseconomies of scale.
C)
being too small for the relevant market.
D)
not having enough managers.
250.
It is common in large breweries for the long-run average total cost to decline as output
increases. This indicates that many breweries operate with:
A)
diseconomies of scale.
B)
diminishing marginal returns.
C)
economies of scale.
D)
constant returns to scale.
251.
Buffalo Aircraft doubles the amount of all of the inputs it uses—the factory doubles in
size and twice as many workers are hired. After this expansion, the number of aircraft
produced triples. If the price of inputs is unchanged, this means that Buffalo Aircraft is
operating with:
A)
increasing marginal cost.
B)
economies of scale.
C)
increasing average total cost.
D)
decreasing average variable cost.
252.
The long-run average total cost of producing 100 units of output is $4, while the
long-run average cost of producing 110 units of output is $4. These numbers suggest
that the firm producing this output has:
A)
economies of scale.
B)
diseconomies of scale.
C)
constant returns to scale.
D)
diminishing returns.
Page 59
253.
The U shape of the long-run average total cost curve is primarily due to:
A)
technological change.
B)
economies and diseconomies of scale.
C)
increasing and then diminishing returns.
D)
diminishing returns.
254.
When an increase in the firm’s output reduces its long-run average total cost, it has
_____ returns to scale.
A)
increasing
B)
decreasing
C)
constant
D)
variable
255.
If your firm is operating in the negatively sloped portion of a long-run average total cost
curve, then your production exhibits:
A)
higher wages.
B)
increasing returns to scale.
C)
decreasing returns to scale.
D)
increased input prices.
256.
A manufacturing company that benefits from lower costs per unit as it grows is an
example of a firm exhibiting:
A)
increasing returns to scale.
B)
decreasing returns to scale.
C)
increasing opportunity costs.
D)
scale reduction.
257.
A firm that has lower costs per unit as it increases production in the long run has:
A)
increasing returns to scale.
B)
decreasing returns to scale.
C)
increasing opportunity costs.
D)
scale reduction.
258.
The slope of a long-run average total cost curve exhibiting decreasing returns to scale is:
A)
zero.
B)
infinite.
C)
positive.
D)
negative.
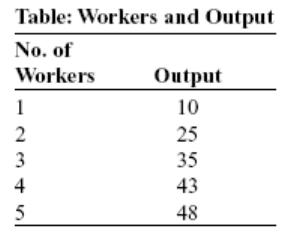
Page 60
259.
Decreasing and increasing returns to scale account for the shape of the:
A)
short-run average total cost curve.
B)
short-run average variable cost curve.
C)
long-run average total cost curve.
D)
marginal cost curve in both the short run and the long run.
260.
The slope of a long-run average total cost curve exhibiting increasing returns to scale is:
A)
zero.
B)
infinite.
C)
positive.
D)
negative.
Use the following to answer questions 261-268:
261.
(Table: Workers and Output) Look at the table Workers and Output. After graduation
you achieve your dream of opening an art shop that specializes in selling mud statues.
You pay $10 per day on a loan from your uncle, and regardless of how much you
produce, you pay $10 per day to each of the workers who make the mud statues. The
fixed cost of producing 25 statues is:
A)
$10.
B)
$20.
C)
$25.
D)
$35.
Page 61
262.
(Table: Workers and Output) Look at the table Workers and Output. After graduation
you achieve your dream of opening an art shop that specializes in selling mud statues.
You pay $10 per day on a loan from your uncle, and regardless of how much you
produce, you pay $10 per day to each of the workers who make the mud statues. The
variable cost of producing 25 statues is:
A)
$10.
B)
$20.
C)
$25.
D)
$35.
263.
(Table: Workers and Output) Look at the table Workers and Output. After graduation
you achieve your dream of opening an art shop that specializes in selling mud statues.
You pay $10 per day on a loan from your uncle, and regardless of how much you
produce, you pay $10 per day to each of the workers who make the mud statues. The
total cost of producing 25 statues is:
A)
$10.
B)
$20.
C)
$25.
D)
$30.
264.
(Table: Workers and Output) Look at the table Workers and Output. After graduation
you achieve your dream of opening an art shop that specializes in selling mud statues.
You pay $10 per day on a loan from your uncle, and regardless of how much you
produce, you pay $10 per day to each of the workers who make the mud statues. The
variable cost of producing 43 statues is:
A)
$10.
B)
$20.
C)
$40.
D)
$43.
265.
(Table: Workers and Output) Look at the table Workers and Output. After graduation
you achieve your dream of opening an art shop that specializes in selling mud statues.
You pay $10 per day on a loan from your uncle, and regardless of how much you
produce, you pay $10 per day to each of the workers who make the mud statues. The
total cost of producing 43 statues is:
A)
$10.
B)
$20.
C)
$40.
D)
$50.
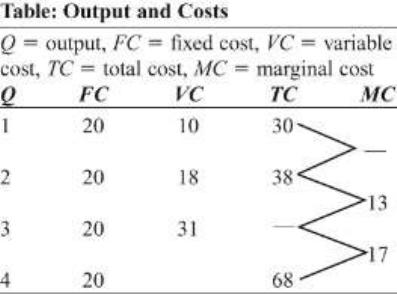
Page 62
266.
(Table: Workers and Output) Look at the table Workers and Output. After graduation
you achieve your dream of opening an art shop that specializes in selling mud statues.
You pay $10 per day on a loan from your uncle, and regardless of how much you
produce, you pay $10 per day to each of the workers who make the mud statues. The
variable cost of producing 48 statues is:
A)
$50.
B)
$48.
C)
$20.
D)
$10.
267.
(Table: Workers and Output) Look at the table Workers and Output. After graduation
you achieve your dream of opening an art shop that specializes in selling mud statues.
You pay $10 per day on a loan from your uncle, and regardless of how much you
produce, you pay $10 per day to each of the workers who make the mud statues. The
total cost of producing 48 statues is:
A)
$240.
B)
$60.
C)
$50.
D)
$10.
268.
(Table: Workers and Output) Look at the table Workers and Output. After graduation
you achieve your dream of opening an art shop that specializes in selling mud statues.
You pay $10 per day on a loan from your uncle, and regardless of how much you
produce, you pay $10 per day to each of the workers who make the mud statues. How
many workers should you hire to minimize your marginal costs?
A)
two
B)
three
C)
four
D)
five
Use the following to answer questions 269-271:
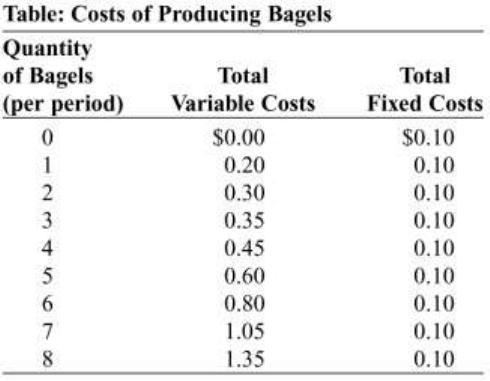
Page 63
269.
(Table: Output and Costs) Look at the table Output and Costs. When output increases
from 1 to 2, marginal cost equals:
A)
$13.
B)
$10.
C)
$8.
D)
$17.
270.
(Table: Output and Costs) Look at the table Output and Costs. When output is 4, total
variable cost equals:
A)
$48.
B)
$38.
C)
$58.
D)
$28.
271.
(Table: Output and Costs) Look at the table Output and Costs. When output is 3,
average total cost equals:
A)
$13.
B)
$10.
C)
$8.
D)
$17.
Use the following to answer questions 272-279:
Page 64
272.
(Table: Costs of Producing Bagels) Look at the table Cost of Producing Bagels. The
total cost of producing 6 bagels is:
A)
$0.10.
B)
$0.20.
C)
$0.80.
D)
$0.90.
273.
(Table: Costs of Producing Bagels) Look at the table Cost of Producing Bagels. The
marginal cost of producing the sixth bagel is:
A)
$0.10.
B)
$0.15.
C)
$0.20.
D)
$0.80.
274.
(Table: Costs of Producing Bagels) Look at the table Cost of Producing Bagels.
Marginal cost reaches its minimum value for the _____ bagel.
A)
first
B)
third
C)
fourth
D)
fifth
275.
(Table: Costs of Producing Bagels) Look at the table Cost of Producing Bagels. Average
total cost reaches its minimum value for the _____ bagel.
A)
first
B)
third
C)
fourth
D)
fifth
276.
(Table: Costs of Producing Bagels) Look at the table Cost of Producing Bagels. The
average total cost of producing 6 bagels is:
A)
$0.10.
B)
$0.15.
C)
$0.20.
D)
$0.80.
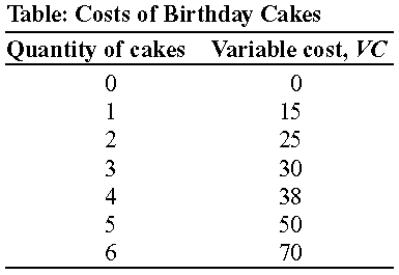
Page 65
277.
(Table: Costs of Producing Bagels) Look at the table Cost of Producing Bagels. The
total cost of producing 2 bagels is:
A)
$0.10.
B)
$0.20.
C)
$0.40.
D)
$0.50.
278.
(Table: Costs of Producing Bagels) Look at the table Cost of Producing Bagels. The
average total cost of producing 2 bagels is:
A)
$0.05.
B)
$0.10.
C)
$0.20.
D)
$0.40.
279.
(Table: Costs of Producing Bagels) Look at the table Cost of Producing Bagels. The
marginal cost of producing the second bagel is:
A)
$0.05.
B)
$0.10.
C)
$0.30.
D)
$0.40.
Use the following to answer questions 280-294:
280.
(Table: Costs of Birthday Cakes) Look at the table Costs of Birthday Cakes. Assume
that fixed costs are $10. What is the average variable cost of 2 cakes?
A)
$40.00
B)
$35.00
C)
$25.00
D)
$12.50
Page 66
281.
(Table: Costs of Birthday Cakes) Look at the table Costs of Birthday Cakes. Assume
that fixed costs are $10. What is the average fixed cost of 2 cakes?
A)
$5
B)
$10
C)
$25
D)
$30
282.
(Table: Costs of Birthday Cakes) Look at the table Costs of Birthday Cakes. Assume
that fixed costs are $10. What is the average total cost of 2 cakes?
A)
$35.00
B)
$25.00
C)
$17.50
D)
$12.50
283.
(Table: Costs of Birthday Cakes) Look at the table Costs of Birthday Cakes. Assume
that fixed costs are $10. What is the marginal cost of the second cake?
A)
$5
B)
$10
C)
$25
D)
$35
284.
(Table: Costs of Birthday Cakes) Look at the table Costs of Birthday Cakes. Assume
that fixed costs are $10. What is the average variable cost of 4 cakes?
A)
$38.00
B)
$10.00
C)
$9.50
D)
$8.00
285.
(Table: Costs of Birthday Cakes) Look at the table Costs of Birthday Cakes. Assume
that fixed costs are $10. What is the average fixed cost of 4 cakes?
A)
$48.00
B)
$10.00
C)
$5.00
D)
$2.50
Page 67
286.
(Table: Costs of Birthday Cakes) Look at the table Costs of Birthday Cakes. Assume
that fixed costs are $10. What is the average total cost of 4 cakes?
A)
$35.00
B)
$25.00
C)
$9.50
D)
$12.00
287.
(Table: Costs of Birthday Cakes) Look at the table Costs of Birthday Cakes. Assume
that fixed costs are $10. What is the marginal cost of the fourth cake?
A)
$8
B)
$10
C)
$25
D)
$35
288.
(Table: Costs of Birthday Cakes) Look at the table Costs of Birthday Cakes. Assume
that fixed costs are $10. What is the average variable cost of 5 cakes?
A)
$300
B)
$250
C)
$50
D)
$10
289.
(Table: Costs of Birthday Cakes) Look at the table Costs of Birthday Cakes. Assume
that fixed costs are $10. What is the average fixed cost of 5 cakes?
A)
$1
B)
$2
C)
$5
D)
$10
290.
(Table: Costs of Birthday Cakes) Look at the table Costs of Birthday Cakes. Assume
that fixed costs are $10. What is the average total cost of 5 cakes?
A)
$110
B)
$60
C)
$12
D)
$2
Page 68
291.
(Table: Costs of Birthday Cakes) Look at the table Costs of Birthday Cakes. Assume
that fixed costs are $10. What is the marginal cost of the fifth cake?
A)
$2
B)
$10
C)
$12
D)
$20
292.
(Table: Costs of Birthday Cakes) Look at the table Costs of Birthday Cakes. Assume
that fixed costs are $10. The point of diminishing returns occurs at output of:
A)
2.
B)
3.
C)
4.
D)
5.
293.
(Table: Costs of Birthday Cakes) Look at the table Costs of Birthday Cakes. Assume
that fixed costs are $10. The minimum average variable cost occurs at output of:
A)
2.
B)
3.
C)
4.
D)
5.
294.
(Table: Costs of Birthday Cakes) Look at the table Costs of Birthday Cakes. Assume
that fixed costs are $10. The minimum average total cost occurs at output of:
A)
6.
B)
5.
C)
3.
D)
2.
295.
Farmers in the United States grow about three times as much wheat per acre as do
farmers in Western Europe.
A)
True
B)
False
296.
Scott operates a business that takes people on boat tours in Crystal River, Florida. The
amount of fuel Scott uses each day is a variable input.
A)
True
B)
False

Page 69
297.
In the long run, every input available to a manufacturer is a fixed input.
A)
True
B)
False
298.
Joan adds one more employee to her construction company. The additional output
produced by this employee represents the average product of this employee.
A)
True
B)
False
299.
The total product curve for the Wallmark Greeting Card Company shows how the
quantity of output depends on the quantity of the variable input for a given amount of
the fixed inputs.
A)
True
B)
False
300.
The slope of the total product curve is equal to the average product of labor.
A)
True
B)
False
301.
As more labor is added to a fixed amount of capital, eventually the marginal product of
labor decreases.
A)
True
B)
False
302.
When returns are diminishing, the marginal cost curve is upward-sloping.
A)
True
B)
False
303.
As a firm increases production in the short run, the marginal cost of output increases
because the marginal product of the variable input decreases.
A)
True
B)
False
304.
The short-run average total cost curve is -shaped because at low output levels the
spreading effect of falling average fixed costs dominates the diminishing returns effect,
while at high output levels the reverse is true.
A)
True
B)
False
Page 70
305.
In the short run, the average total cost curve always lies above the average variable cost
curve.
A)
True
B)
False
306.
If the average total cost curve and the average variable cost curve are both U-shaped,
then the minimum point of the average total cost curve must lie above the minimum
point of the average variable cost curve.
A)
True
B)
False
307.
If average total cost is declining, marginal cost cannot be increasing.
A)
True
B)
False
308.
In the short run, if marginal cost is higher than average total cost, producing an extra
unit of output must raise average total cost.
A)
True
B)
False
309.
In the short run, the average total cost curve reaches its minimum point at a lower level
of output than the short-run marginal cost curve reaches its minimum.
A)
True
B)
False
310.
In some complex production processes, such as nuclear power plants, some inputs have
to be treated as being fixed even in the long run.
A)
True
B)
False
311.
In the long run, some of a firm’s costs are fixed, while others are variable.
A)
True
B)
False
Page 71
312.
Firms choose their level of fixed cost in the long run based on the amount of output that
they expect to produce.
A)
True
B)
False
313.
When a firm adds physical capital, its fixed cost will decrease in the short run.
A)
True
B)
False
314.
When a firm adds physical capital, labor will become more productive in the short run.
A)
True
B)
False
315.
When a firm adds physical capital, its variable cost will decrease in the long run.
A)
True
B)
False
316.
The long run is the period during which fixed costs do not change.
A)
True
B)
False
317.
In the long run, when a firm adds physical capital, workers become more productive,
so variable costs increase.
A)
True
B)
False
318.
The long-run average total cost curve shows the relationship between output and the
average total cost when fixed cost has been chosen to minimize average total cost for
each level of output.
A)
True
B)
False
319.
The long-run average total cost curve shows the relationship between output and the
average total cost when variable cost has been chosen to minimize average total cost for
each level of output.
A)
True
B)
False
Page 72
320.
A firm always operates at some point on its long-run average total cost curve in both the
long run and the short run.
A)
True
B)
False
321.
If output increases, a firm will move along its short-run average total cost curve in the
short run until it has time to adjust its fixed cost.
A)
True
B)
False
322.
The long-run average cost curve is tangent to a series of short-run average fixed cost
curves.
A)
True
B)
False
323.
The long-run average cost curve is tangent to a series of short-run average total cost
curves.
A)
True
B)
False
324.
If a firm has to increase output suddenly to meet an increase in demand, its average total
cost will increase in the short run until it has time to add physical capital.
A)
True
B)
False
325.
If a firm has to increase output suddenly to meet an increase in demand, its average total
cost will decrease in the short run until it has time to add physical capital.
A)
True
B)
False
326.
When a firm has to increase its output, average total costs will increase in the short run
and then decrease in the long run, after the firm has time to add physical capital.
A)
True
B)
False
Page 73
327.
When a firm has to increase its output, average total costs will decrease in the short run
and then increase in the long run after the firm has time to add physical capital.
A)
True
B)
False
328.
Scale is the size of a firm’s operations.
A)
True
B)
False
329.
When the long-run average total cost curve is downward-sloping as output increases, the
firm has diseconomies of scale.
A)
True
B)
False
330.
When long-run average total cost is constant as output increases, the firm has constant
returns to scale.
A)
True
B)
False
331.
When the long-run average total cost curve is upward-sloping as output increases, the
firm has diseconomies of scale.
A)
True
B)
False
332.
Economies of scale are often the result of increased specialization, which can occur
when output levels increase.
A)
True
B)
False
333.
Economies of scale most often occur in industries whose initial fixed cost of plant and
equipment is low.
A)
True
B)
False
334.
A production function that is characterized by economies of scale will not be subject to
the operation of diminishing returns.
A)
True
B)
False
Page 74
335.
Diminishing returns are one explanation for diseconomies of scale.
A)
True
B)
False
336.
If a firm builds a larger plant and increases output and if its long-run average total cost
does not change, the firm has constant returns to scale.
A)
True
B)
False
337.
The advantage of specialization in production is one of the primary reasons for
decreasing returns to scale.
A)
True
B)
False
338.
In the short run, why is it believed that the total product curve increases at a decreasing
rate when more labor is added to the production function?
339.
Some people say, “There are too many cooks in the kitchen,” to describe any chaotic
scene where nothing gets done. Relate this phrase to short-run production functions.
340.
Suppose a short-run production function always increases at a constant rate of three
units of output for every additional worker added. What does this imply about the
marginal product of labor? Is this realistic? Explain.
341.
It is time to pay the bills. You pay the rent, the basic cable bill, the electricity bill, and
your grocery bill. Which of these are good examples of fixed costs and which are
variable costs? Explain your reasoning.
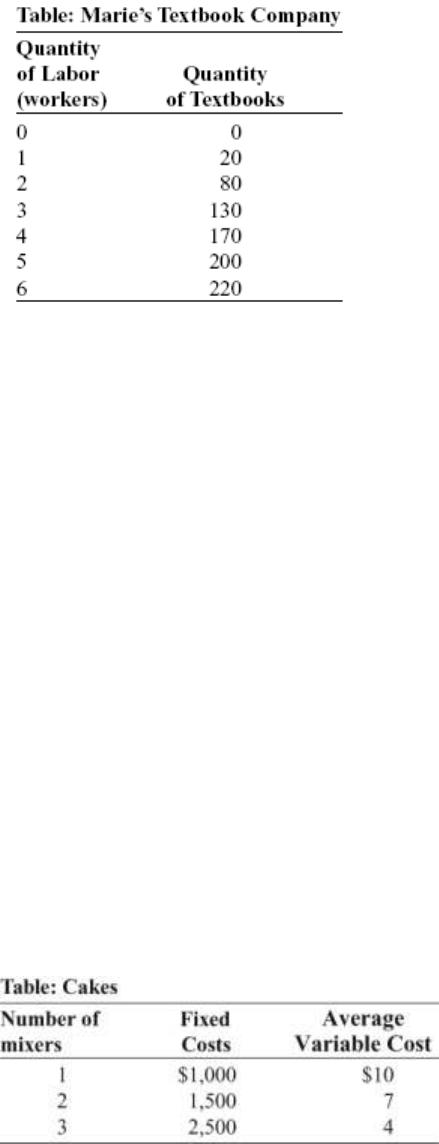
Page 75
Use the following to answer question 342:
342.
(Table: Marie’s Textbook Company) Look at the table Marie’s Textbook Company.
Marie has fixed costs of $500 per month and hires workers for $2,000 each per month.
With as much precision as possible, calculate the following:
A) total cost of production when four workers are employed
B) the output level that produces the lowest average total cost
C) the price that Marie must charge to break even on the production of 130 textbooks
343.
Describe the shape of the AFC curve and explain why it takes this shape. Can AFC ever
intersect the x-axis?
344.
Consider the statement, “When the marginal cost is rising, the average total cost must
also be rising.” Is this statement true or false? Explain your reasoning.
345.
A firm employs capital as a fixed input and labor as a variable input in the short run. If
the cost of capital falls, what will happen to the AVC, ATC, and MC curves? Explain.
Use the following to answer questions 346-347:

Page 76
346.
(Table: Cakes) Look at the table Cakes. Pat is opening a bakery to make and sell special
birthday cakes. Her estimated fixed and average variable costs if she purchases one,
two, or three mixers are shown in the table. Assume that average variable costs do not
vary with the quantity of output. Suppose that Pat used to produce 100 cakes, but she
has a sudden increase in demand, so that she begins to produce 200 cakes. Explain how
her average total cost will change in the short run and in the long run.
347.
(Table: Cakes) Look at the table Cakes. Pat is opening a bakery to make and sell special
birthday cakes. Her estimated fixed and average variable costs if she purchases one,
two, or three mixers are shown in the table. Assume that average variable costs do not
vary with the quantity of output. Suppose that Pat used to produce 200 cakes, but she
has a sudden increase in demand, so that she begins to produce 400 cakes. Explain how
her average total cost will change in the short run and in the long run.
348.
What are some factors that contribute to a firm achieving increasing returns to scale (or
economies of scale) in the long run?
Use the following to answer question 349:
Table: Marie’s Production and Costs
Quantity of
Labor (workers)
Quantity of
Textbooks
VC
TC
MC
0
0
—
1
20
2
80
3
130
4
170
5
200
6
220
349.
(Table: Marie’s Production and Costs) Look at the table Marie’s Production and Costs.
Marie has fixed costs of $500 per month and hires workers for $2,000 each per month.
Some of Marie’s monthly production and cost information is in the accompanying table.
Calculate the missing information and complete the table.
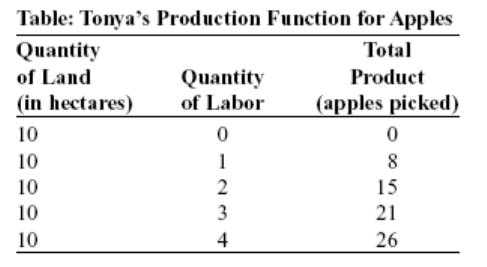
Page 77
350.
The production function provides information about:
A)
a firm’s profit level.
B)
the transformation of inputs into output.
C)
the location of the firm’s production.
D)
a firm’s market structure.
351.
The level of inputs a firm employs will determine a firm’s:
A)
ability to produce output.
B)
elasticity of demand.
C)
stock price.
D)
location of production.
Use the following to answer questions 352-356:
352.
(Table: Tonya’s Production Function for Apples) Look at the table Tonya’s Production
Function for Apples. Tonya is operating:
A)
in the long run.
B)
in the short run.
C)
in a very expensive location.
D)
at a loss.
353.
(Table: Tonya’s Production Function for Apples) Look at the table Tonya’s Production
Function for Apples. Tonya’s fixed:
A)
input is land.
B)
input is labor.
C)
inputs are land and labor.
D)
inputs are neither land nor labor.
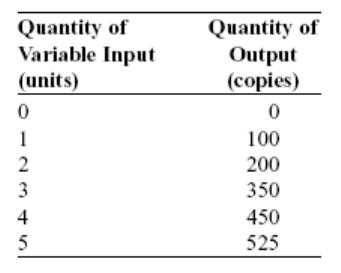
Page 78
354.
(Table: Tonya’s Production Function for Apples) Look at the table Tonya’s Production
Function for Apples. Tonya’s variable:
A)
input is land.
B)
input is labor.
C)
inputs are land and labor.
D)
inputs are neither land nor labor.
355.
(Table: Tonya’s Production Function for Apples) Look at the table Tonya’s Production
Function for Apples. As she hires more labor, Tonya’s production function shows that
the number of apples picked increases at a decreasing rate because of:
A)
diminishing returns.
B)
increasing returns.
C)
constant returns.
D)
workers becoming lazier.
356.
(Table: Tonya’s Production Function for Apples) Look at the table Tonya’s Production
Function for Apples. The marginal product of the fourth worker is _____ apples.
A)
7
B)
26
C)
5
D)
21
357.
With one input fixed, a firm will find that as it attempts to produce more, the total
product curve increases at a decreasing rate and its marginal product curve is:
A)
downward-sloping.
B)
upward-sloping.
C)
constant and horizontal at the marginal product axis.
D)
constant and vertical at the quantity axis.
Use the following to answer question 358:
Table: Linda’s Copy Shop Production
Page 79
358.
(Table: Linda’s Copy Shop Production) Look at the table Linda’s Copy Shop Production.
Linda’s production runs into diminishing returns to her variable inputs when she
employs the _____ unit.
A)
second
B)
third
C)
fourth
D)
fifth
359.
Janet’s poodle grooming salon has a total cost curve expressed by the equation TC = 100
+ 3Q2, where Q is the quantity of dogs groomed. Given this expression, Janet is
operating in the:
A)
long run.
B)
short run, and her fixed costs are $100.
C)
long run, and her fixed costs are $100.
D)
short run, and there are no fixed costs.
360.
Janet’s poodle grooming salon has a total cost curve expressed by the equation TC = 100
+ 3Q2, where Q is the quantity of dogs groomed. Given this expression, if Janet grooms
five dogs, her total costs will be:
A)
$100.
B)
$175.
C)
$225.
D)
$75.
361.
Janet’s poodle grooming salon has a total cost curve expressed by the equation TC = 100
+ 3Q2, where Q is the quantity of dogs groomed. Janet notices that as she grooms more
dogs, her total cost curve:
A)
becomes steeper.
B)
becomes flatter.
C)
stays constant.
D)
becomes steeper and then becomes horizontal.
362.
A firm’s total fixed cost:
A)
stays constant in the short run.
B)
falls as the firm produces more output in the short run.
C)
falls as the firm produces more output in the long run.
D)
increases as the firm produces more output.

Page 80
Use the following to answer questions 363-366:
Table: Lindsay’s Farm
The table provides information about the production function
for Lindsay’s Farm, which uses labor and land to grow its
crops. The price of labor is $50 per worker per week and the
price of the land is $20 per acre.
Quantity of Land
(acres)
Quantity of Labor
(workers)
Quantity of Produce
(bushels)
10
0
0
10
1
50
10
2
100
10
3
140
10
4
170
10
5
190
363.
(Table: Lindsay’s Farm) Look at the table Lindsay’s Farm. Lindsay’s fixed cost of
production is:
A)
$200.
B)
$450.
C)
$2,500.
D)
$2,700.
364.
(Table: Lindsay’s Farm) Look at the table Lindsay’s Farm. Lindsay’s variable costs of
production:
A)
stay constant.
B)
are equal to 10.
C)
are zero when she produces no crops.
D)
fall as soon as she starts producing.
365.
(Table: Lindsay’s Farm) Look at the table Lindsay’s Farm. When Lindsay produces 140
units of produce, her total cost is:
A)
$200.
B)
$150.
C)
$350.
D)
$500.

Page 81
366.
(Table: Lindsay’s Farm) Look at the table Lindsay’s Farm. When Lindsay produces 50
units of produce, her total cost is:
A)
$250.
B)
$50.
C)
$200.
D)
$350.
Use the following to answer questions 367-370:
Table: Bonnie’s Production Function for Good Z
The table describes Bonnie’s production
function for good Z. Assume labor is the only
variable input Bonnie uses to produce good Z.
Quantity of Land
(acres)
Quantity of Labor
(workers)
0
0
1
75
2
150
3
250
4
325
5
375
367.
(Table: Bonnie’s Production Function for Good Z) Look at the table Bonnie’s Production
Function for Good Z. The marginal product of labor of the second worker is _____ units
of good Z.
A)
150
B)
225
C)
75
D)
250
368.
(Table: Bonnie’s Production Function for Good Z) Look at the table Bonnie’s Production
Function for Good Z. Diminishing returns to labor occurs when Bonnie hires the _____
worker.
A)
second
B)
third
C)
fourth
D)
fifth
Page 82
369.
(Table: Bonnie’s Production Function for Good Z) Look at the table Bonnie’s Production
Function for Good Z. Suppose Bonnie spends $300 per month to rent the building, $100
per month on insurance, and $100 per worker per month. Given this information,
Bonnie’s monthly fixed costs equal:
A)
$400.
B)
$300.
C)
$500.
D)
$100.
370.
(Table: Bonnie’s Production Function for Good Z) Look at the table Bonnie’s Production
Function for Good Z. The costs that vary with Bonnie’s level of production are her:
A)
fixed costs.
B)
variable costs.
C)
rent and insurance.
D)
costs that remain the same regardless of what she produces.
371.
Diminishing returns are a reason:
A)
the marginal cost curve is downward-sloping.
B)
fixed costs remain constant.
C)
the marginal cost curve is upward-sloping.
D)
the average fixed cost curve is downward-sloping.
372.
When a firm produces a small amount of output, the spreading effect:
A)
is stronger than the diminishing returns effect.
B)
is weaker than the diminishing returns effect.
C)
and diminishing returns effect are equal.
D)
is zero.
373.
As production increases and the fixed cost is divided by larger quantities of output,
average fixed cost drops. This is referred to as the _____ effect.
A)
diminishing returns
B)
spreading
C)
constant cost
D)
increasing returns
374.
The eventual increase in AVC as output increases is the _____ effect.
A)
diminishing returns
B)
spreading
C)
constant cost
D)
increasing returns
Page 83
375.
If ATC is equal to MC, then the firm is operating:
A)
at the minimum point of ATC.
B)
on the downward-sloping portion of ATC.
C)
on the upward-sloping portion of ATC.
D)
at an increasing returns to scale.
376.
The curve that illustrates the relationship between output and average total cost when
the fixed cost has been chosen to minimize average total cost for each level of output is
the _____ curve.
A)
short-run average total cost
B)
long-run average total cost
C)
marginal cost
D)
total product
377.
When all of a firm’s inputs are doubled, input prices do not change, and this results in
the firm’s level of production more than doubling, a firm is operating:
A)
on the upward-sloping portion of its long-run average total cost curve.
B)
on the downward-sloping portion of its long-run average total cost curve.
C)
at the minimum of its long-run average total cost curve.
D)
on the upward-sloping portion of its marginal cost curve.
378.
A firm’s long-run average total costs increase as it produces more output. This firm has:
A)
economies of scale.
B)
constant returns to scale.
C)
diseconomies of scale.
D)
a spreading effect.
379.
Economies and diseconomies of scale are associated with the:
A)
long-run average total cost curve and the long run.
B)
short-run average total cost curve and the short run.
C)
marginal cost curve and both the long and short run.
D)
average fixed cost curve and the short run.
Page 85
Page 86
Page 87
Page 88
Page 89
Page 90
Page 91
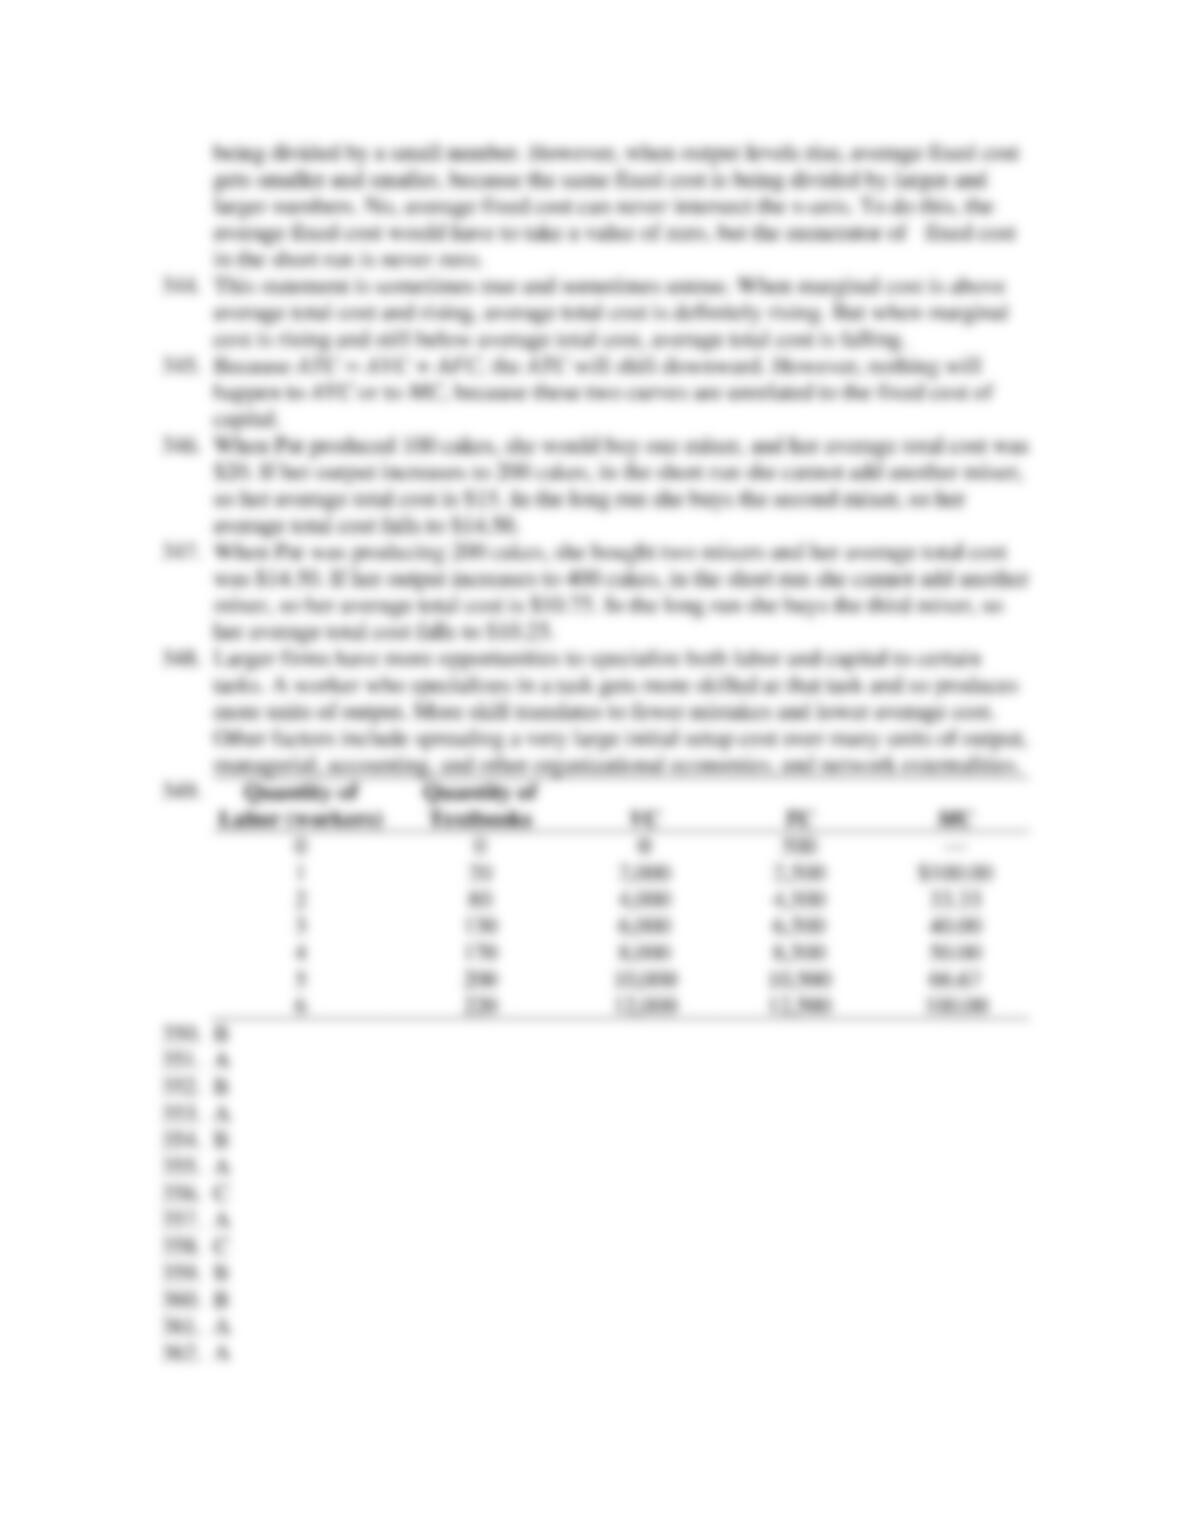
Page 92
Page 93