Exam
Name___________________________________
MULTIPLE CHOICE. Choose the one alternative that best completes the statement or answers the question.
Provide an appropriate response.
1)
A researcher is interested in estimating the proportion of voters who favor a tax on e–commerce.
Based on a sample of 250 people, she obtains the following 99% confidence interval for the
population proportion p:
0.113 < p < 0.171
Which of the statements below is a valid interpretation of this confidence interval?
1)
A)
If many different samples of size 250 were selected and, based on each sample, a confidence
interval were constructed, 99% of the time the true value of p would lie between 0.113 and
0.171
B)
If many different samples of size 250 were selected and, based on each sample, a confidence
interval were constructed, in the long run 99% of the confidence intervals would contain the
true value of p.
C)
If 100 different samples of size 250 were selected and, based on each sample, a confidence
interval were constructed, exactly 99 of these confidence intervals would contain the true
value of p.
D)
There is a 99% chance that the true value of p lies between 0.113 and 0.171
2)
The college daily reported: “450 students living in university housing were polled. 270 said that
they were satisfied with their living conditions. Based on this survey we conclude that 60% of
students living in dormitories are satisfied. The margin of error of the study is ±5 percentage
points (with a 95% degree of confidence). Which statement is correct?
2)
A)
A larger sample should be used to achieve the stated margin of error.
B)
There is not enough information to determine whether the margin of error is consistent with
the sample size.
C)
The stated margin of error could have been achieved with a smaller sample size.
D)
The margin of error is consistent with the sample size.
3)
A magazine poll of unemployed men in the U.S. stated “22% of those polled suffer from clinical
depression; the margin of error for the poll is plus or minus 6 percentage points.” How would you
interpret this statement? Assume that the margin of error is associated with a 95% confidence
interval.
3)
A)
There is a 95% chance that the percentage of all unemployed men in the U.S. who suffer from
clinical depression is somewhere between 16% and 28%.
B)
We can be 95% confident that the percentage of all unemployed men in the U.S. who suffer
from clinical depression is somewhere between 16% and 28%.
C)
The percentage of all unemployed men in the U.S. who suffer from clinical depression is 22%.
The chance that this estimate is incorrect is 6%
D)
A confidence interval for the percentage of all unemployed men in the U.S. who suffer from
clinical depression is 17% to 27%. There is a 6% chance that this interval does not include the
population proportion, p.
4)
In a poll of 625 voters in a certain city, 79% said that they backed a bill which would limit growth
and development in their city. The margin of error in the poll was reported as 4 percentage points
(with a 95% degree of confidence). Which statement is correct?
4)
A)
The reported margin of error is consistent with the sample size
B)
The sample size is too small to achieve the stated margin of error
C)
There is not enough information to determine whether the margin of error is consistent with
the sample size
D)
For the given sample size, the margin of error should be smaller than stated
5)
In a poll of 615 voters in a certain city, 70% said that they backed a bill which would limit growth
and development in their city. The margin of error in the poll was reported as 4 percentage points
(with a 95% degree of confidence). Which statement is correct?
5)
A)
The reported margin of error is consistent with the sample size
B)
There is not enough information to determine whether the margin of error is consistent with
the sample size
C)
The sample size is too small to achieve the stated margin of error
D)
The stated margin of error could be achieved with a smaller sample size
SHORT ANSWER. Write the word or phrase that best completes each statement or answers the question.
Use the one–proportion z–test to perform the required hypothesis test. Use the critical–value approach.
6)
In a clinical study of an allergy drug, 109 of the 201 subjects reported experiencing
significant relief from their symptoms. At the 0.01 significance level, do the data provide
sufficient evidence to conclude that a majority of all those using the drug experience relief?
6)
Provide an appropriate response.
7)
Suppose the proportion of sophomores at a particular college who purchased used
textbooks in the past year is ps and the proportion of freshmen at the college who
purchased used textbooks in the past year is pf. A study found a 90% confidence interval
for ps–pf to be (0.234, 0.423). Does this interval suggest that sophomores are more likely
than freshmen to buy used textbooks? Explain.
7)
Use the one–proportion z–test to perform the required hypothesis test. Use the critical–value approach.
8)
A poll of 1,068 adult Americans reveals that 48% of the voters surveyed prefer the
Democratic candidate for the presidency. At the 0.05 level of significance, do the data
provide sufficient evidence that the percentage of all voters who prefer the Democrat is
less than 50%?
8)
Provide an appropriate response.
9)
A congressman wants to measure the level of support in his district for campaign finance
reform and wants to determine whether there is a gender gap with respect to this issue.
One researcher suggests that they find separate confidence intervals for the percent of men
and the percent of women who favor reform and then see if the intervals overlap. Another
researcher suggests that they find a confidence interval for the difference in the proportions
of men and women who favor reform. Which is the correct approach? Why?
9)
10)
Suppose the proportion of women who follow a regular exercise program is pw and the
proportion of men who follow a regular exercise program is pm. A study found a 90%
confidence interval for pw–pm to be (–0.021, 0.115). Does this study provide evidence
that the proportion of women who exercise is different from the proportion of men who
exercise? Explain.
10)
11)
A poll investigating the level of public support for proposed gun control legislation
reported that 66% of the respondents were in favor. The pollsters reported a sampling
error of ±2%. When the responses were broken down by gender, support was 3% higher
among women than men. The pollsters said the margin of error for this difference was ±
3%. Why is the margin of error larger for the difference in support between the genders
than for the overall level of support?
11)
Use the two–proportions z–test to perform the required hypothesis test. Assume that independent simple random
samples have been selected from the two populations. Use the P–value approach.
12)
In a random sample of 500 people aged 20–24, 22% were smokers. In a random sample of
450 people aged 25–29, 14% were smokers. Do the data provide sufficient evidence to
conclude that the proportion of smokers in the 20–24 age group is different from the
proportion of smokers in the 25–29 age group? Use a significance level of 0.01.
12)
Provide an appropriate response.
13)
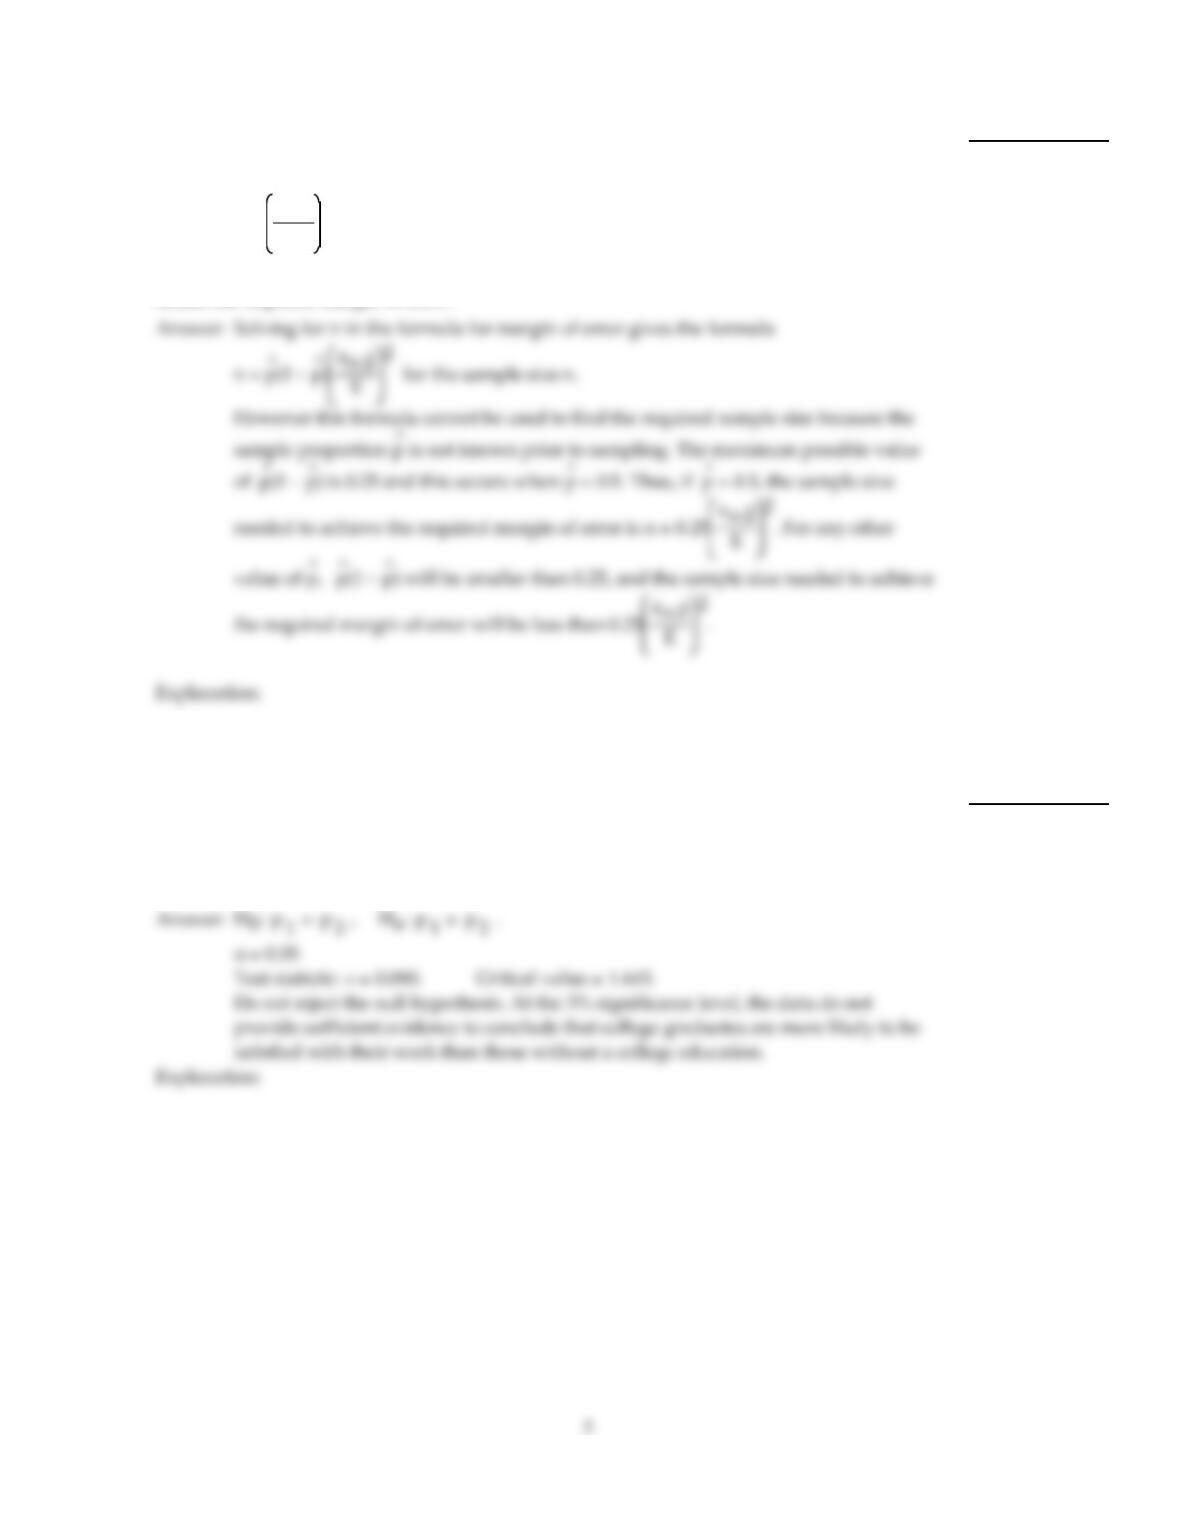
^
A (1 –)–level confidence interval for a population proportion that has a margin of error
of at most E can be obtained by choosing
n = 0.25 z/2
E
2 rounded up to the nearest whole number.
Explain why, if p is not equal to 0.5, this will result in a larger sample size than needed to
obtain the required margin of error.
13)
Use the two–proportions z–test to perform the required hypothesis test. Assume that independent simple random
samples have been selected from the two populations. Use the critical–value approach.
14)
In a survey, 63 of 155 college graduates said that they were satisfied in their work, while 59
of 147 adults without a college education said that they were satisfied with their work. At
the 5% significance level, do the data provide sufficient evidence to conclude that college
graduates are more likely to be satisfied with their work than those without a college
education?
14)
15)
In a random sample of 360 women, 65% favored stricter gun control laws. In a random
sample of 220 men, 60% favored stricter gun control laws. At the 0.05 significance level, do
the data provide sufficient evidence to conclude that the proportion of women favoring
stricter gun control is higher than the proportion of men favoring stricter gun control?
15)
Provide an appropriate response.
16)
A researcher obtained independent random samples of men and women between the ages
of 20 and 29. She finds that 35 of 410 men and 59 of 398 women suffered from insomnia at
least once a week during the past year. Decide whether or not the conditions and
assumptions for inference with the two–proportions z–test are satisfied. Explain your
answer.
16)
17)
A researcher wishes to test whether the rate of defectives among computers from
manufacturer A differs from the rate of defectives among computers from manufacturer B.
She selects two independent random samples and finds that 1.5% of 200 computers from
manufacturer A are defective and 3.5% of 400 computers from manufacturer B are
defective.
Are the conditions and assumptions for inference with the two–proportion z–test
satisfied? Explain your answer.
17)
Use the one–proportion z–test to perform the required hypothesis test. Use the critical–value approach.
18)
An article in a journal reports that 34% of American fathers take no responsibility for child
care. A researcher claims that the figure is higher for fathers in the town of Littleton. A
random sample of 239 fathers from Littleton yielded 96 who did not help with child care.
Do the data provide sufficient evidence to conclude that in Littleton the proportion of
fathers who take no responsibility for child care.is higher than 0.34? Use a 0.05 significance
level.
18)
Use the two–proportions z–test to perform the required hypothesis test. Assume that independent simple random
samples have been selected from the two populations. Use the critical–value approach.
19)
Use the given sample data to test the claim that p1< p2. Use a significance level of 0.10.
Sample 1 Sample 2
n1= 462 n2= 380
x1= 84 x2 = 95
19)
Use the one–proportion z–test to perform the required hypothesis test. Use the P–value approach.
20)
A supplier of 3.5″ disks claims that no more than 1% of the disks are defective. In a random
sample of 600 disks, it is found that 3% are defective, but the supplier claims that this is
only a sample fluctuation. At the 0.01 level of significance, do the data provide sufficient
evidence that the percentage of defects exceeds 1%?
20)
Use the two–proportions z–test to perform the required hypothesis test. Assume that independent simple random
samples have been selected from the two populations. Use the critical–value approach.
21)
A report on the nightly news broadcast stated that 13 out of 107 households with pet dogs
were burglarized and 20 out of 199 without pet dogs were burglarized. At the 5%
significance level, do the data provide sufficient evidence to conclude that households with
pet dogs are at less risk of being burglarized?
21)
Use the two–proportions z–test to perform the required hypothesis test. Assume that independent simple random
samples have been selected from the two populations. Use the P–value approach.
22)
In a random sample of 360 women, 65% favored stricter gun control laws. In a random
sample of 220 men, 60% favored stricter gun control laws. At the 0.05 significance level, do
the data provide sufficient evidence to conclude that the proportion of women favoring
stricter gun control is higher than the proportion of men favoring stricter gun control?
22)
Use the one–proportion z–test to perform the required hypothesis test. Use the P–value approach.
23)
A research group claims that less than 28% of students at one medical school plan to go
into general practice. It is found that among a random sample of 120 of the school’s
students, 20% of them plan to go into general practice. At the 0.10 significance level, do the
data provide sufficient evidence to conclude that the percentage of all students at this
school who plan to go into general practice is less than 28%?
23)
24)
In a sample of 88 adults selected randomly from one town, it is found that 6 of them have
been exposed to a particular strain of the flu. At the 0.01 significance level, do the data
provide sufficient evidence to conclude that the percentage of all adults in the town that
have been exposed to this strain of the flu differs from the nationwide percentage of 8%?
24)
Use the one–proportion z–test to perform the required hypothesis test. Use the critical–value approach.
25)
A research group claims that fewer than 28% of students at one medical school plan to go
into general practice. It is found that among a random sample of 140 of the school’s
students, 20% of them plan to go into general practice. At the 0.10 significance level, test
the research group’s claim.
25)
Provide an appropriate response.
26)
^ ^
In the context of a two–proportions z–test, explain what each of the following symbols
represents: x1, n1, p1, p1, pp.
26)
27)
According to a magazine article, 34% of married men in the U.S. are dissatisfied with their
marriage. Under what circumstances is the proportion 0.34 a population proportion? a
sample proportion?
27)
Use the two–proportions z–test to perform the required hypothesis test. Assume that independent simple random
samples have been selected from the two populations. Use the P–value approach.
28)
7 of 8500 people vaccinated against a certain disease later developed the disease. 18 of
10,000 people vaccinated with a placebo later developed the disease. At the 2%
significance level, do the data provide sufficient evidence to conclude that those who are
vaccinated against the disease are at lower risk of developing the disease than those
vaccinated with a placebo?
28)
Use the two–proportions z–test to perform the required hypothesis test. Assume that independent simple random
samples have been selected from the two populations. Use the critical–value approach.
29)
Of 85 randomly selected women, 38 have tried some form of alternative medicine. Of 90
randomly selected men, 23 have tried some form of alternative medicine. At the 1%
significance level, do the data provide sufficient evidence to conclude that women are
more likely than men to try alternative forms of medicine?
29)
30)
In a random sample of 500 people aged 20–24, 22% were smokers. In a random sample of
450 people aged 25–29, 14% were smokers. Do the data provide sufficient evidence to
conclude that the proportion of smokers in the 20–24 age group is different from the
proportion of smokers in the 25–29 age group? Use a significance level of 0.01.
30)
Use the two–proportions z–test to perform the required hypothesis test. Assume that independent simple random
samples have been selected from the two populations. Use the P–value approach.
31)
A marketing survey involves product recognition in New York and California. Of 558 New
Yorkers surveyed, 193 recognized the product while 196 out of 614 Californians recognized
the product. At the 5% significance level, do the data provide sufficient evidence to
conclude that the recognition rate in New York differs from the recognition rate in
California?
31)
Use the one–proportion z–test to perform the required hypothesis test. Use the P–value approach.
32)
In a sample of 165 children selected randomly from one town, it is found that 30 of them
suffer from asthma. At the 0.05 significance level, do the data provide sufficient evidence
to conclude that the percentage of all children in the town who suffer from asthma is
different from 11%?
32)
Provide an appropriate response.
33)
A researcher is interested in estimating the proportion of adults in the U.S. who suffer from
a rare form of cancer. In a random sample of 1000 adults in the U.S. she finds that 0.3%
suffer from this form of cancer. She then obtains the following 90% confidence interval:
0.003 ± 1.645 (0.003)(0.997)/1000
or 0.000155 to 0.0058
She concludes that she can be 90% confident that the true proportion of adults in the U.S.
suffering from this form of cancer is somewhere between 0.0155% and 0.58%. Is anything
wrong with this reasoning? Explain your answer.
33)
Use the two–proportions z–test to perform the required hypothesis test. Assume that independent simple random
samples have been selected from the two populations. Use the critical–value approach.
34)
A researcher finds that of 1000 people who regularly attend a religious service, 31 would
stop to help a person with car trouble. Of 1200 people interviewed who do not regularly
attend a religious service, 22 would stop to help a person with car trouble. At the 0.05
significance level, do the data provide sufficient evidence to conclude that those who
regularly attend a religious service are more likely to stop and help a person with car
trouble?
34)
Use the two–proportions z–test to perform the required hypothesis test. Assume that independent simple random
samples have been selected from the two populations. Use the P–value approach.
35)
Of 85 randomly selected women, 38 have tried some form of alternative medicine. Of 90
randomly selected men, 23 have tried some form of alternative medicine. At the 1%
significance level, do the data provide sufficient evidence to conclude that women are
more likely than men to try alternative forms of medicine?
35)
Use the one–proportion z–test to perform the required hypothesis test. Use the critical–value approach.
36)
In a sample of 161 children selected randomly from one town, it is found that 32 of them
suffer from asthma. At the 0.05 significance level, do the data provide sufficient evidence
to conclude the proportion of all children in the town who suffer from asthma is different
from 11%?
36)
Use the two–proportions z–test to perform the required hypothesis test. Assume that independent simple random
samples have been selected from the two populations. Use the P–value approach.
37)
Use the given sample data to test the claim that p1< p2. Use a significance level of 0.10.
Sample 1 Sample 2
n1= 462 n2= 380
x1= 84 x2 = 95
37)
Provide an appropriate response.
38)
In a random sample of 500 people aged 20–24, 22% were smokers. In a random sample of
450 people aged 25–29, 14% were smokers. A 95% confidence interval for the difference
between the proportions of 20–24 year olds and 25–29 year olds who are smokers is 0.032
to 0.128. Give an interpretation of this confidence interval.
38)
Use the two–proportions z–test to perform the required hypothesis test. Assume that independent simple random
samples have been selected from the two populations. Use the critical–value approach.
39)
A random sampling of sixty pitchers from the National League and fifty–two pitchers from
the American League showed that 15 National and 7 American League pitchers had
E.R.A’s below 3.5. At the 1% significance level, do the data provide sufficient evidence to
conclude that the proportion of National League pitchers with E.R.A’s below 3.5 differs
from the proportion of American League pitchers with E.R.A’s below 3.5 ?
39)
Use the one–proportion z–test to perform the required hypothesis test. Use the critical–value approach.
40)
In 2000, the percentage of adults in a certain town who drove an SUV was 53%. In 2005, in
a random sample of 100 people from this town, 45% said that they drive an SUV. At the
10% level of significance, do the data provide sufficient evidence to conclude that the
percentage of adults in this town who drive an SUV has changed from the 2000 percentage
of 53%?
40)
Provide an appropriate response.
41)
A researcher wishes to test whether there is a difference between the proportions of
women and men who favor stricter gun control legislation. In a random sample of 300
women, 66% favored stricter gun control legislation. In a random sample of 200 men, 59%
favored stricter gun control legislation. Identify the specified attribute. Determine, if
possible, the two sample proportions. If it is not possible to determine the sample
proportions, explain why not. Determine, if possible, the two population proportions. If it
is not possible to determine the population proportions, explain why not.
41)
Use the two–proportions z–test to perform the required hypothesis test. Assume that independent simple random
samples have been selected from the two populations. Use the P–value approach.
42)
A researcher finds that of 1000 people who regularly attend a religious service, 31 would
stop to help a person with car trouble. Of 1200 people interviewed who do not regularly
attend a religious service, 22 would stop to help a person with car trouble. At the 0.05
significance level, do the data provide sufficient evidence to conclude that those who
regularly attend a religious service are more likely to stop and help a person with car
trouble?
42)
Provide an appropriate response.
43)
A researcher wishes to determine whether the proportion of American women who smoke
differs from the proportion of American men who smoke. He wants to test the hypothesis
H0: p1=p2 where p1 represents the proportion of American women who smoke and p2
represents the proportion of American men who smoke. He randomly selects 100 married
couples. Among the 100 women in the sample are 21 smokers. Among the 100 men are 29
smokers. Are the assumptions for a two–proportions z–test satisfied? If not, which
assumption is violated and why?
43)
44)
Give an example of a situation in which you might wish to use the two–proportions z–test.
Identify the two populations in your example and the attribute of interest. State what you
would wish to determine by performing the hypothesis test and write the hypotheses.
44)
45)
A mayoral election race is tightly contested. In a random sample of 1200 likely voters, 636
said that they were planning to vote for the current mayor. Based on this sample, would
you claim that the mayor will win a majority of the votes? Explain.
45)
Use the one–proportion z–test to perform the required hypothesis test. Use the critical–value approach.
46)
An airline’s public relations department says that the airline rarely loses passengers’
luggage. It further claims that on those occasions when luggage is lost, 88% is recovered
and delivered to its owner within 24 hours. A consumer group who surveyed a large
number of air travelers found that only 133 out of 160 people who lost luggage on that
airline were reunited with the missing items by the next day. At the 5% level of
significance, do the data provide sufficient evidence to conclude that the proportion of
times that luggage is returned within 24 hours is less than 0.88?
46)
Provide an appropriate response.
47)
A mayoral election race is tightly contested. In a random sample of 1600 likely voters, 832
said that they were planning to vote for the current mayor. Based on this sample, would
you claim that the mayor will win a majority of the votes? Explain.
47)
Use the two–proportions z–test to perform the required hypothesis test. Assume that independent simple random
samples have been selected from the two populations. Use the critical–value approach.
48)
A marketing survey involves product recognition in New York and California. Of 558 New
Yorkers surveyed, 193 recognized the product while 196 out of 614 Californians recognized
the product. At the 5% significance level, do the data provide sufficient evidence to
conclude that the recognition rate in New York differs from the recognition rate in
California?
48)
Provide an appropriate response.
49)
What is the null hypothesis for the two–proportions z–test? What assumptions are
required for this test?
49)
50)
For what kinds of data might you be interested in conducting inferences for a population
proportion and for what kinds of data might you be interested in conducting inferences for
a population mean? Explain how you distinguish the two types of data and give an
example of each type of data.
50)
Use the one–proportion z–test to perform the required hypothesis test. Use the critical–value approach.
51)
In a sample of 83 adults selected randomly from one town, it is found that 7 of them have
been exposed to a particular strain of the flu. At the 0.01 significance level, test whether the
proportion of all adults in the town that have been exposed to this strain of the flu differs
from the nationwide percentage of 8%.
51)
Use the one–proportion z–test to perform the required hypothesis test. Use the P–value approach.
52)
An article in a journal reports that 34% of American fathers take no responsibility for child
care. A researcher claims that the figure is higher for fathers in the town of Littleton. A
random sample of 233 fathers from Littleton yielded 96 who did not help with child care.
Do the data provide sufficient evidence to conclude that in Littleton the percentage of
fathers who take no responsibility for child care is higher than 34%? Use a 0.05
significance level.
52)
Provide an appropriate response.
53)
^
A population consists of four men and one woman. The first names of the men are Adam,
Bernard, Charlie, and Daniel. The first name of the woman is Elena. Suppose that the
specified attribute is “male”. a. Determine the population proportion, p.
b. Complete the table below. The first column shows the possible samples of size 3, the
second column gives the number of successes – the number of males obtained – for each
sample, and the third column shows the sample proportion.
Sample Number of males Sample proportion
x p
53)
16
^
A, B, C 3 1
A, B, D 3 1
A, B, E 2 2/3
A, C, D
A, C, E
A, D, E
B, C, D
B, C, E
B, D, E
C, D, E
c. Use the third column of the table to obtain the mean of the variable p. Is this mean
smaller, larger, or the same as your answer in part a?. Why is this the case?
Use the one–proportion z–test to perform the required hypothesis test. Use the P–value approach.
54)
In a clinical study of an allergy drug, 108 of the 201 subjects reported experiencing
significant relief from their symptoms. At the 0.01 significance level, do the data provide
sufficient evidence to conclude that more than half of those using the drug experience
relief?
54)
55)
A poll of 1000 adult Americans reveals that 48% of the voters surveyed prefer the
Democratic candidate for the presidency. At the 0.05 level of significance, do the data
provide sufficient evidence to conclude that the percentage of voters who prefer the
Democrat is less than 50%?
55)
Use the one–proportion z–test to perform the required hypothesis test. Use the critical–value approach.
56)
A manufacturer considers his production process to be out of control when defects exceed
3%. In a random sample of 85 items, the defect rate is 5.9% but the manager claims that this
is only a sample fluctuation and that production is not really out of control. At the 0.01
level of significance, do the data provide sufficient evidence that the percentage of defects
exceeds 3%?
56)
Provide an appropriate response.
57)
Let p1 represent the proportion of men in a city who are unemployed and let p2 represent
the proportion of women in the same city who are unemployed. A 95% confidence interval
for p1–p2 is from –0.05 to –0.03. Give an interpretation of this confidence interval.
57)
58)
^
^
Suppose that a population consists of 30 men and 50 women. Let p represent the
proportion of women in a random sample of size 10 from this population. What is the
mean of p for all possible samples of size 10 from this population?
58)
Use the two–proportions z–test to perform the required hypothesis test. Assume that independent simple random
samples have been selected from the two populations. Use the critical–value approach.
59)
7 of 8500 people vaccinated against a certain disease later developed the disease. 18 of
10,000 people vaccinated with a placebo later developed the disease. At the 2%
significance level, do the data provide sufficient evidence to conclude that those who are
vaccinated against the disease are at lower risk of developing the disease than those
vaccinated with a placebo?
59)
MULTIPLE CHOICE. Choose the one alternative that best completes the statement or answers the question.
Provide an appropriate response.
60)
^
^
Suppose that you wish to estimate a population proportion and want to determine a sample size
that will ensure a given margin of error for a 95% confidence interval. Suppose further that an
educated guess of 0.3 is used for p when determining the sample size. What values of the observed
value of p will yield a larger margin of error than the one specified?
60)
A)
^
p< 0.3
B)
^
0.3 <p< 0.5
C)
^
0.3 <p< 0.7
D)
^
p> 0.3
The numbers of successes and the sample sizes are given for independent simple random samples from two populations.
Use the two–proportions z–interval procedure to obtain the specified confidence interval.
61)
x1=56, n1=80, x2=7, n2=20. 80% confidence interval
61)
A)
0.168 to 0.532
B)
0.199 to 0.501
C)
0.214 to 0.486
D)
0.153 to 0.547
^
The number of successes and the sample size are given for a simple random sample from a population. Determine the
sample proportion, p.
62)
x =20, n = 25
62)
A)
^
p=0.8
B)
^
p=0.72
C)
^
p=0.86
D)
^
p=0.6
Find the P–value for the indicated hypothesis test.
63)
In a sample of 88 children selected randomly from one town, it is found that 8 of them suffer from
asthma. Find the P–value for a hypothesis test to determine whether the proportion of all children
in the town who suffer from asthma differs from 11%.
63)
A)
0.5686
B)
0.2157
C)
0.7157
D)
0.2843
Assume that you wish to estimate a population proportion, p. For the given margin of error and confidence level,
determine the sample size required.
64)
You wish to estimate the proportion of adults that have ever used alternative medicine. Obtain a
sample size that will ensure a margin of error of at most 0.02 for a 95% confidence interval. It is
deemed reasonable to presume that of those sampled, the proportion that have used alternative
medicine will be at least 0.51.
64)
A)
2160
B)
2400
C)
4142
D)
4898
Use the two–proportions z–interval procedure to obtain the required confidence interval for the difference between two
population proportions. Assume that independent simple random samples have been selected from the two populations.
65)
In a random sample of 300 women, 67% favored stricter gun control legislation. In a random
sample of 200 men, 59% favored stricter gun control legislation. Construct a 98% confidence
interval for the difference between the proportions of women and men who favor stricter gun
control legislation.
65)
A)
–0.023 to 0.183
B)
–0.034 to 0.194
C)
–0.010 to 0.170
D)
–0.006 to 0.166
^
Find the required sample size without making a guess for the observed value of p.
66)
A public health researcher wishes to estimate the proportion of adults in the U.S. that have high
blood pressure. Obtain a sample size that will ensure a margin of error of at most 0.006 for a 92%
confidence interval.
66)
A)
128
B)
73
C)
85,070
D)
21,268
Provide an appropriate response.
67)
A newspaper article citing the results of a poll states: “In theory, the results of such a poll, in 99
cases out of 100 should differ by no more than 2 percentage points in either direction from what
would have been obtained by interviewing all voters in the United States.” Find the sample size
suggested by this statement.
67)
A)
165
B)
3394
C)
4145
D)
2402
^
Find the required sample size without making a guess for the observed value of p.
68)
A researcher wishes to estimate the proportion of fish in a certain lake that are inedible due to
pollution of the lake. Obtain a sample size that will ensure a margin of error of at most 0.08 for a
97% confidence interval.
68)
A)
184
B)
7
C)
183
D)
85
The number of successes and the sample size are given for a simple random sample from a population. Decide whether
using the one–proportion z–interval procedure is appropriate.
69)
x = 5, n =34
69)
A)
Appropriate
B)
Not appropriate
Use the one–proportion z–test to perform the specified hypothesis test. Use the critical–value approach.
70)
x =741, n =1300, H0: p = 0.5, Ha: p > 0.5, = 0.05
70)
A)
z =3.786; critical value = 1.96; do not reject H0
B)
z =5.048; critical value = 1.645; reject H0
C)
z =3.786; critical value = 1.645; reject H0
D)
z =5.048; critical value = 1.96; reject H0
The number of successes and the sample size are given for a simple random sample from a population. Decide whether
using the one–proportion z–test is appropriate.
71)
x = 60, n =190, H0: p = 0.6, Ha: p < 0.6
71)
A)
Not appropriate
B)
Appropriate
Find the P–value for the indicated hypothesis test.
72)
A random sample of 140 forty–year–old men contains 25% smokers. Find the P–value for a
hypothesis test to determine whether the percentage of forty–year–old men that smoke differs from
22%.
72)
A)
0.1401
B)
0.4010
C)
0.3898
D)
0.1949
A two–proportions z–test is to be performed. The null hypothesis is H0: p1=p2 . For the given sample data compute the
value of the test statistic.
73)
x1=42, n1 =144, x2=36, n2=136
73)
A)
z =0.349
B)
z =0.649
C)
z =0.287
D)
z =0.499
The number of successes and the sample size are given for a simple random sample from a population. Use the
one–proportion z–interval procedure to find the required confidence interval.
74)
x =33, n =80, 99% level
74)
A)
0.271 to 0.554
B)
0.254 to 0.571
C)
0.305 to 0.52
D)
0.284 to 0.541
The number of successes and the sample size are given for a simple random sample from a population. Decide whether
using the one–proportion z–test is appropriate.
75)
x = 28, n =50, H0: p = 0.92, Ha: p < 0.92
75)
A)
Appropriate
B)
Not appropriate
76)
x = 3, n =80, H0: p = 0.04, Ha: p > 0.04
76)
A)
Not appropriate
B)
Appropriate
The numbers of successes and the sample sizes are given for independent simple random samples from two populations.
Use the two–proportions z–test to conduct the required hypothesis test. Use the critical–value approach.
77)
x1=12, n1=60, x2=28, n2=40, left–tailed test, = 0.05
77)
A)
z = –5; critical value = –1.645; reject H0
B)
z = –4; critical value = –1.645; reject H0
C)
z = –5; critical value = –1.96; reject H0
D)
z = –4; critical value = –1.96; do not reject H0
Provide an appropriate response.
78)
A population proportion is to be estimated and a 95% degree of confidence is desired. In general, if
one wishes to decrease the margin of error by a factor of 3 (for example from E =0.03 to 0.01), how
will the necessary sample size change?
78)
A)
It will decrease by a factor of 9
B)
It will increase by a factor of 3
C)
It will increase by a factor of 9
D)
It will decrease by a factor of 3
The number of successes and the sample size are given for a simple random sample from a population. Decide whether
using the one–proportion z–test is appropriate.
79)
x = 7, n = 280, H0: p = 0.03, Ha: p 0.03
79)
A)
Not appropriate
B)
Appropriate
80)
x = 25, n =70, H0: p = 0.4, Ha: p 0.4
80)
A)
Not appropriate
B)
Appropriate
Use the one–proportion plus–four z–interval procedure to find the required confidence interval.
81)
Of 87 adults selected randomly from one town, 67 have health insurance. Find a 90% confidence
interval for the proportion of all adults in the town who have health insurance.
81)
A)
0.654 to 0.863
B)
0.643 to 0.874
C)
0.684 to 0.832
D)
0.670 to 0.846
The number of successes and the sample size are given for a simple random sample from a population. Use the
one–proportion z–interval procedure to find the required confidence interval.
82)
n =183, x =158; 95% level
82)
A)
0.814 to 0.913
B)
0.824 to 0.903
C)
0.823 to 0.904
D)
0.813 to 0.914
Use the one–proportion z–test to perform the specified hypothesis test. Use the critical–value approach.
83)
x =345, n =1000, H0: p = 0.35, Ha: p > 0.35, = 0.01
83)
A)
z = 0.62; critical value = 2.575; reject H0
B)
z = –0.33; critical value = 2.575; do not reject H0
C)
z = 0.62; critical value = 2.33; do not reject H0
D)
z = –0.33; critical value = 2.33; do not reject H0
Find the indicated margin of error.
84)
In a random sample of 194 college students, 75 had part–time jobs. Find the margin of error for the
95% confidence interval used to estimate the population proportion.
84)
A)
0.120
B)
0.00240
C)
0.0685
D)
0.0617
^
The number of successes and the sample size are given for a simple random sample from a population. Determine the
sample proportion, p.
85)
x =141, n = 200
85)
A)
^
p=0.696
B)
^
p=0.716
C)
^
p=0.705
D)
^
p=0.665
The number of successes and the sample size are given for a simple random sample from a population. Decide whether
using the one–proportion z–interval procedure is appropriate.
86)
x =106, n =110
86)
A)
Not appropriate
B)
Appropriate
87)
x =84, n =90
87)
A)
Not appropriate
B)
Appropriate
The number of successes and the sample size are given for a simple random sample from a population. Use the
one–proportion z–interval procedure to find the required confidence interval.
88)
n =132, x =87; 90% level
88)
A)
0.593 to 0.725
B)
0.595 to 0.723
C)
0.590 to 0.728
D)
0.591 to 0.727
The numbers of successes and the sample sizes are given for independent simple random samples from two populations.
Use the two–proportions plus–four z–interval procedure to obtain the specified confidence interval.
89)
x1=15, n1=34, x2=33, n2=47; 90% confidence interval
89)
A)
0.237 to 0.652
B)
0.239 to 0.652
C)
–0.423 to –0.075
D)
0.272 to 0.616
Use the two–proportions z–interval procedure to obtain the required confidence interval for the difference between two
population proportions. Assume that independent simple random samples have been selected from the two populations.
90)
In a random sample of 500 people aged 20–24, 22% were smokers. In a random sample of 450
people aged 25–29, 14% were smokers. Construct a 95% confidence interval for the difference
between the proportions of 20–24 year olds and 25–29 year olds who are smokers.
90)
A)
0.048 to 0.112
B)
0.025 to 0.135
C)
0.035 to 0.125
D)
0.032 to 0.128
Provide an appropriate response.
91)
^
You are planning to use a sample proportion p to estimate a population proportion, p. True or
false, the sample proportion for a sample of size 100 is more likely to lie within 0.01 of the
population proportion than the sample proportion for a sample of size 200?
91)
A)
True
B)
False
Use the one–proportion z–interval procedure to find the required confidence interval.
92)
In a sample of 1901 patients who underwent a certain type of surgery, 22% experienced
complications. Find a 90% confidence interval for the proportion of all those undergoing this
surgery who experience complications.
92)
A)
0.2078 to 0.2322
B)
0.2105 to 0.2295
C)
0.2011 to 0.2389
D)
0.2044 to 0.2356
^
Find the required sample size without making a guess for the observed value of p.
93)
A computer manufacturer wishes to estimate what proportion of their laptop computers are
defective. Obtain a sample size that will ensure a margin of error of at most 3.5 percentage points
for a 95% confidence interval.
93)
A)
3137
B)
785
C)
28
D)
197
The numbers of successes and the sample sizes are given for independent simple random samples from two populations.
Use the two–proportions z–interval procedure to obtain the specified confidence interval.
94)
x1=8, n1=20, x2=13, n2=20. 90% confidence interval
94)
A)
–0.577 to 0.077
B)
–0.502 to 0.002
C)
–0.476 to –0.024
D)
–0.451 to –0.049
Use the two–proportions z–interval procedure to obtain the required confidence interval for the difference between two
population proportions. Assume that independent simple random samples have been selected from the two populations.
95)
The U.S. Department of Labor and Statistics wanted to compare the results of an unemployment
program for the past two months in the U.S. Two months ago, 7420 people out of a random sample
of 143,000 were unemployed. Last month, 7242 people out of a random sample of 142,000 were
unemployed. Construct a 99% confidence interval for the difference between the unemployment
rates two months ago and last month.
95)
A)
–0.0012 to 0.0030
B)
–0.0005 to 0.0022
C)
–0.0010 to 0.0028
D)
–0.0007 to 0.0025
Provide an appropriate response.
96)
^
^
You wish to estimate a population proportion, p, and want to determine the sample size required
for a given margin of error and confidence level. In A, B, C, D below, a likely range is given for the
observed value of the sample proportion, p . Based on the given range, identify the educated guess
that should be used for the observed value of p in calculating the required sample size. For which
of the ranges did you identify the value 0.5?
A. 0.1 to 0.4
B. 0.3 to 0.6
C. At least 0.7
D. At most 0.7
96)
A)
A and C
B)
B and D
C)
A and D
D)
B and C
Assume that you wish to estimate a population proportion, p. For the given margin of error and confidence level,
determine the sample size required.
97)
You wish to estimate the proportion of all voters in California who plan to vote in favor of a certain
ballot measure. Obtain a sample size that will ensure a margin of error of at most 0.03 for a 99%
confidence interval. Assume that it is reasonable to presume that of the voters sampled, the
percentage in favor of the measure will be between 10% and 25%.
97)
A)
664
B)
801
C)
1382
D)
1842
^
A hypothesis test is to be performed for a population proportion. For the given sample data and null hypothesis, compute
the value of the test statistic, z =p–p0
p0(1 –p0)/n
98)
A drug company claims that over 90% of all physicians recommend their drug. 400 physicians
were asked if they recommend the drug to their patients. 56% said yes. H0: p =0.9.
98)
A)
–45.334
B)
–22.667
C)
–29.467
D)
–20.400
Find the indicated margin of error.
99)
In a survey of 280 adults over 50, 70% said they were taking vitamin supplements. Find the margin
of error for the 99% confidence interval used to estimate the population proportion. Give your
answer as a percentage.
99)
A)
12.9%
B)
19.7%
C)
5.37%
D)
9.8%
E)
7.05%
The numbers of successes and the sample sizes are given for independent simple random samples from two populations.
Decide whether using the two–proportions z–procedures is appropriate.
100)
x1= 45, n1= 50, x2=20, n2= 24
100)
A)
Not appropriate
B)
Appropriate
^
The number of successes and the sample size are given for a simple random sample from a population. Determine the
sample proportion, p.
101)
x =14, n = 20
101)
A)
^
p=0.8
B)
^
p=0.7
C)
^
p=0.75
D)
^
p=0.6
^
A hypothesis test is to be performed for a population proportion. For the given sample data and null hypothesis, compute
the value of the test statistic, z =p–p0
p0(1 –p0)/n
102)
Out of 200 observations, 64% were successes. H0: p =0.49.
102)
A)
0.005
B)
1.291
C)
4.243
D)
1.723

A two–proportions z–test is to be performed. The null hypothesis is H0: p1=p2 . For the given sample data compute the
value of the test statistic.
103)
A random sampling of sixty pitchers from the National League and fifty–two pitchers from the
American League showed that 11 National and 13 American League pitchers had E.R.A’s below 3.5.
103)
A)
z = –4.320
B)
z = –1.114
C)
z = –0.857
D)
z = –51.583
^
Find the required sample size without making a guess for the observed value of p.
104)
Suppose the federal government needs to estimate the proportion of students receiving federal
loans that default on those loans. Obtain a sample size that will ensure a margin of error of at most
0.006 for a 97% confidence interval.
104)
A)
130,803
B)
15,070
C)
523,212
D)
32,701
Provide an appropriate response.
105)
^
^
^ ^
Suppose that in one town 12% of women and 8% of men are vegetarians. Let p1denote the
proportion of vegetarians among a sample of 200 women selected randomly from the town. Let p2
denote the proportion of vegetarians among a sample of 100 men selected randomly from the town.
What is the distribution of p1–p2and what are its mean and standard deviation? Assume that
the two samples are independent.
105)
A)
^ ^
p1–p2is exactly normally distributed with a mean of 0.4 and a standard deviation of
0.00127.
B)
^ ^
p1–p2is approximately normally distributed with a mean of 0.04 and a standard deviation
of 0.00127.
C)
^ ^
p1–p2is approximately normally distributed with a mean of 0.04 and a standard deviation
of 0.0356.
D)
^ ^
p1–p2is exactly normally distributed with a mean of 0.4 and a standard deviation of 0.0356.
29
^
Find the required sample size without making a guess for the observed value of p.
106)
A pollster wishes to estimate the proportion of U.S. voters that oppose capital punishment. Obtain
a sample size that will ensure a margin of error of at most 0.02 for a 97% confidence interval.
106)
A)
11,773
B)
2944
C)
2943
D)
59
Use the one–proportion z–test to perform the specified hypothesis test. Use the critical–value approach.
107)
x =154, n =170 , H0: p = 0.94, Ha: p < 0.94, = 0.10
107)
A)
z = –1.87; critical value = –1.645; reject H0
B)
z = –1.54; critical value = –1.645; do not reject H0
C)
z = –1.54; critical value = –1.28; do not reject H0
D)
z = –1.87; critical value = –1.28; reject H0
^
A hypothesis test is to be performed for a population proportion. For the given sample data and null hypothesis, compute
the value of the test statistic, z =p–p0
p0(1 –p0)/n
108)
A research group wants to determine whether the proportion of car accidents caused by drivers
using cell phones has changed from the previous value of 13%. They obtained 10,000 auto accident
reports and found that 18% were caused by drivers using cell phones. The hypotheses are
H0: p = 0.13, Ha: p 0.13, where p is the proportion of car accidents caused by drivers using cell
phones.
108)
A)
5.055
B)
14.868
C)
29.736
D)
20.667
The number of successes and the sample size are given for a simple random sample from a population. Decide whether
using the one–proportion z–interval procedure is appropriate.
109)
x =22, n = 250
109)
A)
Appropriate
B)
Not appropriate
Answer Key
Testname: C11
31
Answer Key
Testname: C11
32
Answer Key
Testname: C11
33
Answer Key
Testname: C11
34
Answer Key
Testname: C11
Answer Key
Testname: C11
Answer Key
Testname: C11