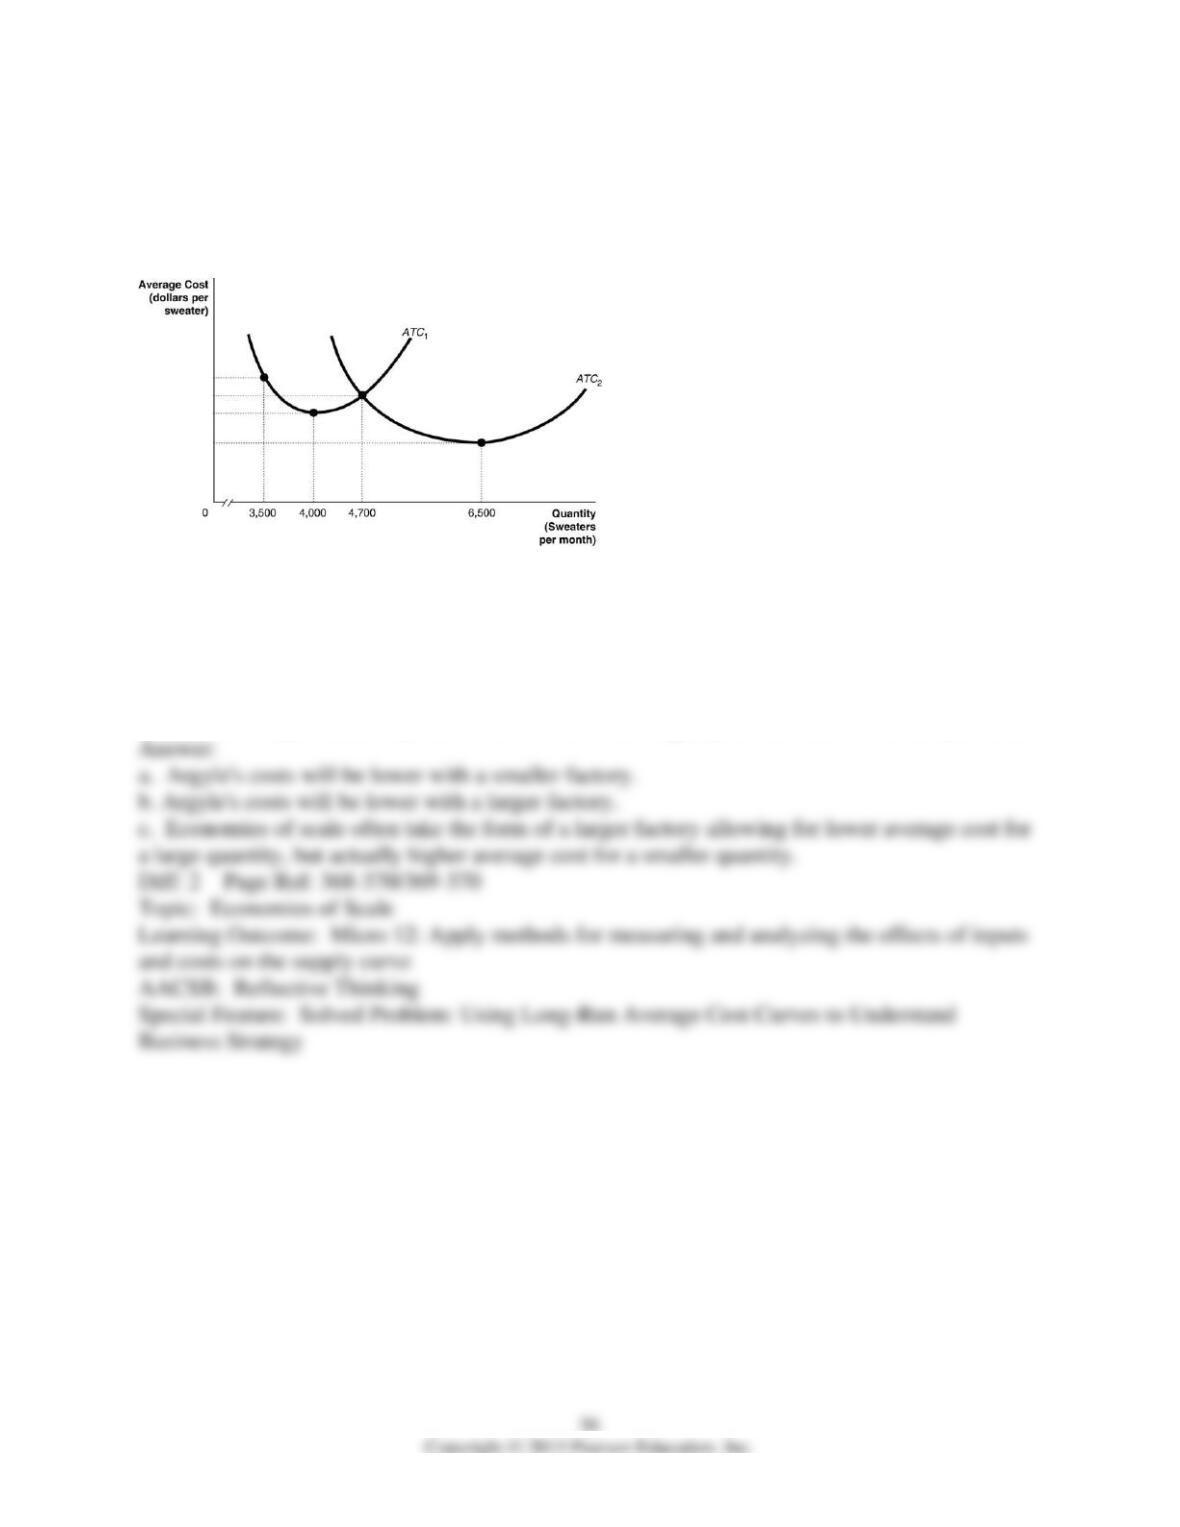
32) Suppose Argyle Sachs has to choose between building a smaller sweater factory and a larger
sweater factory. In the following graph, the relationship between costs and output for the smaller
factory is represented by the curve ATC1, and the relationship between costs and output for the
larger factory is represented by the curve ATC2.
a. If Argyle expects to produce 3,600 sweaters per month, should he build a smaller factory or a
larger factory? Briefly explain?
b. If Argyle expects to produce 5,000 sweaters per month, should he build a smaller factory or a
larger factory? Briefly explain.
c. If the average cost of producing sweaters is lower in the larger factory when Argyle produces
6,500 sweaters per week, why isn’t it also lower when Argyle produces 4,000 sweaters per week?
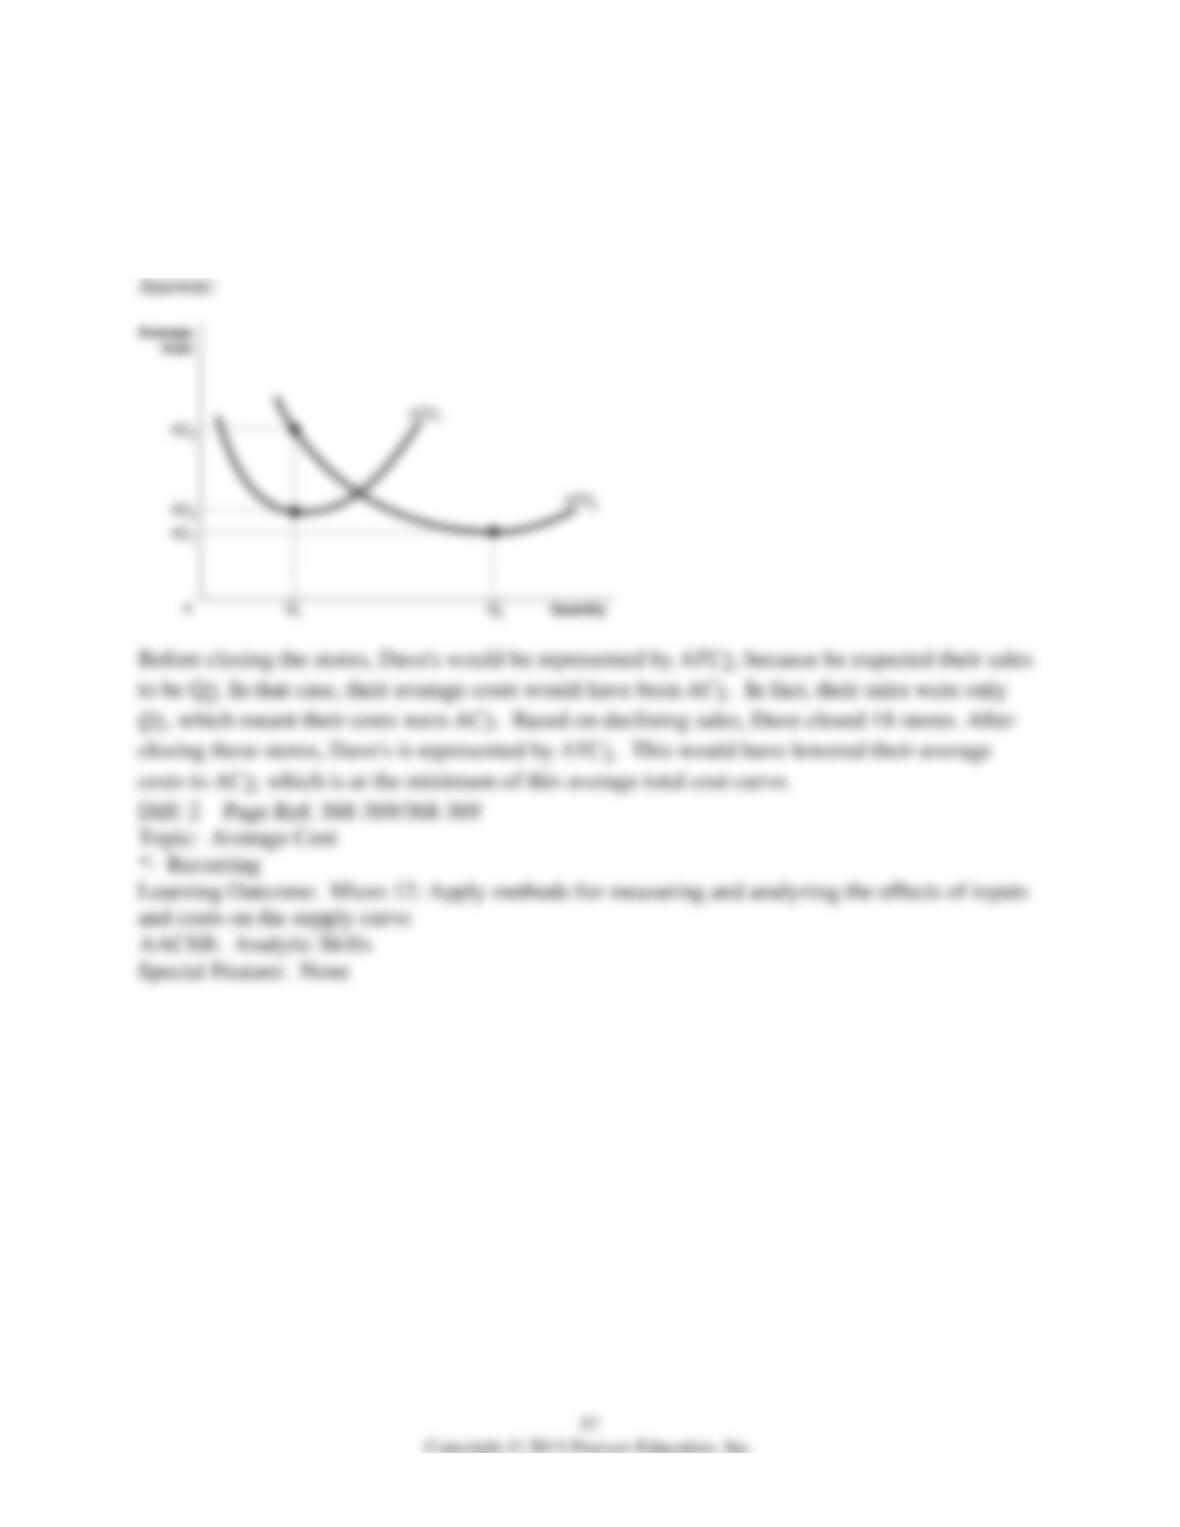
33) Due to a downturn in business and increased competition, Dave Amundson, owner of Dave’s
Delicious Donuts, decides to close half of his 36 donut shops. Use a graph to illustrate average
total cost curves for Dave’s Delicious Donuts before and after closing the 18 stores. Assume that
after closing the stores, Dave’s Delicious Donuts will be producing at minimum average total
cost.
11.7 Appendix: Using Isoquants and Isocost Lines to Understand Production and Cost
1) An isoquant shows
A) the combinations of two goods that yield the same total satisfaction.
B) the combinations of two inputs that yield the same total product.
C) the combinations of two inputs that cost the same total quantity of money.
D) the combination of two goods that cost the same amount of money.
2) The slope of an isoquant measures
A) the price ratio of the two inputs.
B) the average product of labor.
C) the ratio of the marginal utility of the two inputs.
D) the rate at which inputs can be substituted for each other keeping total output constant.
3) The marginal rate of technical substitution is
A) the rate at which a firm is able to substitute one input for another, while keeping total cost
constant.
B) the rate at which a firm is able to substitute one input for another, while keeping the level of
output constant.
C) the rate at which a firm is able to institute positive technological changes to its production
process.
D) the rate at which a firm is able to increase its output by replacing labor with technology.
4) An isocost line shows
A) all the possible combinations of two inputs that a firm can use to produce its output.
B) all the possible combinations of two inputs a firm can use that have the same total cost.
C) all the possible combinations of two inputs a firm can use that have the same marginal cost.
D) all the possible combinations of two inputs with constant returns to scale.
5) The absolute value of the slope of an isocost line equals the ratio of
A) the marginal productivities of the two inputs.
B) the prices of the two inputs.
C) the marginal utilities of the two inputs.
D) the quantities of the two inputs.
6) Higher isocost lines correspond to higher
A) profits.
B) total costs of production.
C) input prices.
D) sales revenue.
7) You own a business that answers telephone calls for physicians after their offices close. You
have an incentive to substitute capital for labor if the
A) price of capital increases.
B) price of labor decreases.
C) price of labor increases.
D) marginal product of labor increases.
8) Suppose the price of capital and labor remain constant but that the average educational level
of workers has increased and therefore, productivity of labor increases. This would lead a firm
A) to adopt a more capital-intensive production technology.
B) to adopt a more labor-intensive technology.
C) to keep its output and production technology unchanged, but to use fewer units of labor.
D) to use only labor to produce the product.
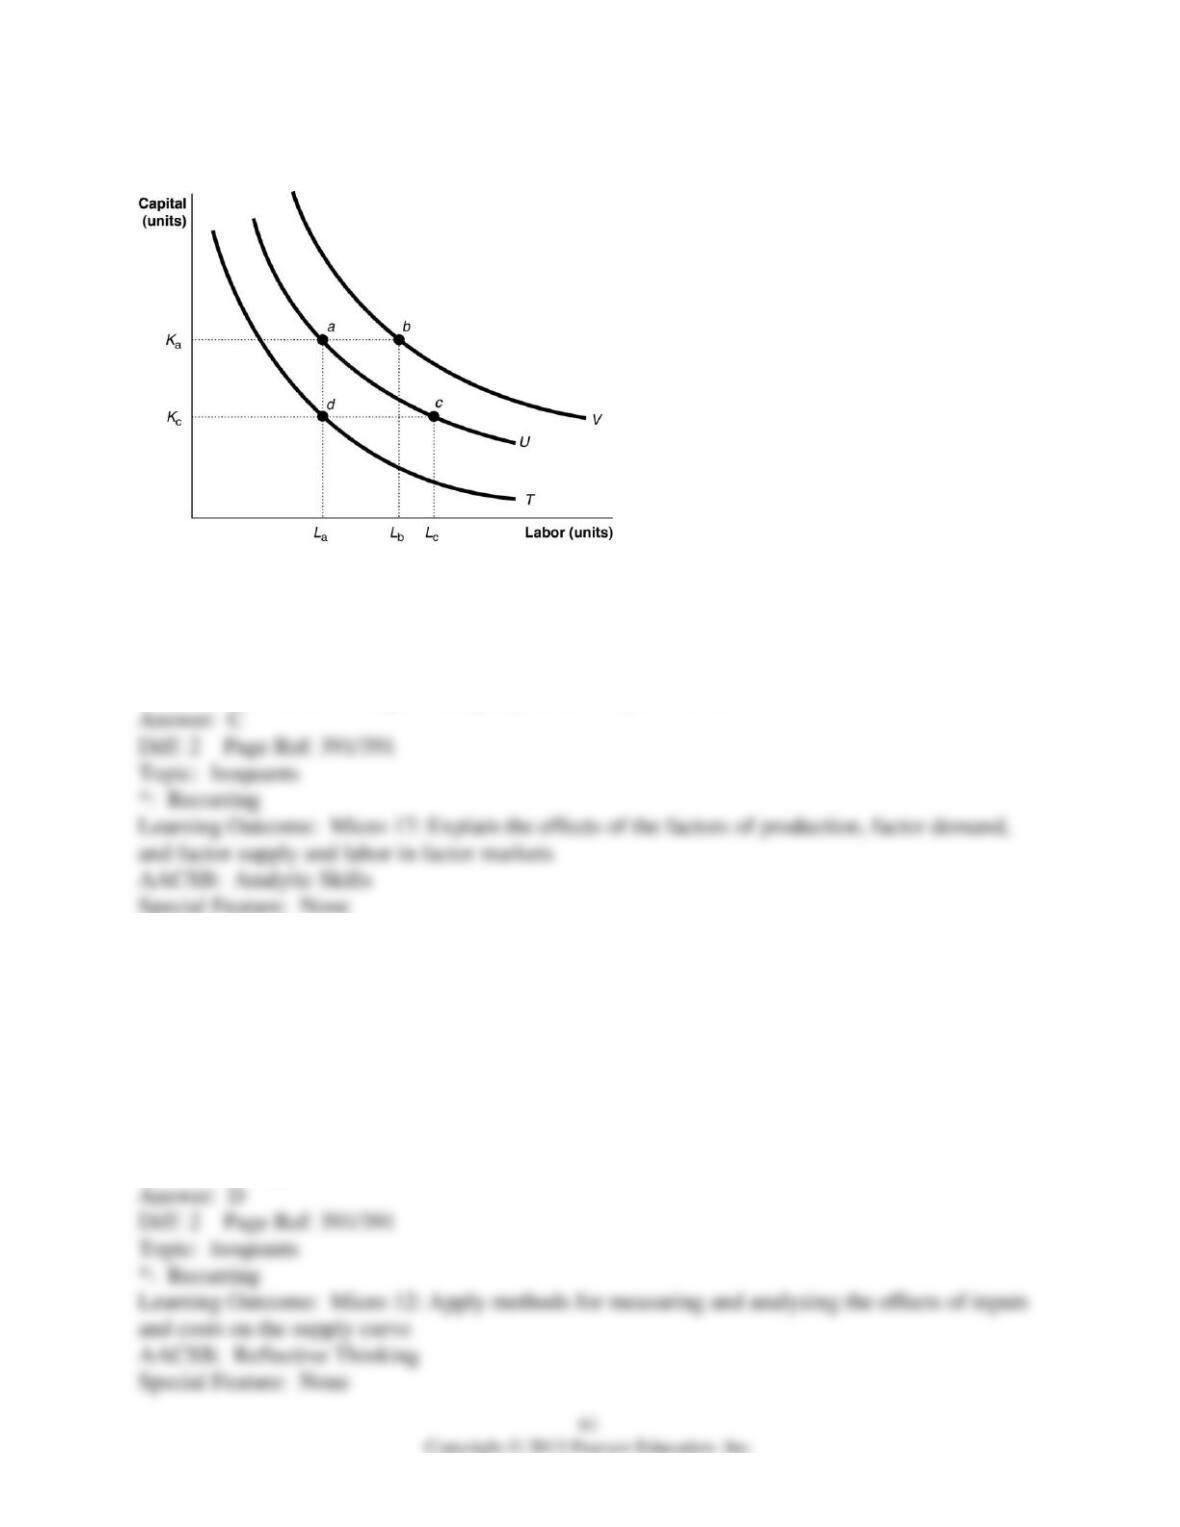
Figure 11-6
9) Refer to Figure 11-6. The movement from isoquant T to isoquant U depicts
A) a change in preferences with regards to input usage.
B) an increase in the cost of production.
C) an increase in output.
D) an increase in labor usage holding capital and output constant.
10) Refer to Figure 11-6. Which of the following statements about the input combinations
shown in the diagram is false?
A) The firm produces a higher output level when it uses input combination b compared to input
combination a.
B) The firm produces a lower output level when it uses input combination d compared to input
combination a.
C) The firm produces the same output level when it uses input combination a or c.
D) The firm incurs the same total cost when it uses input combination a or c to produce a given
quantity of output.
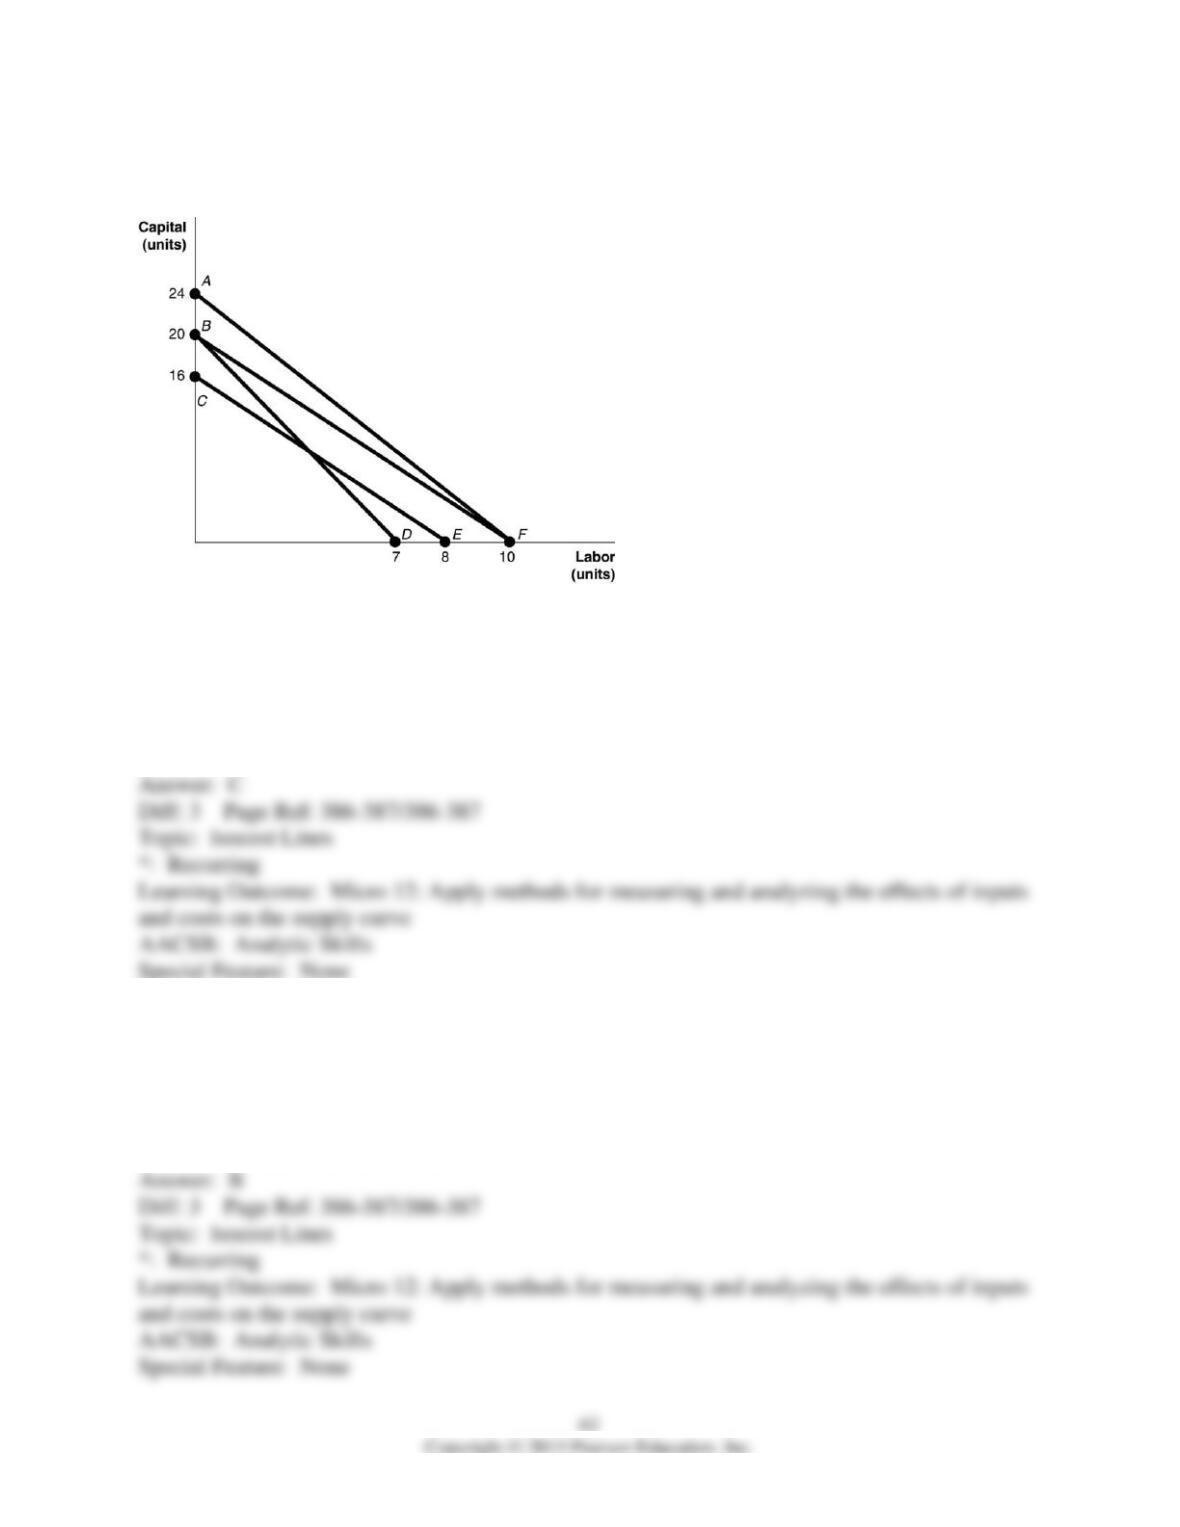
Figure 11-7
11) Refer to Figure 11-7. The lines shown in the diagram are isocost lines. Which of the
following shows an increase in the price of labor while the price of capital remains unchanged?
A) the movement from AF to BD
B) the movement from AF to CE
C) the movement from BF to BD
D) the movement from BF to CE
12) Refer to Figure 11-7. The lines shown in the diagram are isocost lines. Which of the
following shows a decrease in the price of capital while the price of labor remains unchanged?
A) the movement from AF to BF
B) the movement from BF to AF
C) the movement from BF to BD
D) the movement from BF to CE
13) Refer to Figure 11-7. The lines shown in the diagram are isocost lines. Which of the
following shows an increase in the firm’s total cost while the price of labor and capital remain
unchanged?
A) the movement from CE to BF
B) the movement from CE to AF
C) the movement from BD to AF
D) the movement from BD to CE
14) Refer to Figure 11-7. The lines shown in the diagram are isocost lines. A movement from
CE to BD occurs when
A) the price of capital increases while the price of labor remains unchanged.
B) the price of labor decreases while the price of capital remains unchanged.
C) the price of capital increases while the price of labor decreases.
D) the price of capital decreases while the price of labor increases.
15) Refer to Figure 11-7. The lines shown in the diagram are isocost lines. If the price of labor is
$50 per unit, then along the isocost AF, the total cost
A) is $500.
B) is $750.
C) is $1,250.
D) cannot be determined without the price of capital.
16) Refer to Figure 11-7. The lines shown in the diagram are isocost lines. If the price of labor is
$50 per unit, what is the price of capital along the isocost CE?
A) $400 per unit
B) $100 per unit
C) $25 per unit
D) insufficient information to answer question
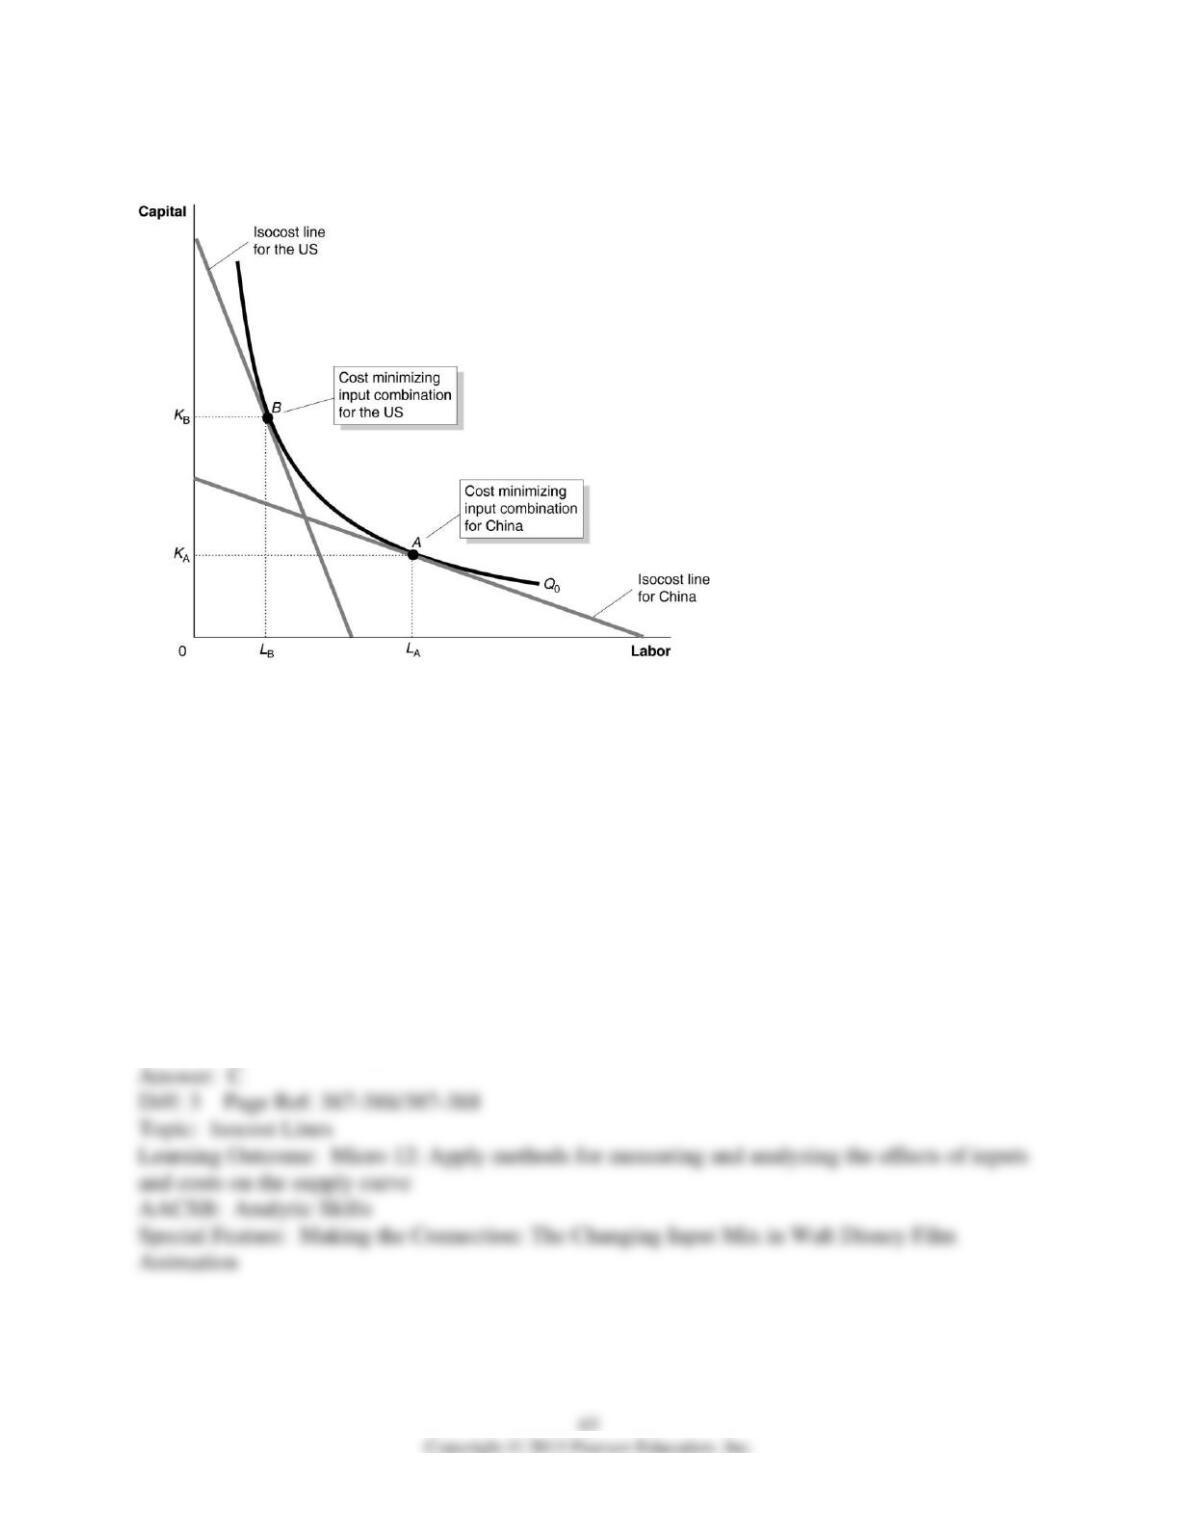
Figure 11-8
Figure 11-8 shows the optimal input combinations for the production of a given quantity of
cotton in the United States and in China.
17) Refer to Figure 11-8. Consider the following statements:
a. For each country, the marginal product per dollar spent on labor equals to the marginal
product per dollar spent on capital.
b. The price of labor is relatively higher in the United States than in China and the price of
capital is relatively lower in the United States than in China.
c. The price of labor and the price of capital are relatively higher in the United States than in
China. Based on the figure, which of the statements above is true?
A) All of the statements are true.
B) statements a and c only
C) statements a and b only
D) statements b and c only
18) Refer to Figure 11-8. Which of the following could explain why the United States and China
use different input combinations to produce a given quantity of cotton and yet, each country
produces that quantity at the lowest possible cost?
A) because the prices of inputs are not the same for the two countries: labor is relatively lower-
priced and capital is relatively higher priced in the United States
B) because the prices of inputs are not the same for the two countries: labor is relatively lower-
priced and capital is relatively higher priced in China
C) because the United States has more sophisticated technology and therefore is more efficient in
cotton production
D) because the marginal product per dollar spent on capital yields a higher return in the United
States than in China
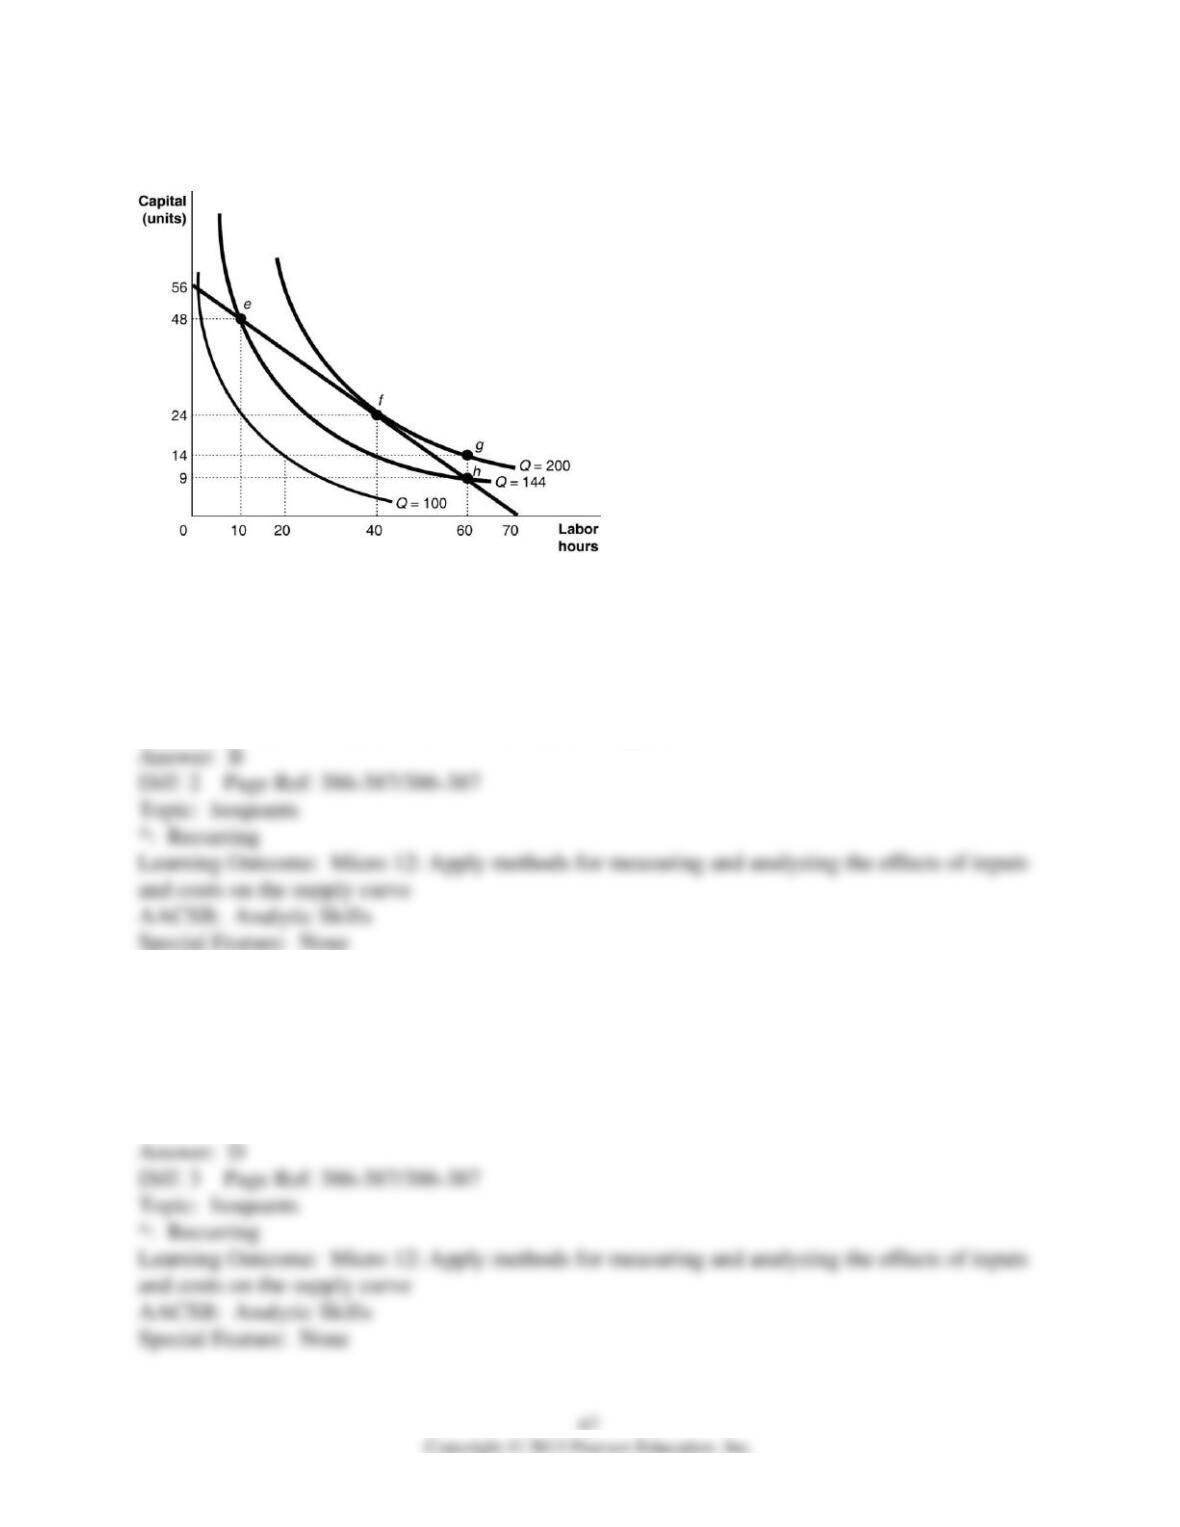
Figure 11-9
19) Refer to Figure 11-9. What is the combination of inputs that produces 200 gooseberry pies
at the lowest cost?
A) combination e: 10 hours of labor and 48 units of capital
B) combination f: 40 hours of labor and 24 units of capital
C) combination g: 60 hours of labor and 14 units of capital
D) combination h: 60 hours of labor and 9 units of capital
20) Refer to Figure 11-9. Suppose Hilda hires labor at $8 per hour and capital costs $10 per unit.
What is the minimum cost of producing 200 gooseberry pies?
A) $3,600
B) $1,120
C) $592
D) $560
21) Refer to Figure 11-9. Suppose Hilda produces 100 gooseberry pies. What is the marginal
rate of technical substitution of labor for capital when labor is increased from 10 to 20 hours?
A) 1 unit of capital
B) 10 units of capital
C) 14 units of capital
D) 24 units of capital
22) Maximizing the level of output for a given total cost of production
A) is equivalent to producing the profit maximizing output level.
B) is equivalent to minimizing cost for a given level of output.
C) necessitates using only relatively low-priced inputs.
D) will maximize total revenue.
23) An expansion path shows
A) the level of sales necessary for a firm if it wants to expand.
B) the level of long-run average cost at different scales of operation.
C) the least-cost combination of inputs for each level of output.
D) the returns to scale at each level of output.
24) The slope of an isocost line determines the marginal rate of substitution.
25) An isoquant is a curve that shows all the combinations of two inputs that will produce the
same level of output.
26) What is an isoquant? What is the slope of an isoquant?
27) If the marginal product of labor is 45 units of output and the marginal product of capital is 56
units of output while the wage rate is $20 per worker and the cost of capital is $28 per machine,
are these two inputs being used in the least cost combination and what should be done if they are
not?