Chapter 10—Regression
MULTIPLE CHOICE QUESTIONS
10.1 + When I want to make a prediction but don’t have the value of X on which to base
that prediction, my best estimate is
10.2 When we make a prediction using a regression equation, our prediction is
_______ on X.
10.3 + If the correlation between X and Y is negative, the slope of the regression equation
must be
10.4 + When we have considerable spread of the points about the regression line, the
slope of that line will be _______ the slope of a similar line when there is less
scatter.
10.5 + The equation for a straight line is an equation of the form
10.6 In the equation for a straight line used in the text, the intercept is represented by
Chapter 10
10.7 In the equation for a straight line used in the text, the slope is represented by
10.8 When the slope of the regression line is positive, the line goes from
10.9 If we have a regression line predicting the amount of improvement in your
performance as a function of the amount of tutoring you receive, an intercept of
12 would mean that
10.10 + Suppose that you sell ice cream from a cart on the street. After you pay the ice
cream supplier, the regression line that predicts your ice cream profits from the
number of hours you work has a slope of 15. But the man who owns the cart
charges you $5 per hour in rent. How much money will you earn per hour?
10.11 + In the previous problem your best estimate of the intercept relating the total
earning from the hours worked is
10.12 The notation
Y
ˆ
is used instead of Y
10.13 The “best fitting line” is that regression line that
Test Bank
284
10.14 The notation (Y –
ˆ
Y
) represents
10.15 In calculating the regression coefficients we square the errors of prediction
because
10.16 The symbols a and b are frequently referred to as
10.17 In the equation
Y
ˆ
Y
ˆ
= 12.6 X + 5
10.18 + When we standardize paired data we
10.19 When we have standardized data, the slope will be denoted as
10.20 + When we think in terms of standardized data, the slope represents
Chapter 10
10.21 If data with only one predictor variable were standardized, the slope would equal
10.22 + If you want to plot the regression line, after having found the regression equation,
ˆ
10.23 The regression line always passes through the point
10.24 The notation Y –
ˆ
Y
is referred to as
10.25 If we do not know X, our measure of error in predicting Y is
10.26 If we do know X, our measure of error is
Test Bank
286
10.27 + The standard error of estimate is given by
10.28 The standard error of estimate is denoted by
10.29 We can think of the standard error of estimate as
10.30 When we use a regression equation to make a prediction, the errors that we make
are often referred to as
10.31 + If the correlation between a body image measure and an eating disorders measure
is .50, we can conclude that
Chapter 10
10.32 The notation SS stands for
10.33 If we want to specify the percentage of the overall variability in life expectancy
attributable to variability in smoking behavior, the statistic we want to look at is
10.34 + An important thing about r2 is that it represents a measure of
10.35 + Which of the following does NOT belong with the rest?
10.36 + If the correlation between X and Y is significant, that tells us
10.37 A significant slope means that
10.38 If the slope is significant we know that
Test Bank
10.39 If you drop a pencil randomly on a scatterplot, what aspect are you changing as
you move the pencil vertically on the page without rotating it?
10.40 If you drop a pencil randomly on a scatterplot, what aspect are you changing as
you rotate the pencil about the point where it crosses the Y axis?
10.41 In a scatterplot, an outlier is one that
10.42 + An example in the text hypothesized that 4% of the variability in life expectancy
was accounted for by variability in smoking behavior. The values of r and r2,
respectively, are equal to
10.43 A regression analysis of hours spent exercising and ounces of weight loss had a
slope of 3. We would predict that
10.44 When one refers to the degree that variable A changes as variable B changes they
are referring to
10.45 A regression line is
Chapter 10
289
10.46 The intercept of a regression line is
TRUE/FALSE QUESTIONS
one predictor variable.
relationships.
accounts for 50% of the variability in lung cancer.
.50, then 75% of the variability in self-esteem is independent of warm parenting
practices.
variable based on knowing the value of the predictor variable.
stress, the beta = .5. This means that for every 1 point increase in stress there is
half a point increase in symptoms.
10.54 [TRUE] When there is only one predictor variable in a regression, beta
(regression coefficient) = r (correlation coefficient).
accurate predictions.
OPEN-ENDED QUESTIONS
10.57 Given this regression equation,
Y
ˆ
= .75 X + 5, estimate Y for the following values
of X.
a) X = 0
b) X = 1
c) X = -3
d) X = 75

Test Bank
290
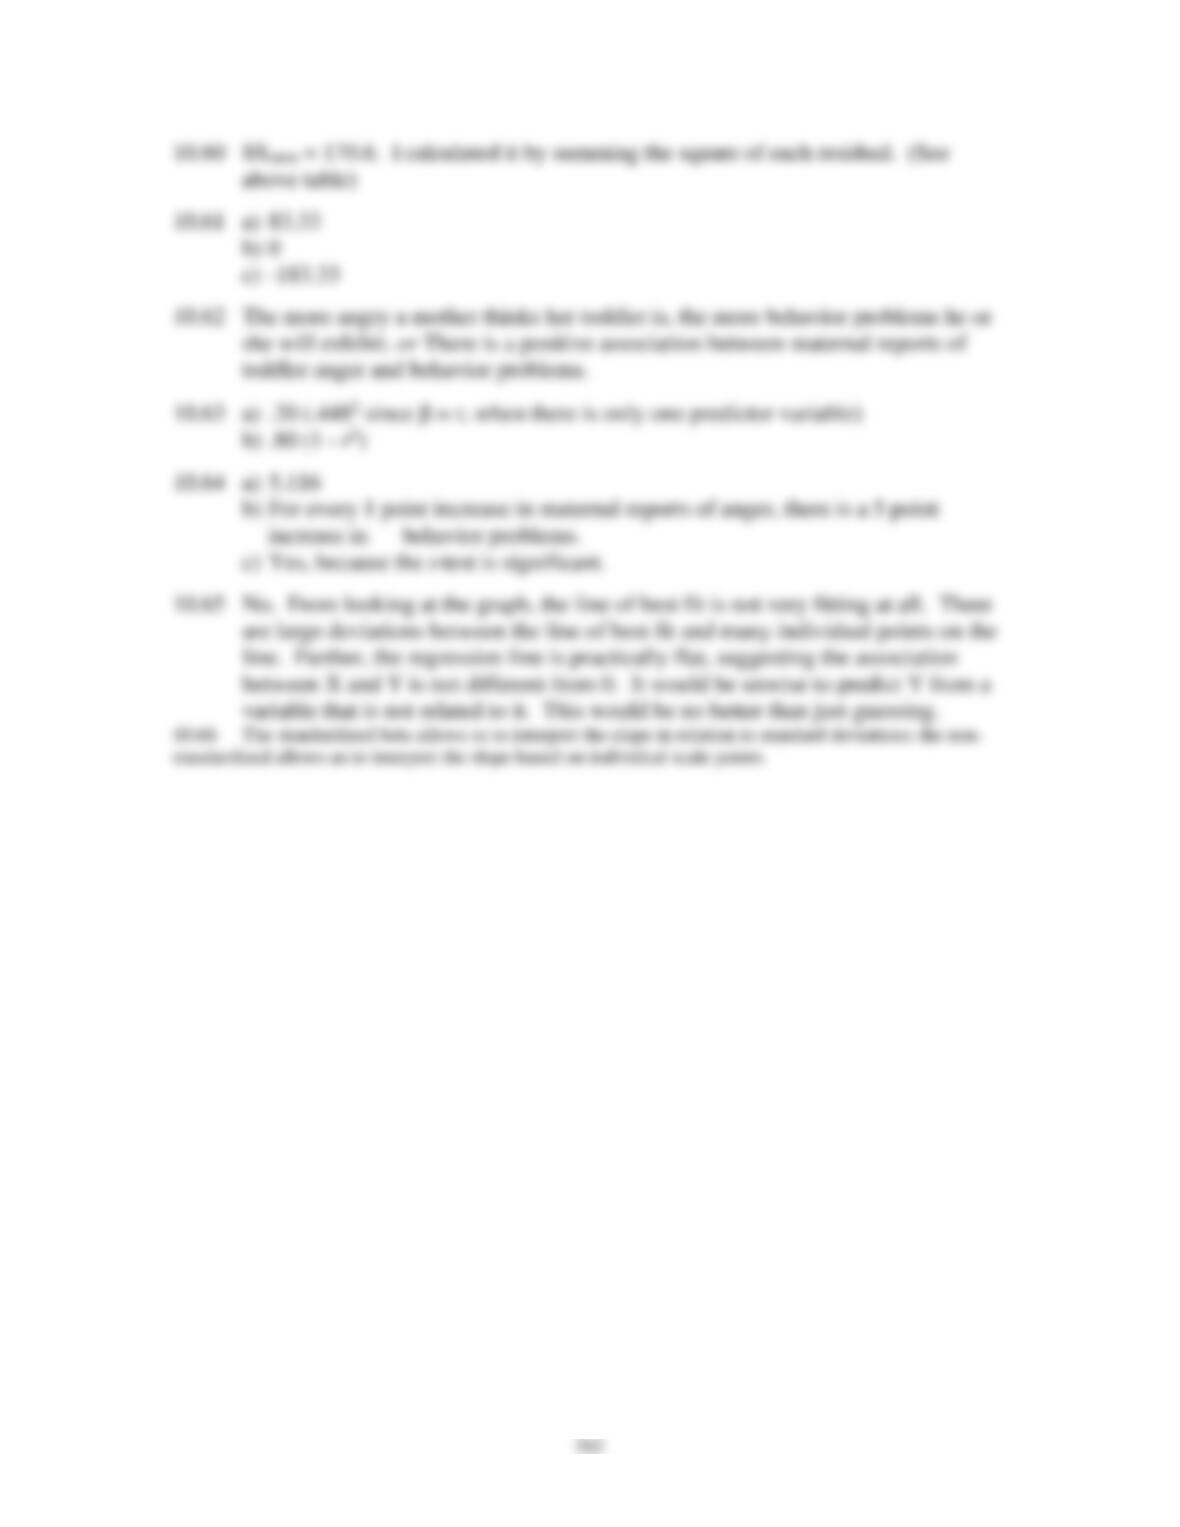
10.58 Given the following values, calculate the regression equation.
Age of car (years)
Mileage
1.00
40.00
1.00
25.00
2.00
37.00
2.00
35.00
3.00
36.00
3.00
35.00
4.00
32.00
5.00
30.00
6.00
25.00
10.00
20.00
10.59 Calculate the residuals for the previous data. Explain how you did it.
10.60 Calculate SSerror for the previous data. Explain how you did it.
10.61 Given this regression equation,
Y
ˆ
= .3 X + 25, estimate the values of X given the
following values of Y.
a) Y = 0
b) Y = 25
c) Y = -30
10.62 Write a sentence interpreting the regression data in the following table.
30.377
4.599
6.605
.000
5.116
1.287
.448
3.975
.000
(Constant)
Maternal report of
toddler anger
Model
1
B
Std. Error
Unstandardized
Coefficients
Beta
Standardized
Coefficients
t
Sig.
Dependent variable: Child Behavior Problem Score
10.63 Answer the following questions based on the regression data in the previous table.
a) What percent of variability in behavior problems is accounted for by anger?
b) What percent of variability in behavior problems independent of anger?
10.64 Given the data in the previous table:
a) What is the slope of the regression line?
b) What does the value of the slope mean here?
c) Is the slope significantly different from 0?
Chapter 10
291
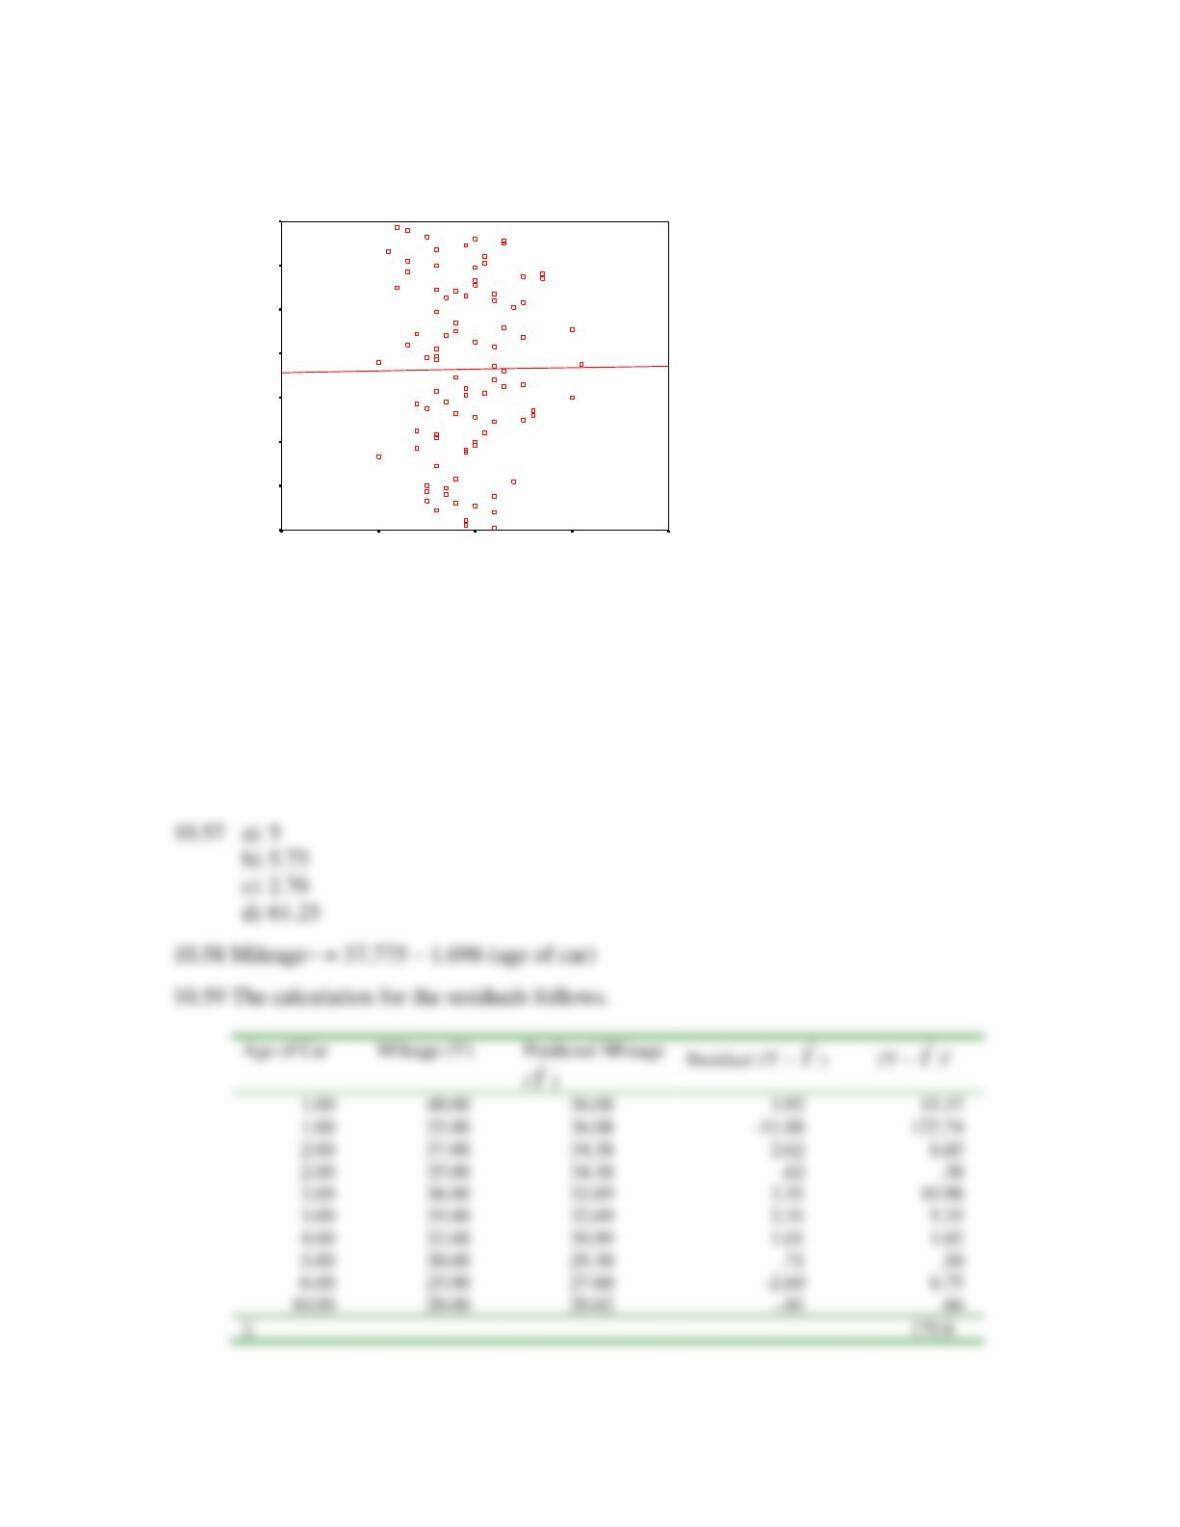
10.65 Given the following data, do you believe the regression equation would be a
reliable way to predict values of Y. Explain your answer.
5040302010
140
120
100
80
60
40
20
0
10.66 Briefly describe the difference between the standardized beta coefficient and the
unstandardized b
Answers to Open-ended Questions
Chapter 10
Test Bank