Externalities 2503
9. The supply curve for a product reflects the
a. willingness to pay of the marginal buyer.
b. quantity buyers will ultimately purchase of the product.
c. cost to sellers of producing the product.
d. seller‘s profit from producing the product.
10. Since air pollution creates a negative externality,
a. social welfare will be enhanced when some, but not all air pollution is eliminated.
b. social welfare is optimal when all air pollution is eliminated.
c. governments should encourage private firms to consider only private costs.
d. the free market result maximizes social welfare.
2504 Externalities
11. The difference between social cost and private cost is a measure of the
a. loss in profit to the seller as the result of a negative externality.
b. cost of an externality.
c. cost reduction when the negative externality is eliminated.
d. cost incurred by the government when it intervenes in the market.
12. When a market is characterized by an externality, the government
a. can correct the market failure only in the case of positive externalities.
b. can correct the market failure only in the case of negative externalities.
c. can correct the market failure in the case of both positive and negative externalities by inducing
market participants to internalize the externality.
d. cannot correct for externalities due to the existence of patents.
Externalities 2505
13. Which of the following statements is correct?
a. Government should tax goods with either positive or negative externalities.
b. Government should tax goods with negative externalities and subsidize goods with positive
externalities.
c. Government should subsidize goods with either positive or negative externalities.
d. Government should tax goods with positive externalities and subsidize goods with negative
externalities.
2506 Externalities
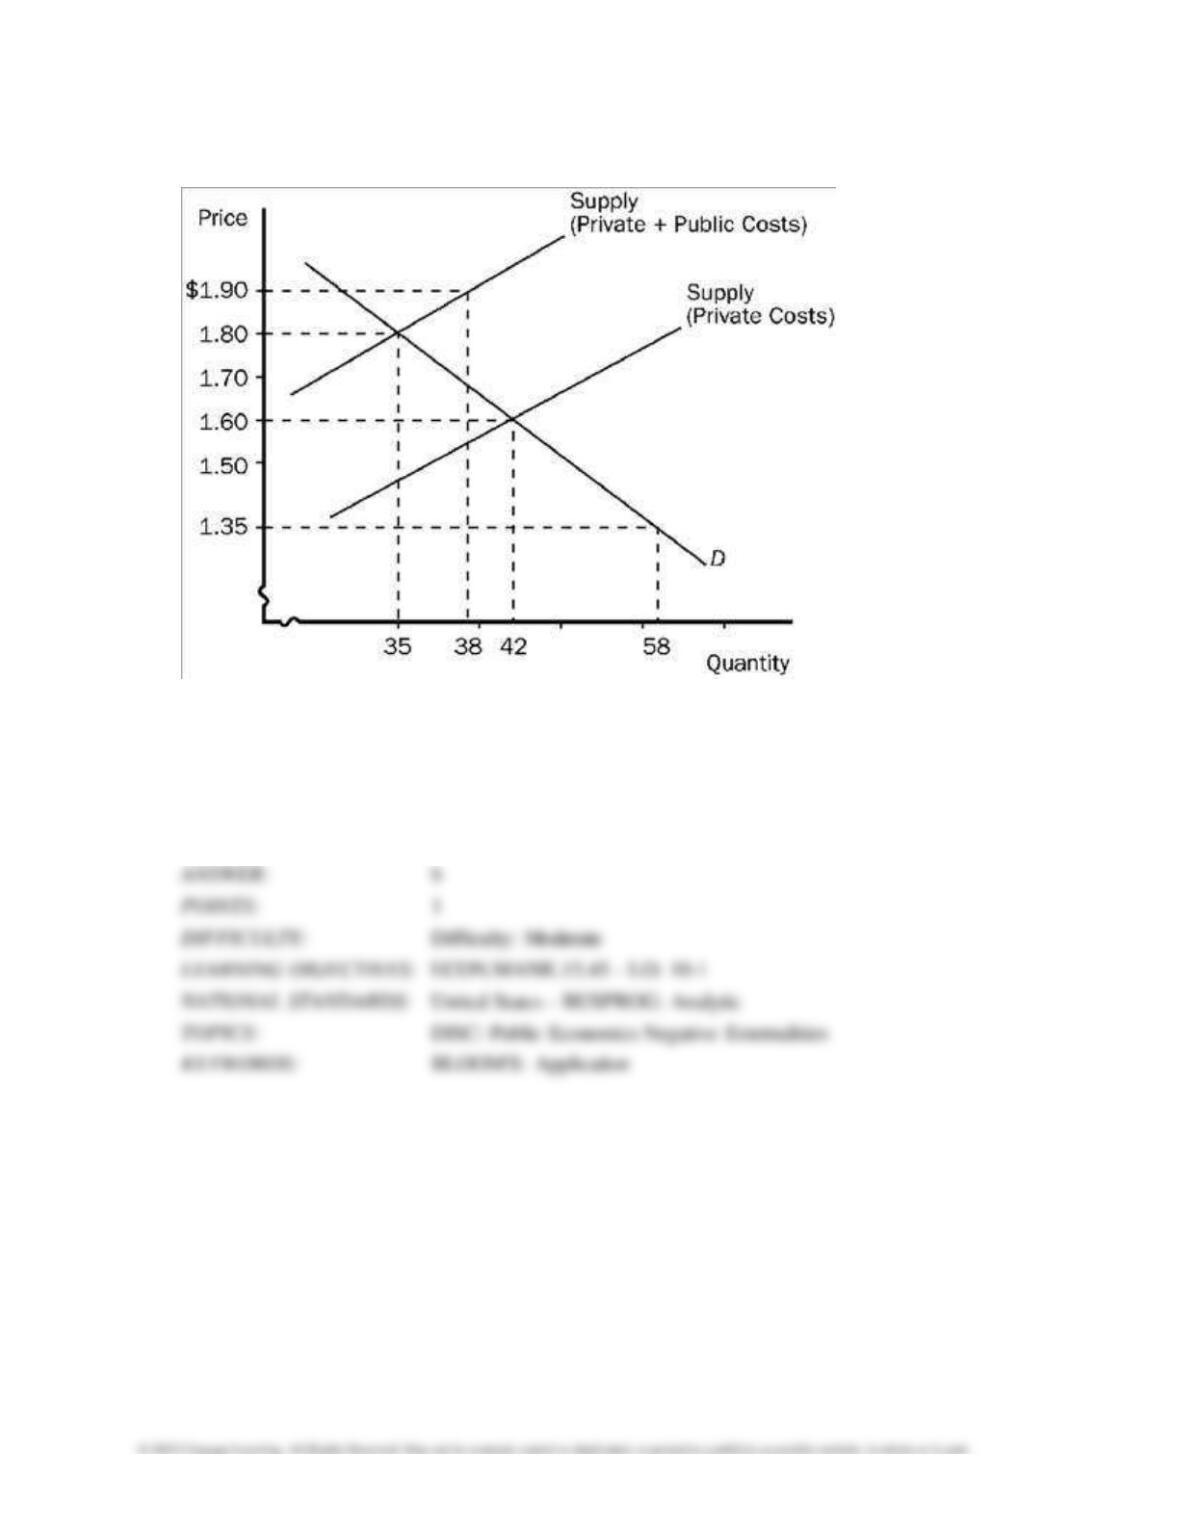
Figure 10-1
14. Refer to Figure 10-1. This graph represents the tobacco industry. The industry creates
a. positive externalities.
b. negative externalities.
c. no externalities.
d. no equilibrium in the market.
Externalities 2507
15. Refer to Figure 10-1. This graph represents the tobacco industry. Without any government
intervention, the equilibrium price and quantity are
a. $1.90 and 38 units, respectively.
b. $1.80 and 35 units, respectively.
c. $1.60 and 42 units, respectively.
d. $1.35 and 58 units, respectively.
16. Refer to Figure 10–1. This graph represents the tobacco industry. The socially optimal price and
quantity are
a. $1.90 and 38 units, respectively.
b. $1.80 and 35 units, respectively.
c. $1.60 and 42 units, respectively.
d. $1.35 and 58 units, respectively.
2508 Externalities
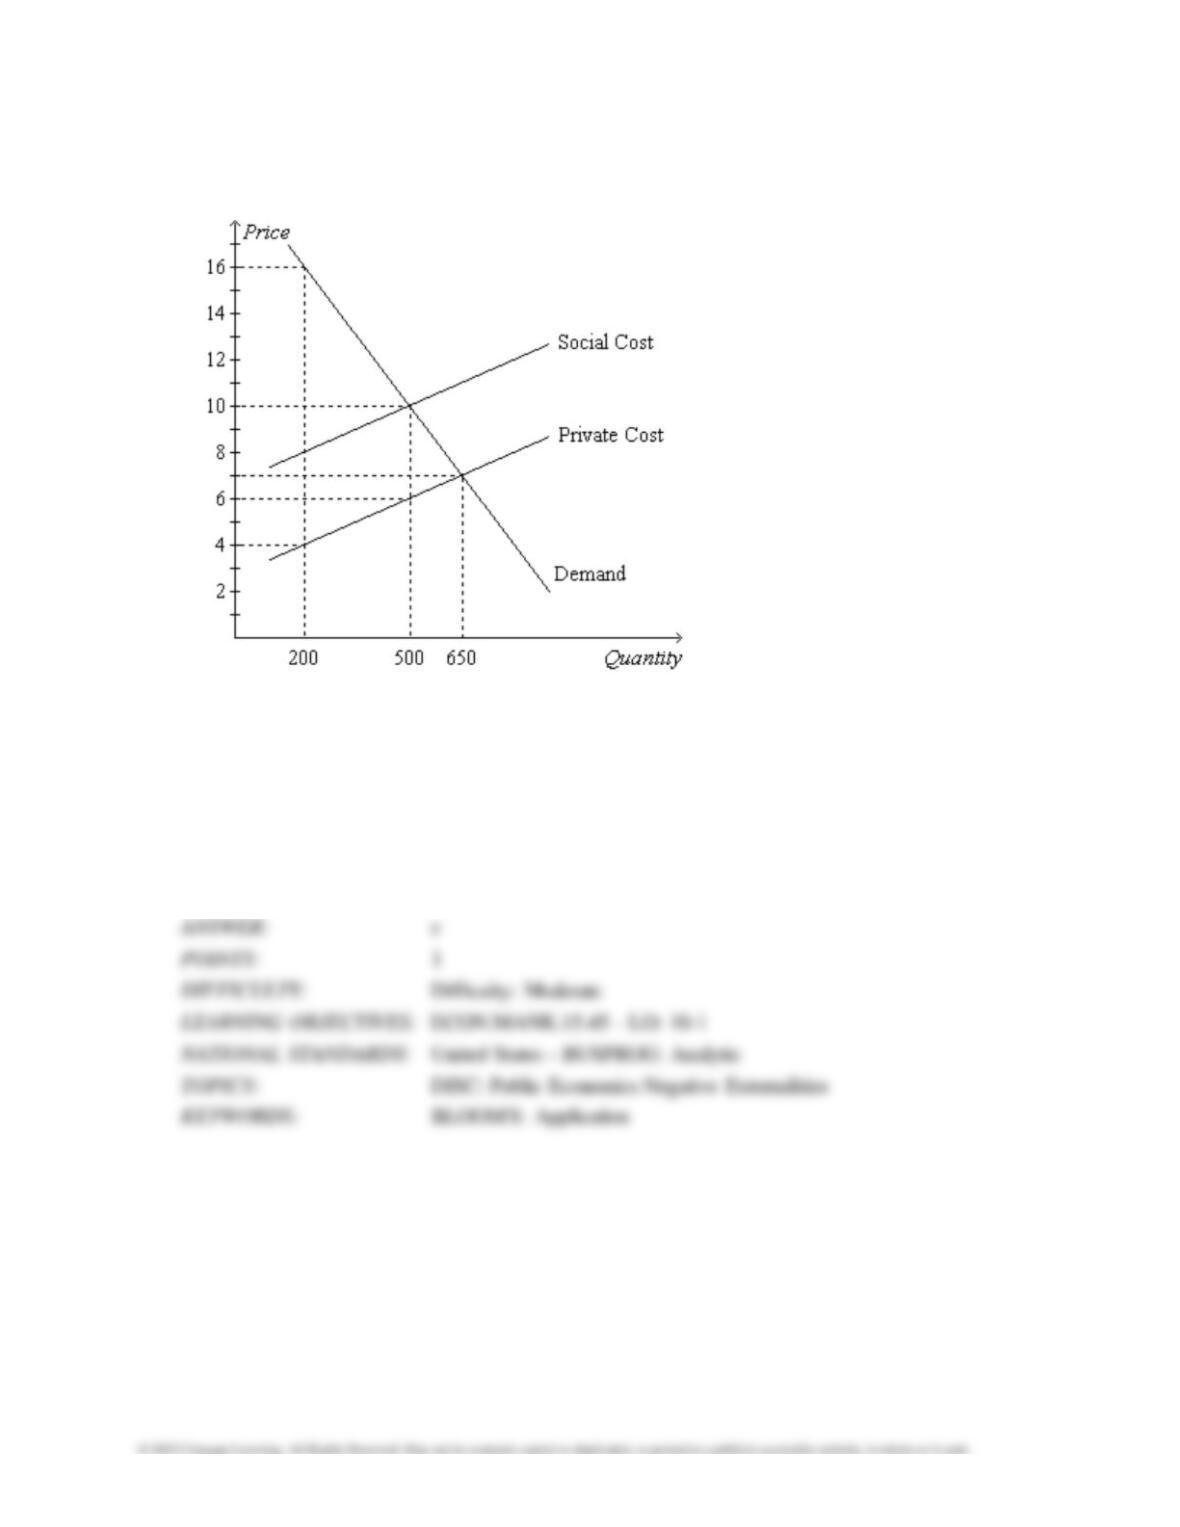
Figure 10-2. The graph depicts the market for plastic.
17. Refer to Figure 10-2. Suppose that the production of plastic creates a social cost which is
depicted in the graph above. Without any government regulation, how much plastic will be
produced?
a. 200
b. 500
c. 650
d. 900
Externalities 2509
18. Refer to Figure 10–2. Suppose that the production of plastic creates a social cost which is
depicted in the graph above. Without any government regulation, what price will the firm charge
per unit of plastic?
a. $4.00
b. $6.00
c. $7.00
d. $10.00
19. Refer to Figure 10–2. Suppose that the production of plastic creates a social cost which is
depicted in the graph above. What is the socially optimal quantity of plastic?
a. 200 units
b. 450 units
c. 500 units
d. 650 units
2510 Externalities
20. Refer to Figure 10-2. The private value of the 200th unit of plastic exceeds the social cost of
the 200th unit of plastic by
a. $4.
b. $8.
c. $12.
d. $16.
21. Refer to Figure 10-2. A benevolent social planner would like to see
a. 200 units of plastic produced.
b. 500 units of plastic produced.
c. 650 units of plastic produced.
d. more than 650 units of plastic produced.
Externalities 2511
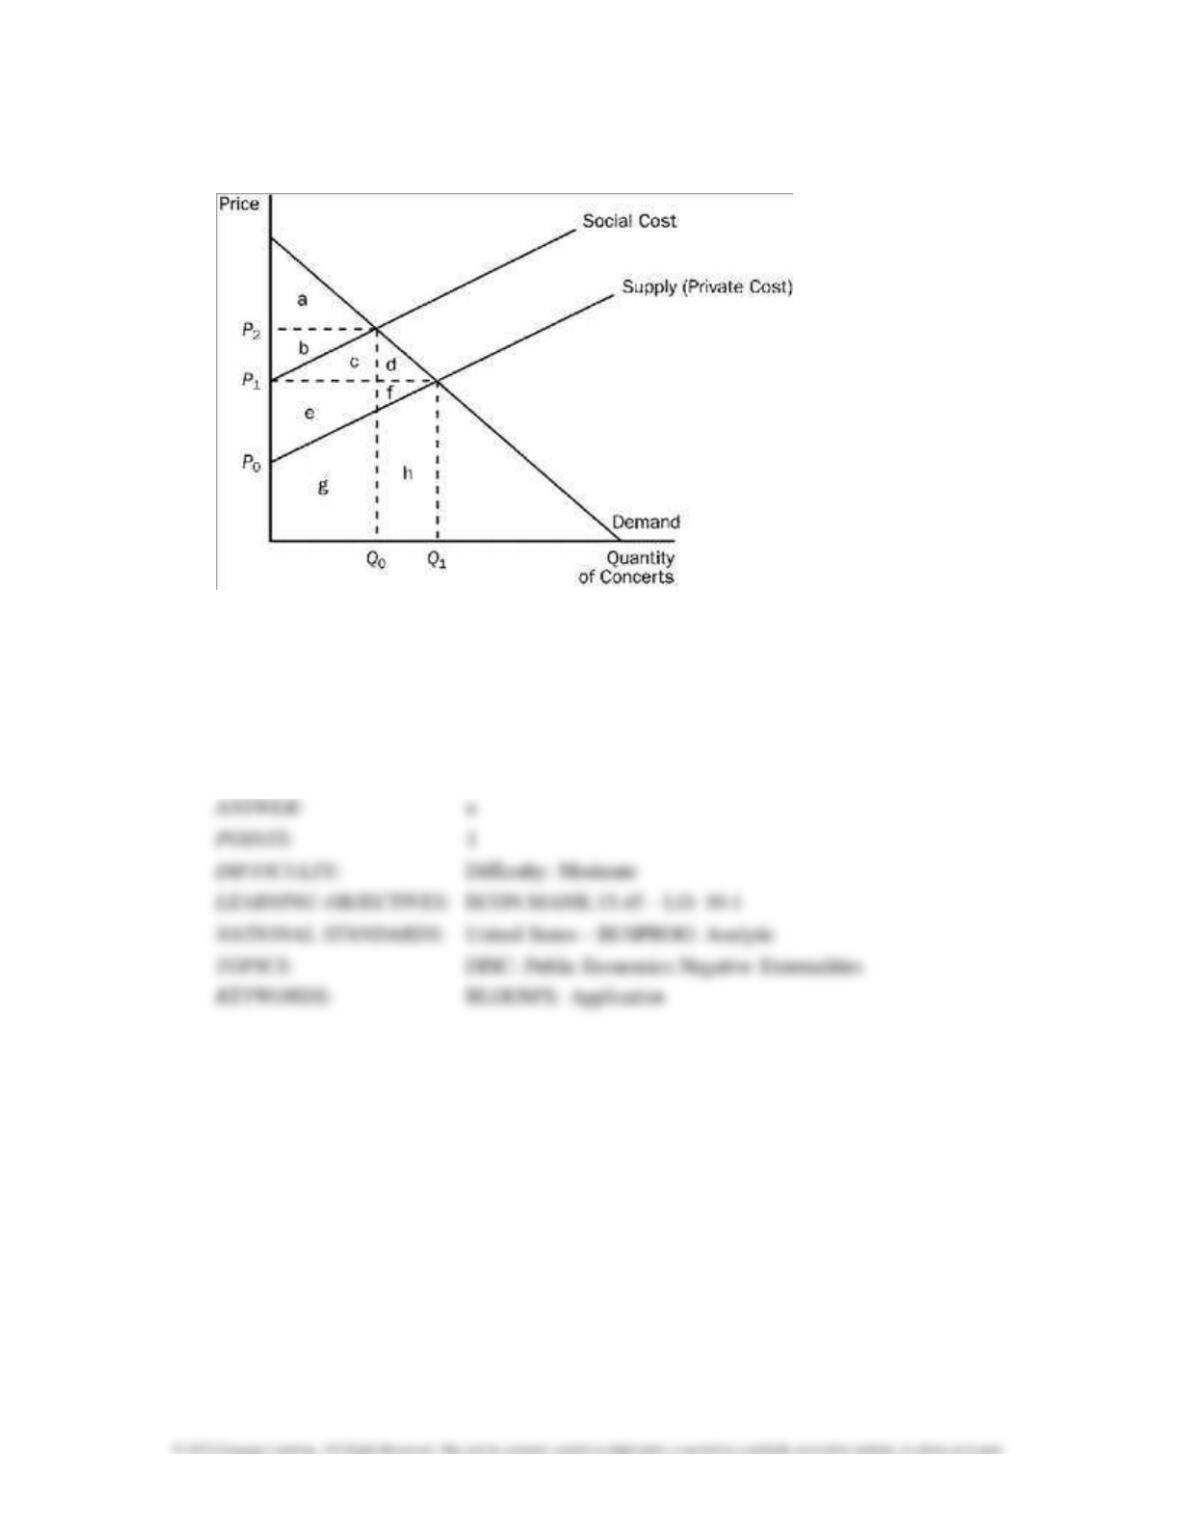
Figure 10-3
22. Refer to Figure 10-3. The social cost curve is above the supply curve because
a. it takes into account the external costs imposed on society by the concert.
b. it takes into account the effect of local noise restrictions on concerts in parks surrounded by
residential neighborhoods.
c. concert tickets are likely to cost more than the concert actually costs the organizers.
d. residents in the surrounding neighborhoods get to listen to the concert for free.

2512 Externalities
23. Refer to Figure 10-3. The difference between the social cost curve and the supply curve
reflects the
a. profit margin of each concert.
b. cost of spillover effects from the concert (e.g., noise and traffic).
c. value of concerts to society as a whole.
d. amount by which the city should subsidize the concert organizers.
24. Refer to Figure 10-3. At the private market outcome, the equilibrium price will be
a. P0.
b. P1.
c. P2.
d. None of the above is correct.
Externalities 2513
25. Refer to Figure 10–3. What price and quantity combination best represents the optimum price
and number of concerts that should be organized?
a. P1, Q1
b. P2, Q0
c. P2, Q1
d. The optimum quantity is zero concerts as long as residents in surrounding neighborhoods are
adversely affected by noise and congestion.
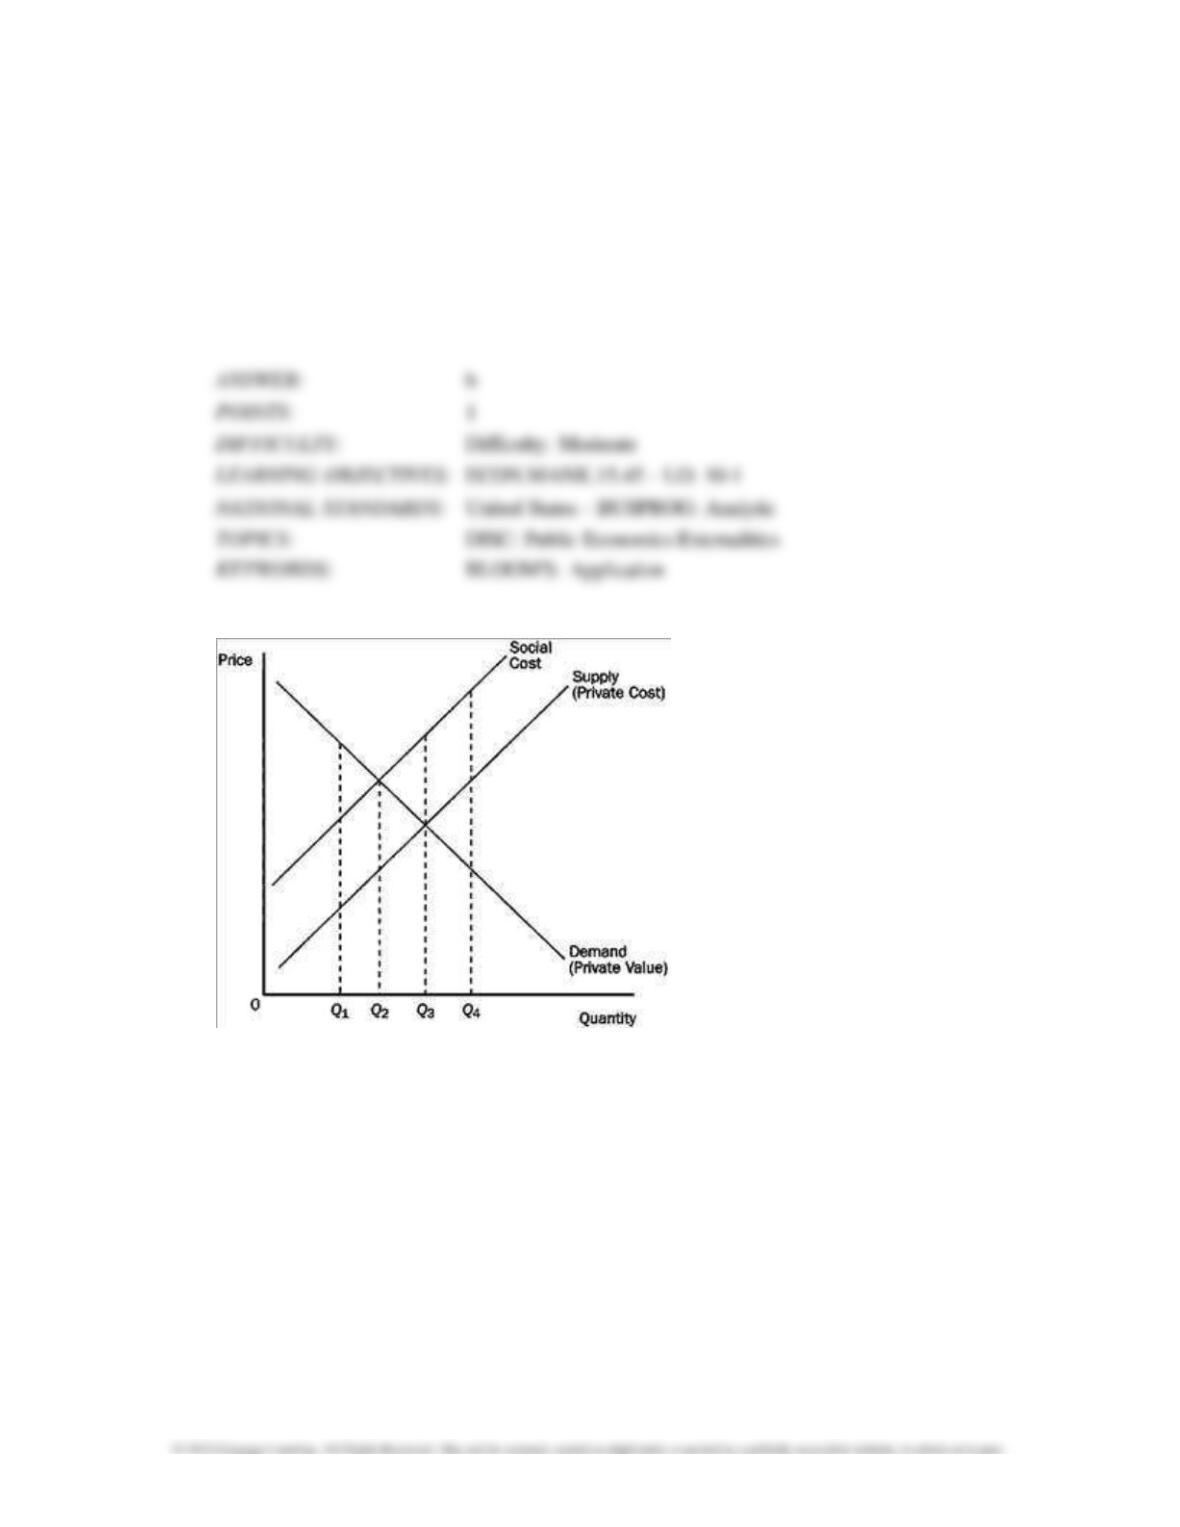
Figure 10-4
2514 Externalities
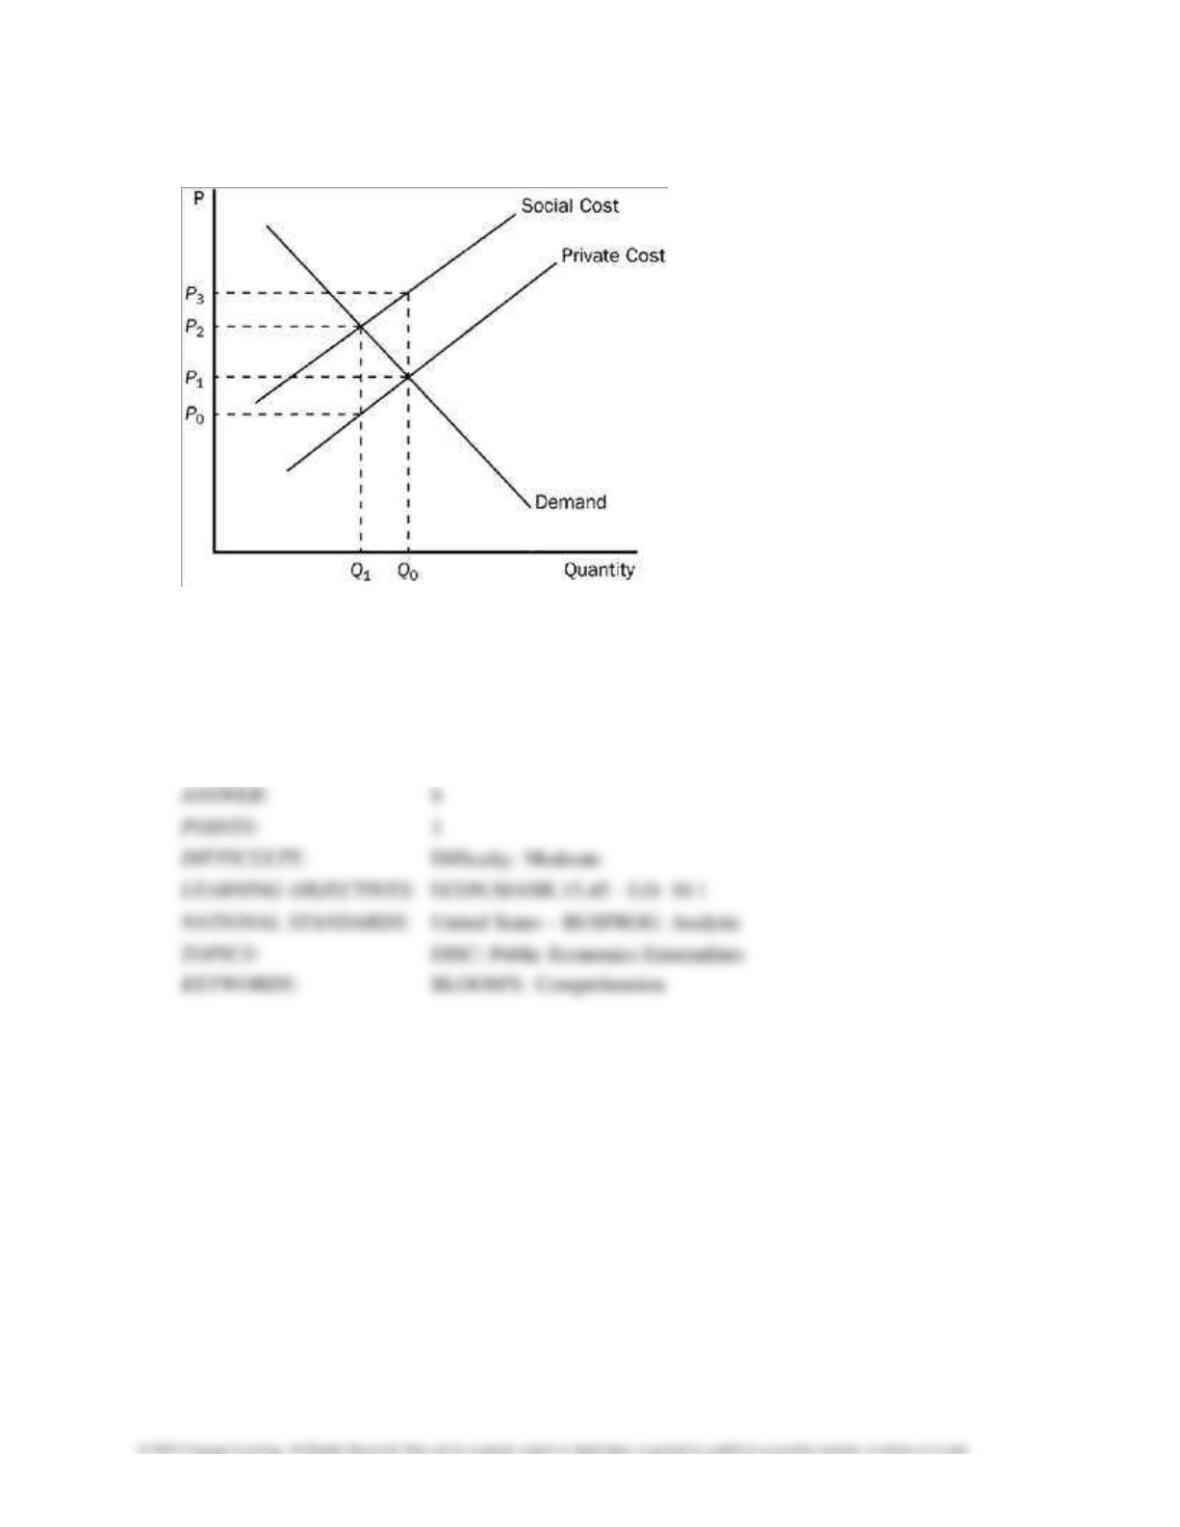
26. Refer to Figure 10-4. If this market is currently producing at Q4, then total economic well-being
would be maximized if output
a. decreased to Q1.
b. decreased to Q2.
c. decreased to Q3.
d. stayed at Q4.
27. Refer to Figure 10–4. This market is characterized by
a. government intervention.
b. a positive externality.
c. a negative externality.
d. None of the above is correct.
Externalities 2515
28. Refer to Figure 10–4. Without government intervention, the equilibrium quantity would be
a. Q1.
b. Q2.
c. Q3.
d. Q4.
29. Refer to Figure 10-4. The socially optimal quantity would be
a. Q1.
b. Q2.
c. Q3.
d. Q4.
2516 Externalities
30. Refer to Figure 10-4. This market
a. has no need for government intervention.
b. would benefit from a tax on the product.
c. would benefit from a subsidy for the product.
d. would maximize total well–being at Q3.
31. Refer to Figure 10-4. If this market is currently producing at Q2, then total economic well-being
would increase if output
a. increased beyond Q4.
b. decreased to Q1.
c. increased to Q3.
d. stayed at Q2.

Externalities 2517
32. Refer to Figure 10-4. If all external costs were internalized, then the market’s equilibrium output
would be
a. Q1.
b. Q2.
c. Q3.
d. Q4.
33. Refer to Figure 10-4. At Q3
a. the marginal consumer values this product less than the social cost of producing it.
b. every consumer values this product less than the social cost of producing it.
c. the cost to society is equal to the value to society.
d. the marginal consumer values this product more than the private cost.
2518 Externalities
Figure 10-5
34. Refer to Figure 10-5. Which price and quantity combination represents the social optimum?
a. P0 and Q1.
b. P2 and Q1.
c. P1 and Q0.
d. P2 and Q0.
Externalities 2519
35. Refer to Figure 10–5. Which of the following statements is correct?
a. The marginal benefit of the positive externality is measured by P3 – P1.
b. The marginal cost of the negative externality is measured by P3 – P2.
c. The marginal cost of the negative externality is measured by P3 – P1.
d. The marginal cost of the negative externality is measured by P3 – P0.
Figure 10-6
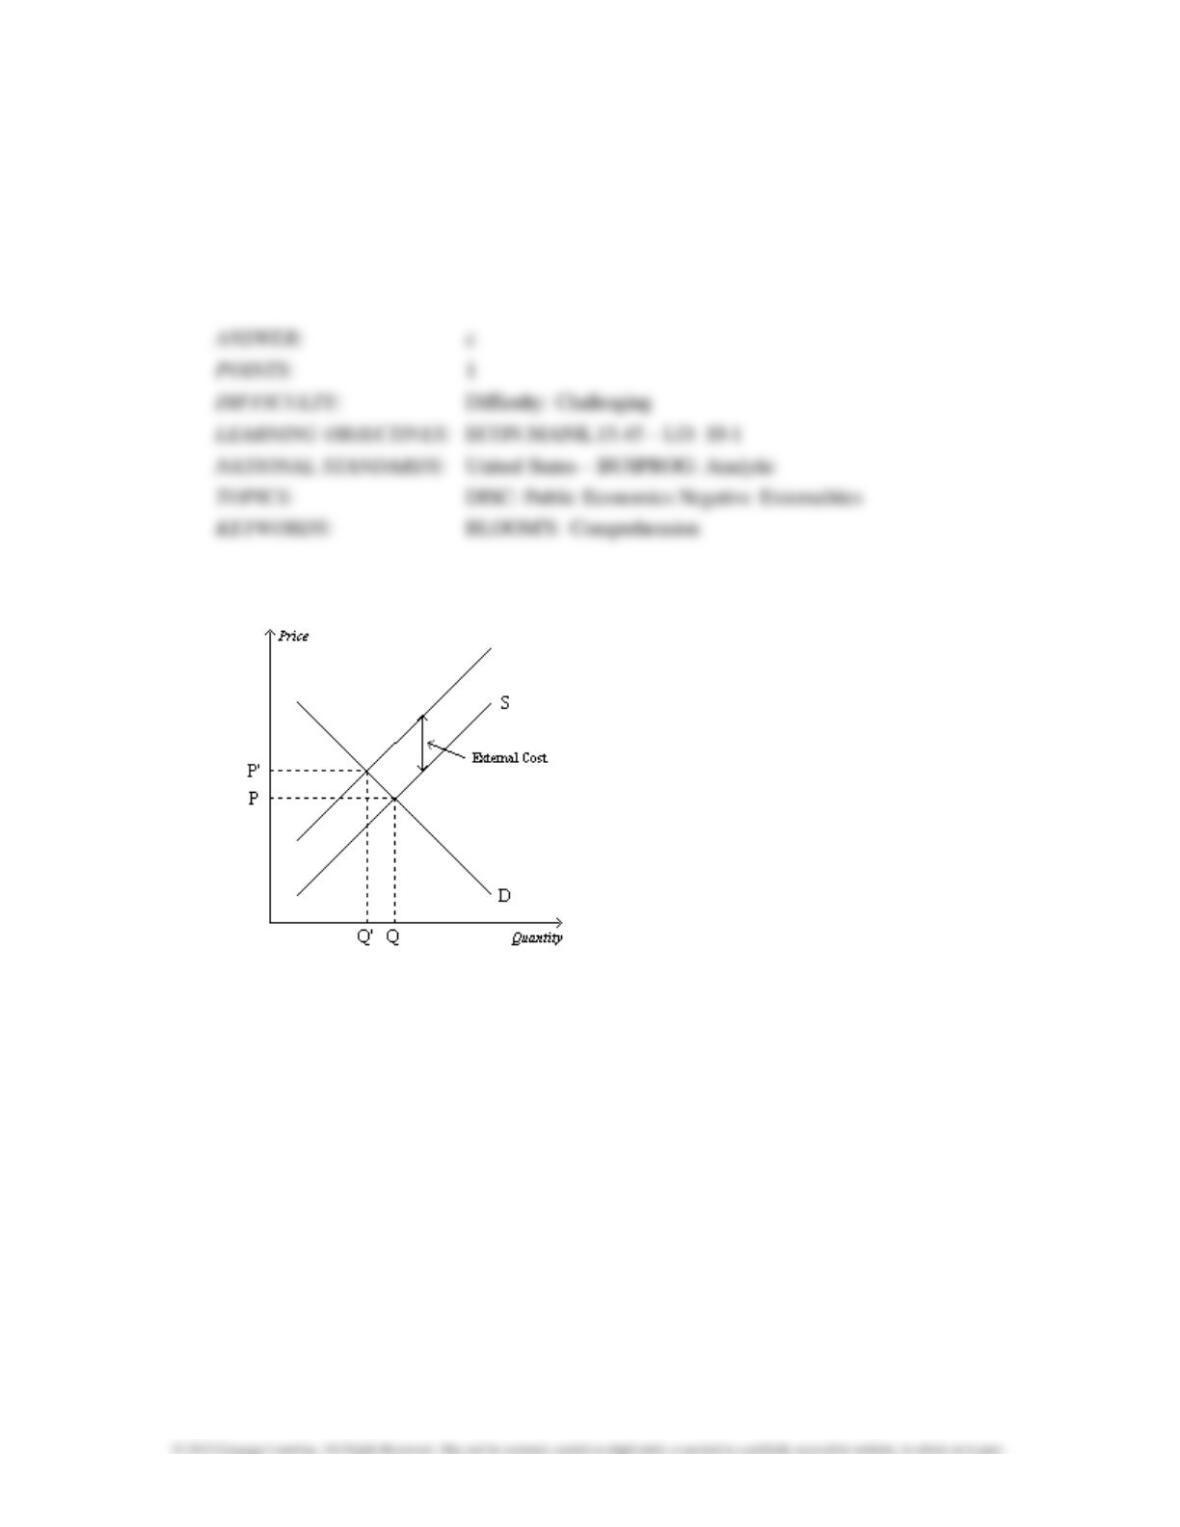
2520 Externalities
36. Refer to Figure 10-6. Which price represents the equilibrium price of the product in this
market?
a. P
b. P’
c. Either P or P’. It is necessary to know whether the externality is positive or negative to
determine which of these is the equilibrium price.
d. Some price between P and P’. The equilibrium price depends on the negotiating skills of the
interested parties.
37. Refer to Figure 10-6. Which quantity represents the socially–optimal quantity of output in this
market?
a. Q
b. Q’
c. Either Q or Q’. It is necessary to know whether the externality is positive or negative to
determine the socially-optimal quantity.
d. Some quantity between Q and Q’. The socially-optimal quantity depends on the negotiating
skills of the interested parties.
Externalities 2521
Table 10-1
The following table shows the private value, private cost, and external cost for various quantities
of output in a market.
38. Refer to Table 10–1. What is the equilibrium quantity of output in the market?
a. 2 units
b. 3 units
c. 4 units
d. 5 units
39. Refer to Table 10-1. What is the socially-optimal quantity of output in this market?
a. 1 unit
b. 2 units
c. 3 units
d. 4 units
Quantity
Private Value
Private Cost
External Cost
1
$14
$10
$2
2
13
11
2
3
12
12
2
4
11
13
2
5
10
14
2
6
9
15
2
7
8
16
2
2522 Externalities
40. Refer to Table 10-1. How large would a corrective tax need to be to move this market from the
equilibrium outcome to the socially-optimal outcome?
a. $2
b. $3
c. $9 d. $10
41. Refer to Table 10-1. Which of the following statements is correct?
a. If the external benefit per unit of output were $0 instead of $2, then the socially efficient
quantity of output would be 4 units.
b. A tax of $4 per unit would enable this market to move from the equilibrium quantity of output to
the socially optimal level of output.
c. Taking the external cost into account, total surplus declines when the 3rd unit of output is
produced and consumed.
d. The market for flu shots is a market to which the concepts in this table apply very well.