TOP: Nonprice-Level Determinants of Aggregate Supply KEY: Bloom’s: Comprehension
99. How will an increase in the world price of crude oil influence the economy of an oil-importing country
such as the United States?
a.
Aggregate supply will decrease, leading to a decrease in real GDP.
b.
Aggregate supply will increase, leading to an increase in real GDP.
c.
Aggregate supply will increase, leading to an increase in prices and smaller GDP.
d.
A change in the price of an imported good will not affect the domestic economy of an oil-
importing country.
100. Other factors held constant, a decrease in resource prices will shift the aggregate:
a.
demand curve leftward.
c.
supply curve leftward.
b.
demand curve rightward.
d.
supply curve rightward.
101. An increase in oil prices will shift the aggregate:
a.
demand curve leftward.
c.
supply curve leftward.
b.
demand curve rightward.
d.
supply curve rightward.
102. Lower taxes on businesses will shift the aggregate:
a.
demand curve rightward.
c.
supply curve rightward.
b.
demand curve leftward.
d.
supply curve leftward.
103. A reduction in regulation will shift the aggregate:
a.
supply curve leftward.
c.
demand curve leftward.
b.
supply curve rightward.
d.
demand curve rightward.
104. Advances in technology will shift the aggregate:
a.
demand curve rightward.
c.
demand curve leftward.
b.
supply curve rightward.
d.
supply curve leftward.
105. Greater entrepreneurship in the economy will shift the aggregate:
a.
supply curve rightward.
c.
demand curve rightward.
b.
supply curve leftward.
d.
demand curve leftward.
106. An increase in regulation will shift the aggregate:
a.
demand curve leftward.
c.
supply curve leftward.
b.
supply curve rightward.
d.
demand curve rightward.
107. Aggregate supply increases when:
a.
wage rates decrease while the economy’s price level remains unchanged.
b.
resource availability is reduced.
c.
there are fewer workers.
d.
there is less capital and the price level remains unchanged.
e.
there are increased inflationary expectations of labor.
108. If a new method for obtaining oil from dry oil fields is found, then we will see:
a.
the AS curve shift to the left.
b.
a movement to the left along the AD curve.
c.
the AD curve shift to the left.
d.
the AD curve shift to the right.
e.
the AS curve shift to the right.
109. A decrease in aggregate supply will cause the price level to:
a.
rise and GDP to fall.
b.
rise and GDP to rise.
c.
rise and the unemployment rate to fall.
d.
fall and GDP to rise.
e.
fall and the unemployment rate to rise.
110. An increase in aggregate supply will cause the price level to:
a.
rise and GDP to rise
b.
rise and GDP to fall.
c.
rise and the unemployment rate to fall.
d.
fall and GDP to rise.
e.
fall and the unemployment rate to rise.
111. The aggregate supply curve will shift to the right when the:
a.
amount of labor in the society decreases.
b.
capital stock of the society shrinks.
c.
amount of natural resources in the society gets smaller.
d.
amount of labor in the society increases.
e.
price level in the economy rises.
112. Stagflation occurs when the economy experiences:
a.
low unemployment and low inflation.
c.
low unemployment and rapid inflation.
b.
high unemployment and rapid inflation.
d.
high unemployment and low inflation.
113. Which of the following events is the most likely to create stagflation?
a.
An increase in the money supply.
b.
A reduction in the amount spent on national defense.
c.
A doubling of oil prices.
d.
A decrease in investment spending.
114. The concurrent problems of inflation and unemployment are termed:
a.
depression.
b.
downturn.
c.
deflation.
d.
demand-pull inflation.
e.
stagflation.
115. Stagflation is a period of time when the economy is experiencing:
a.
inflation and low unemployment.
b.
high unemployment and low levels of inflation at the same time.
c.
high inflation and high unemployment at the same time.
d.
low inflation and low unemployment at the same time.
116. When the economy is experiencing high inflation and high unemployment at the same time, then it is
experiencing:
a.
stagnation.
b.
deflation.
c.
reflation.
d.
stagflation.
e.
innation.
117. A decrease in aggregate supply can result in:
a.
unemployment.
b.
demand-pull inflation.
c.
prosperity.
d.
cost-push inflation.
e.
a recession.
118. When OPEC caused the price of oil to rise in the early 1970s, the:
a.
aggregate supply curve shifted to the right.
b.
aggregate supply curve shifted to the left.
c.
aggregate demand curve shifted to the right.
d.
aggregate demand curve shifted to the left.
e.
price level in the economy fell.
119. Cost-push inflation occurs when the:
a.
aggregate demand curve shifts leftward while the aggregate supply curve is fixed.
b.
aggregate supply curve shifts leftward while the aggregate demand curve is fixed.
c.
aggregate demand curve shifts rightward while the aggregate supply curve is fixed.
d.
aggregate supply curve shifts rightward.
120. An increase in the price level caused by a rightward shift of the aggregate demand curve is called:
a.
cost-push inflation.
c.
demand shock inflation.
b.
supply shock inflation.
d.
demand-pull inflation.
121. In the United States during the 1960s, government spending dramatically increased to fight the
Vietnam War, which resulted in:
a.
demand-pull inflation.
c.
a disinflationary recession.
b.
cost-push inflation.
d.
stagflation.
122. Demand-pull inflation is caused by:
a.
an increase in aggregate demand.
c.
an increase in aggregate supply.
b.
a decrease in aggregate demand.
d.
a decrease in aggregate supply.
123. When the aggregate demand curve shifts to the right, intersecting the aggregate supply curve on its
upward-sloping or vertical segment,
a.
demand-pull inflation occurs.
b.
cost-push inflation occurs.
c.
stagflation occurs.
d.
deflation occurs.
e.
the shift pulls the price level down.
124. Demand-pull inflation is associated with a(n):
a.
decrease in the aggregate supply curve.
b.
increase in the aggregate supply curve.
c.
increase in the aggregate demand curve.
d.
decrease in the aggregate demand curve.
e.
decline in the availability of a productive resource
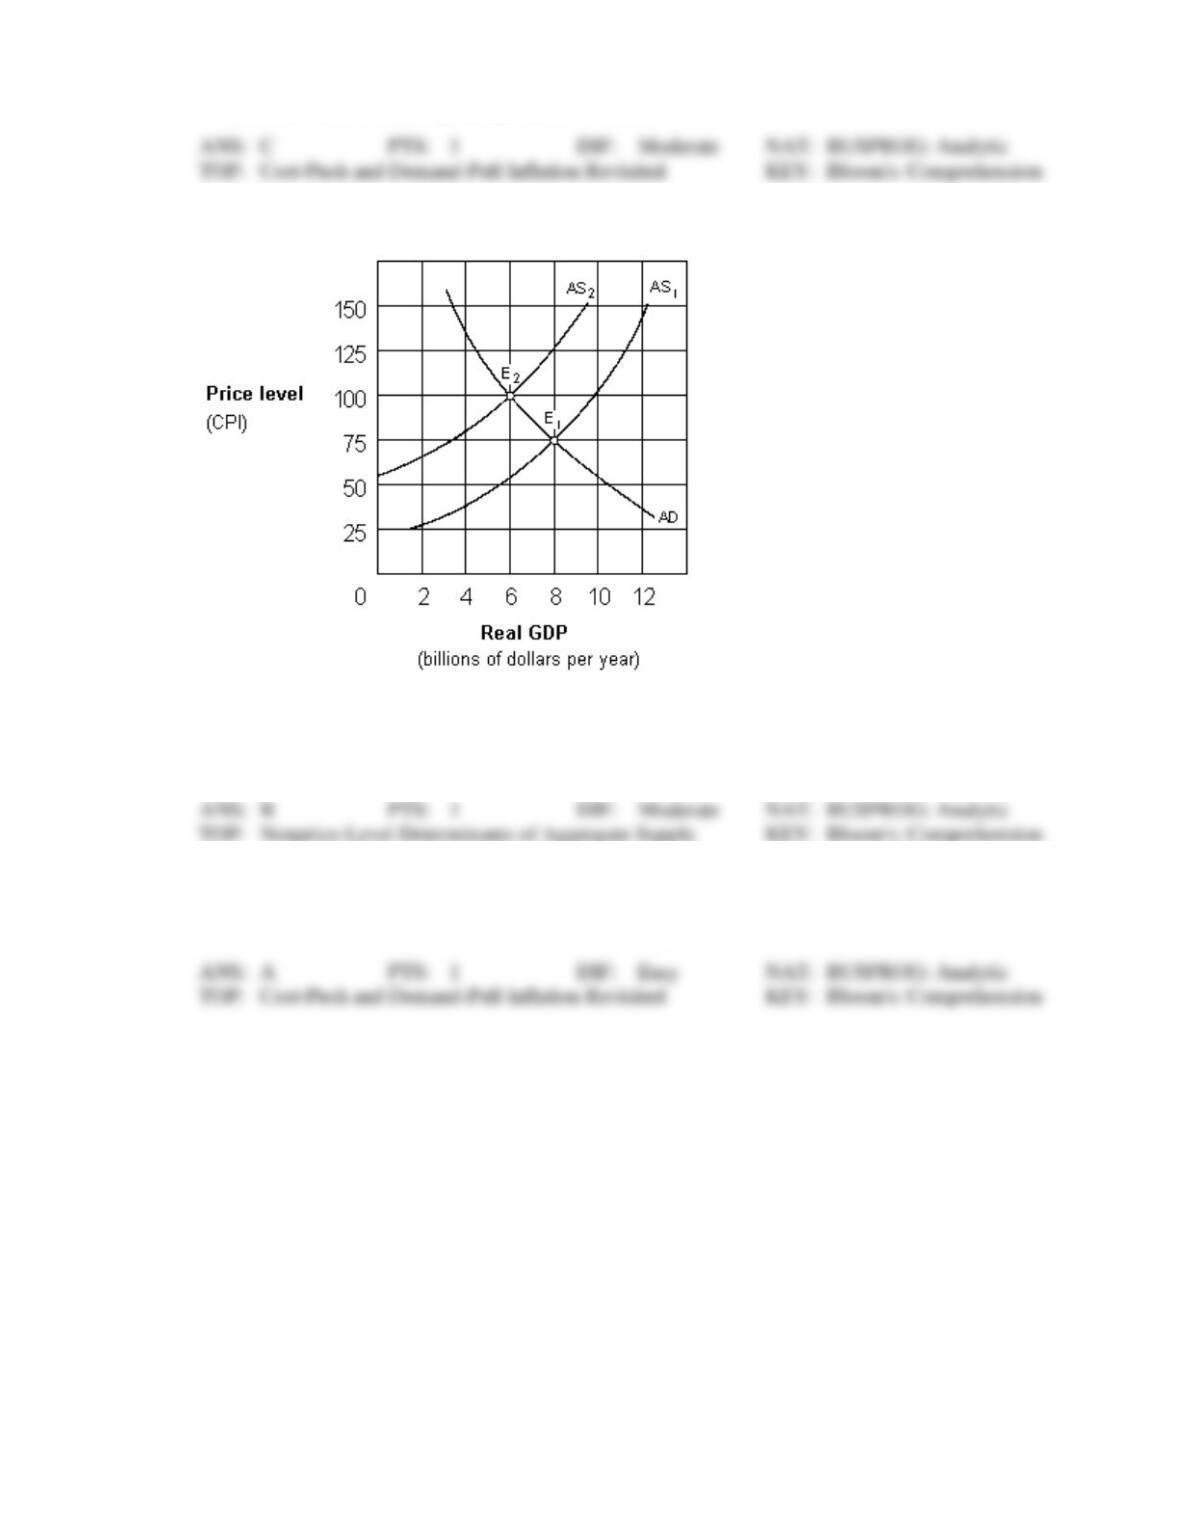
Exhibit 10-2 Aggregate supply and demand curves
125. A shift in the aggregate supply curve in Exhibit 10-2 from AS1 to AS2 would be caused by a(n):
a.
decrease in input prices.
c.
increase in real GDP.
b.
increase in input prices.
d.
decrease in real output.
126. In Exhibit 10-2, the change in equilibrium from E1 to E2 represents:
a.
cost-push inflation.
c.
price-push inflation.
b.
demand-pull inflation.
d.
wage-push inflation.
Exhibit 10-3 Aggregate supply and demand curves
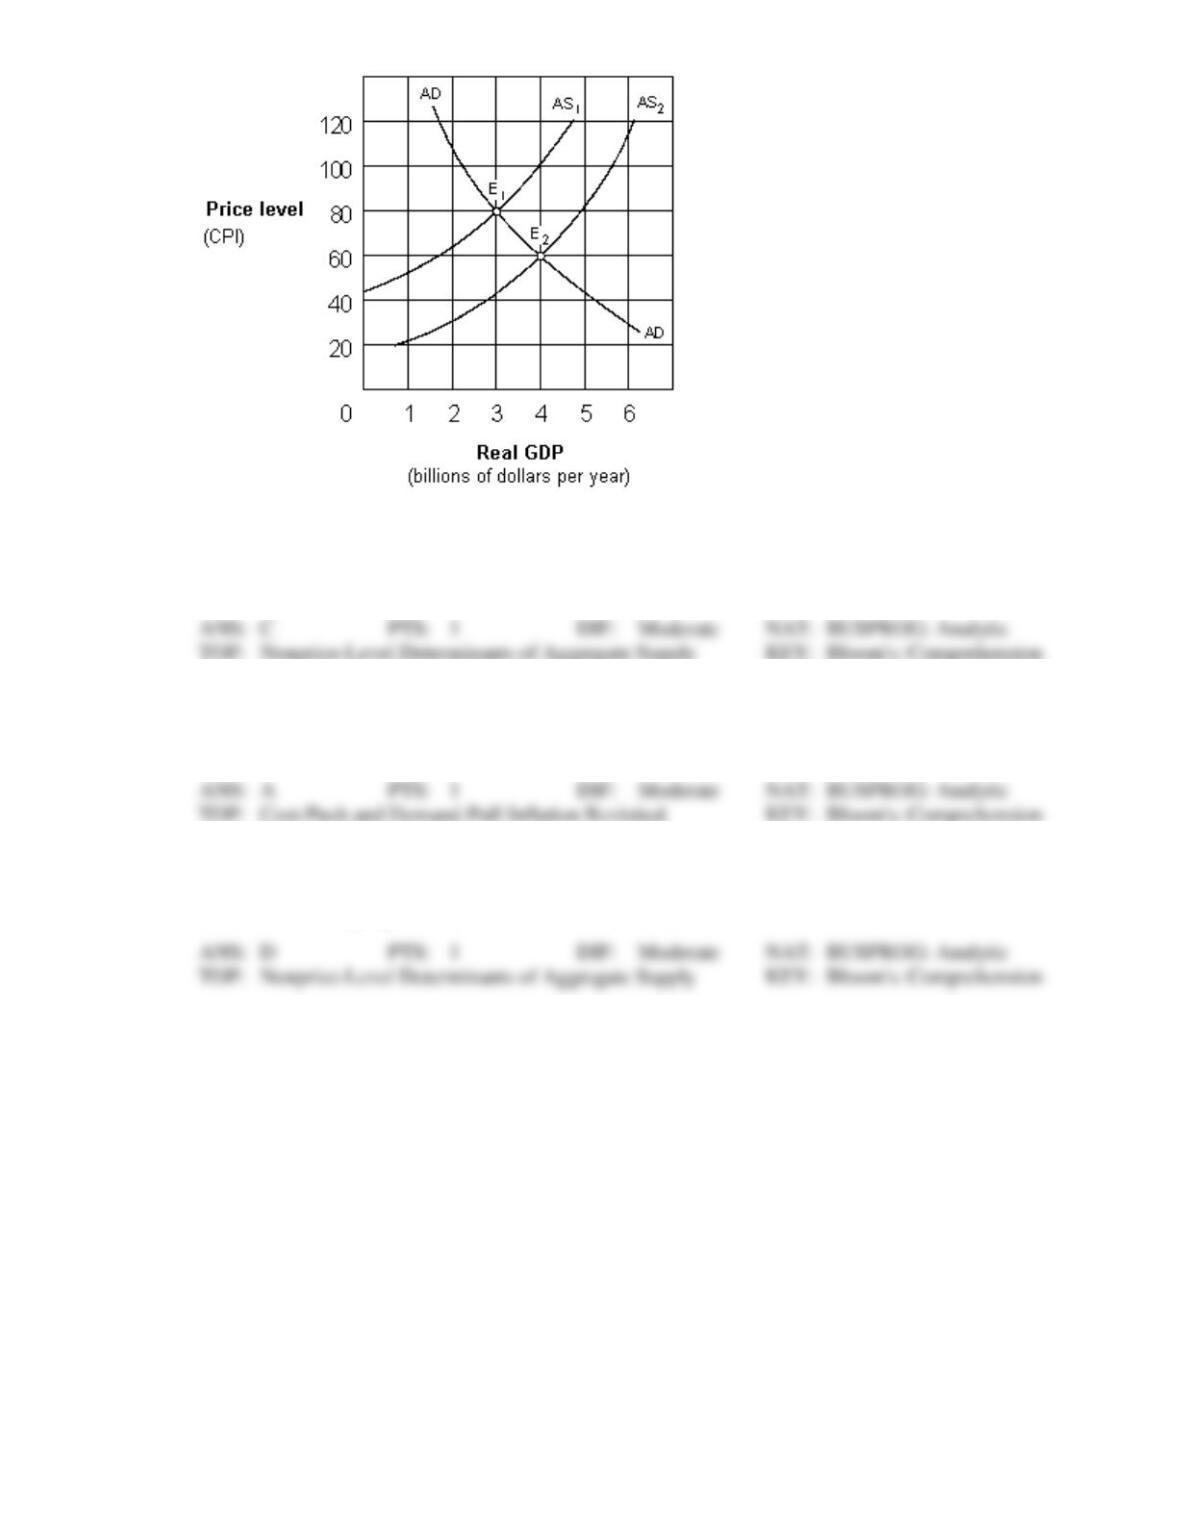
127. A shift in the aggregate supply curve in Exhibit 10-3 from AS1 to AS2 would be caused by a(n):
a.
increase in consumer spending.
c.
decrease in input prices.
b.
increase in input prices.
d.
decrease in real output.
128. In Exhibit 10-3, the change in equilibrium from E1 to E2 represents:
a.
deflation.
c.
price-push inflation.
b.
demand-pull inflation.
d.
cost-push inflation.
129. The shift from AS1 to AS2 in Exhibit 10-3 could be caused by a(n):
a.
sudden increase in the price of oil.
c.
increase in workers’ wages.
b.
increase in input prices for most firms.
d.
all of these.
Exhibit 10-4 Aggregate supply and demand curves
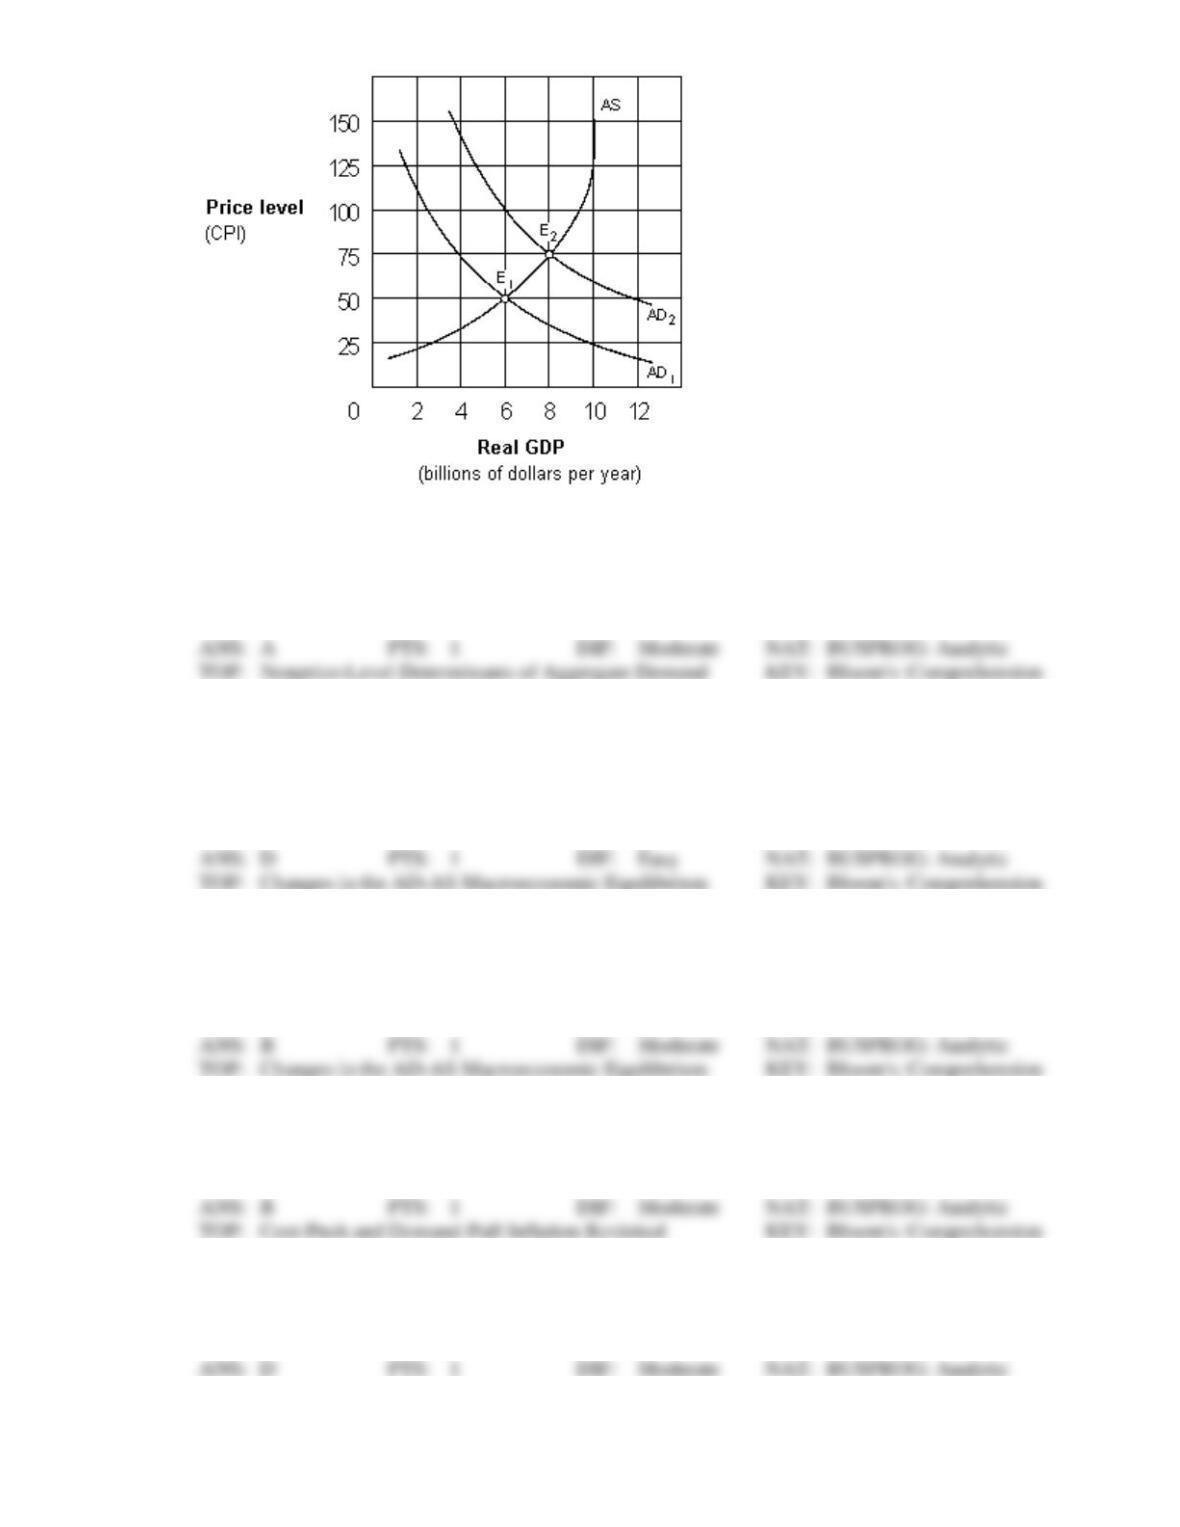
130. In Exhibit 10-4 which of the following is not consistent with a shift in the aggregate demand curve
from AD1 to AD2?
a.
A decrease in consumer spending.
c.
An increase in government spending.
b.
An increase in investment.
d.
An increase in net exports.
131. In Exhibit 10-4, point E2 represents:
a.
real GDP above full-employment GDP.
b.
real GDP that equals full-employment GDP.
c.
a depression.
d.
real GDP below full-employment GDP.
132. As the economy moves to the right in Exhibit 10-4 along the upward-sloping aggregate supply curve
the:
a.
unemployment rate rises.
c.
inflation rate falls.
b.
unemployment rate falls.
d.
none of these.
133. As the aggregate demand curve shifts from AD1 to AD2 in Exhibit 10-4, the economy experiences:
a.
cost-push inflation.
c.
wage-push inflation.
b.
demand-pull inflation.
d.
hyperinflation.
134. The increase in the price level as the economy moves from E1 to E2 in Exhibit 10-4 represents:
a.
cost-push inflation.
c.
wage push inflation.
b.
demand-shock inflation.
d.
demand-pull inflation.
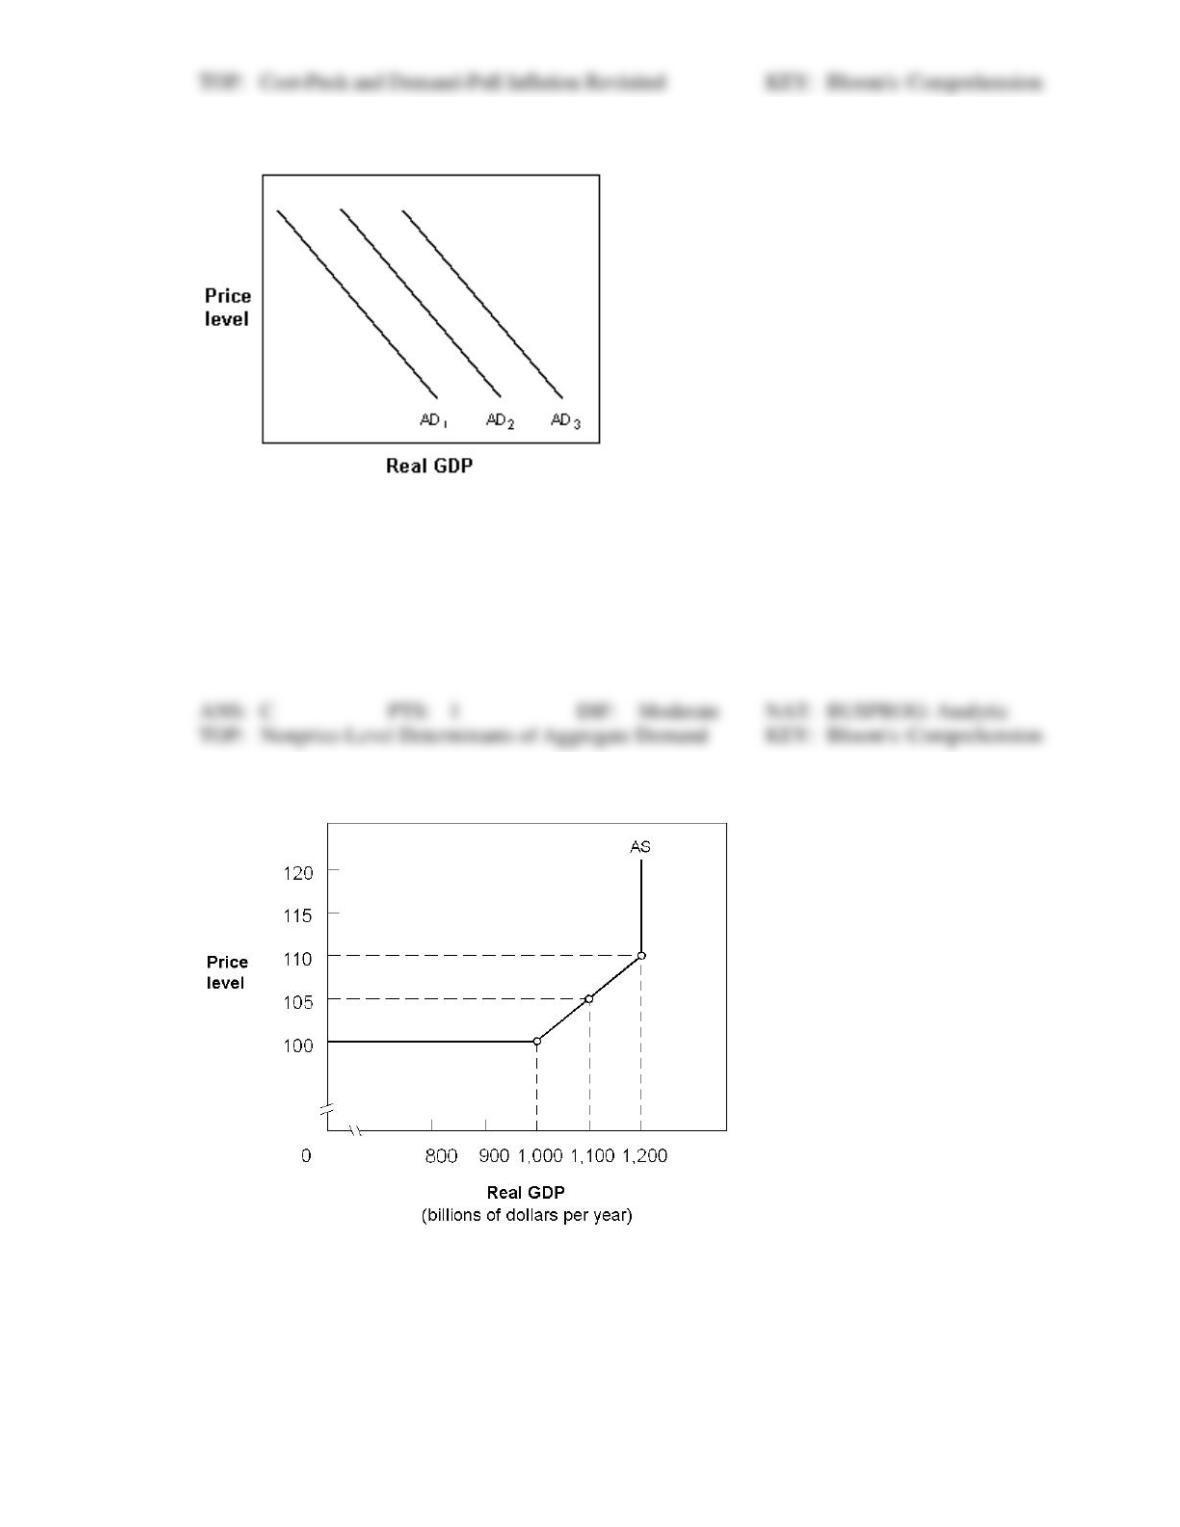
Exhibit 10-5 Aggregate demand curves
135. In Exhibit 10-5, which one of the following could cause the U.S. aggregate demand curve to move
from AD3 to AD2?
a.
Greater resource availability.
b.
Nonfluctuating resource availability.
c.
A recession in Japan.
d.
An increase in government grants for AIDS awareness programs.
e.
An expectation that future income will rise.
Exhibit 10-6 Aggregate supply curve
136. In Exhibit 10-6, where the GDP = $1,200 billion,
a.
everyone willing to work at the current wage is employed.
b.
the economy has reached full employment.
c.
GDP can increase to $1,100 billion without triggering an increase in the price level.
d.
no further increases in the price level can generate more real GDP.
e.
further increases in the price level must generate lower levels of employment.
137. In Exhibit 10-6, when the economy moves from a GDP of $1,000 billion to a GDP of $1,100 billion,
a.
higher wages will lower the cost of producing goods.
b.
real GDP and employment both increase, but only under conditions of constant prices.
c.
real GDP increases and employment decreases, but only under conditions of price level
increases.
d.
real GDP and employment both increase, but only under conditions of price level
increases.
e.
the economy has reached full employment.
138. In Exhibit 10-6, the economy’s employment potential is fully exhausted at:
a.
GDP = $1,000 billion.
b.
GDP = $1,100 billion.
c.
GDP = $1,200 billion.
d.
GDP slightly above $1,200 billion.
e.
the employment potential is never fully exhausted.
139. In Exhibit 10-6, the aggregate supply curve becomes vertical at GDP = $1,200 because:
a.
there are no more workers available at any wage rate to increase real GDP.
b.
the price level remains constant.
c.
the only workers available would demand higher wage rates.
d.
the economy is experiencing low employment and low production.
e.
the Treasury is no longer allowed to explain away the deficit with creative accounting
Exhibit 10-7 Aggregate supply and demand curves
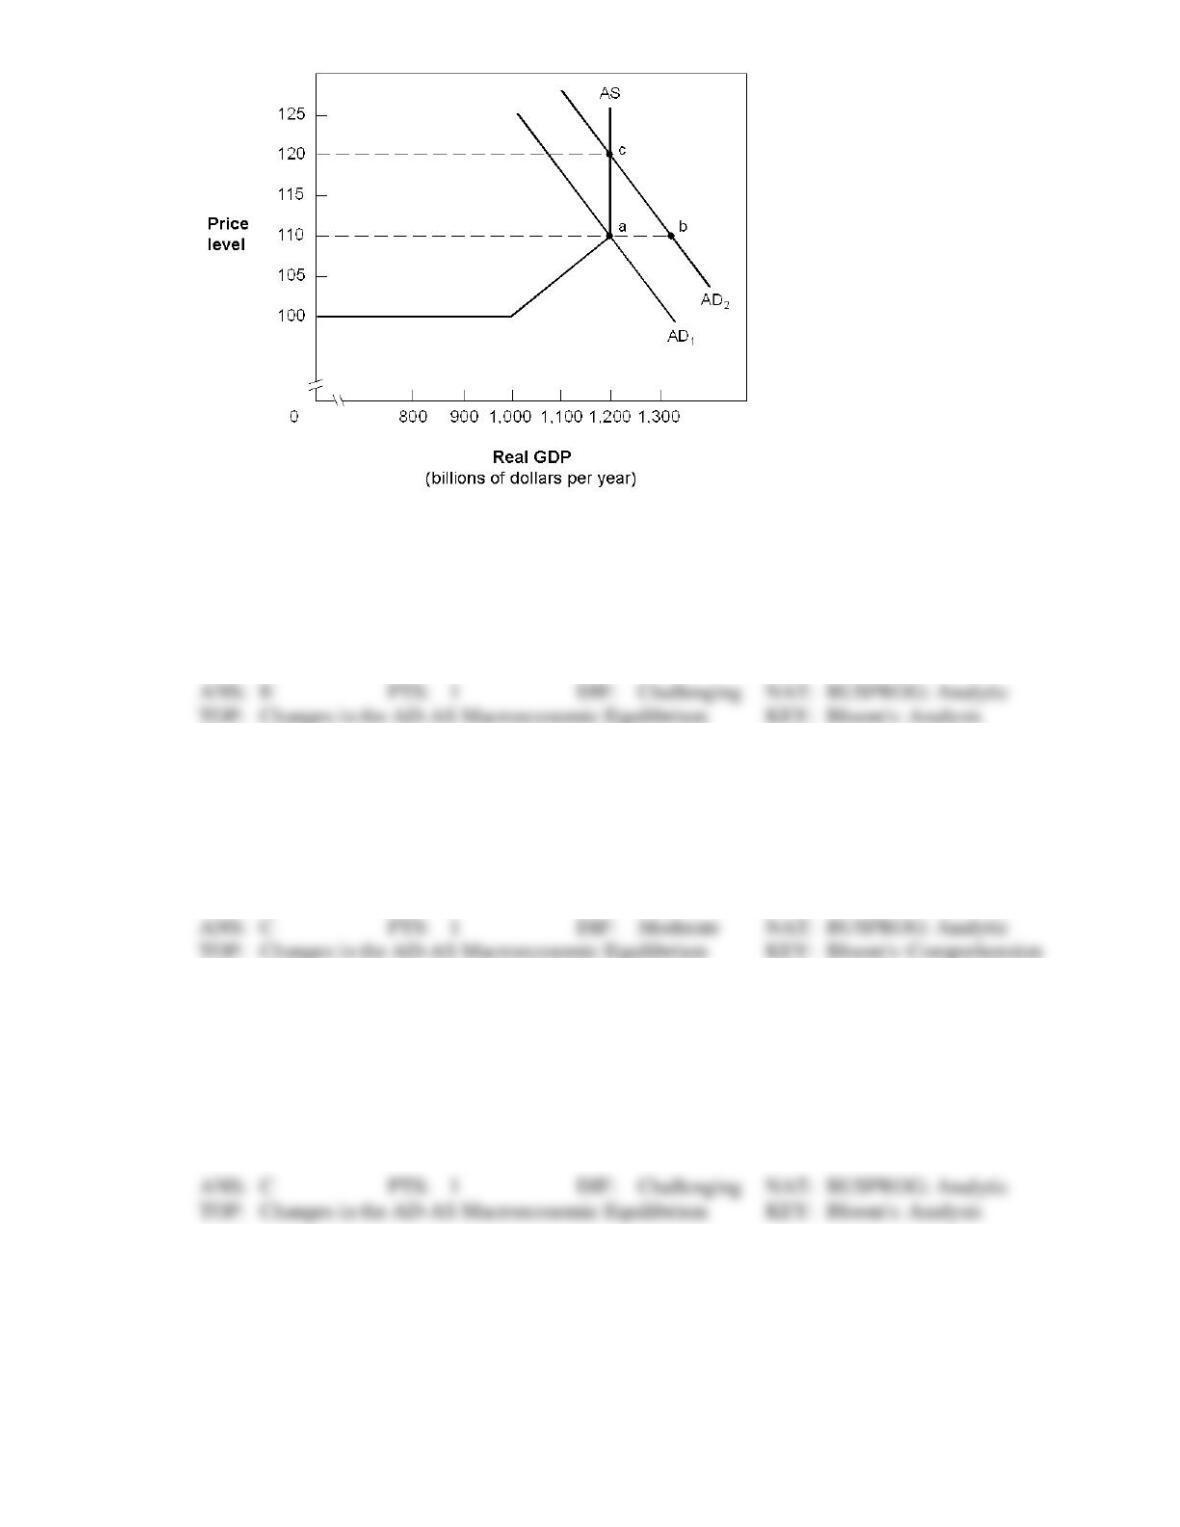
140. In Exhibit 10-7, if aggregate demand increases from AD1 to AD2,
a.
output and prices will increase.
b.
output and prices will decrease.
c.
output alone will increase.
d.
prices alone will decrease.
e.
prices alone will increase.
141. In Exhibit 10-7, the aggregate demand and supply curves reflect an economy in which:
a.
full employment is at $1,000 billion GDP.
b.
excess aggregate supply is created when there is a shift from AD1 to AD2.
c.
excess aggregate demand forces prices up to P = 120.
d.
excess aggregate demand causes prices to stabilize at P = 110.
e.
a new equilibrium is found at point b.
142. In Exhibit 10-7, choosing to operate the economy at GDP = $1200 billion and P = 110 would be opting
for an economy of:
a.
moderate unemployment with inflation.
b.
full employment without inflation.
c.
full employment with inflation.
d.
high unemployment and high inflation.
e.
moderate cyclical unemployment without inflation.
Exhibit 10-8 Aggregate demand and supply
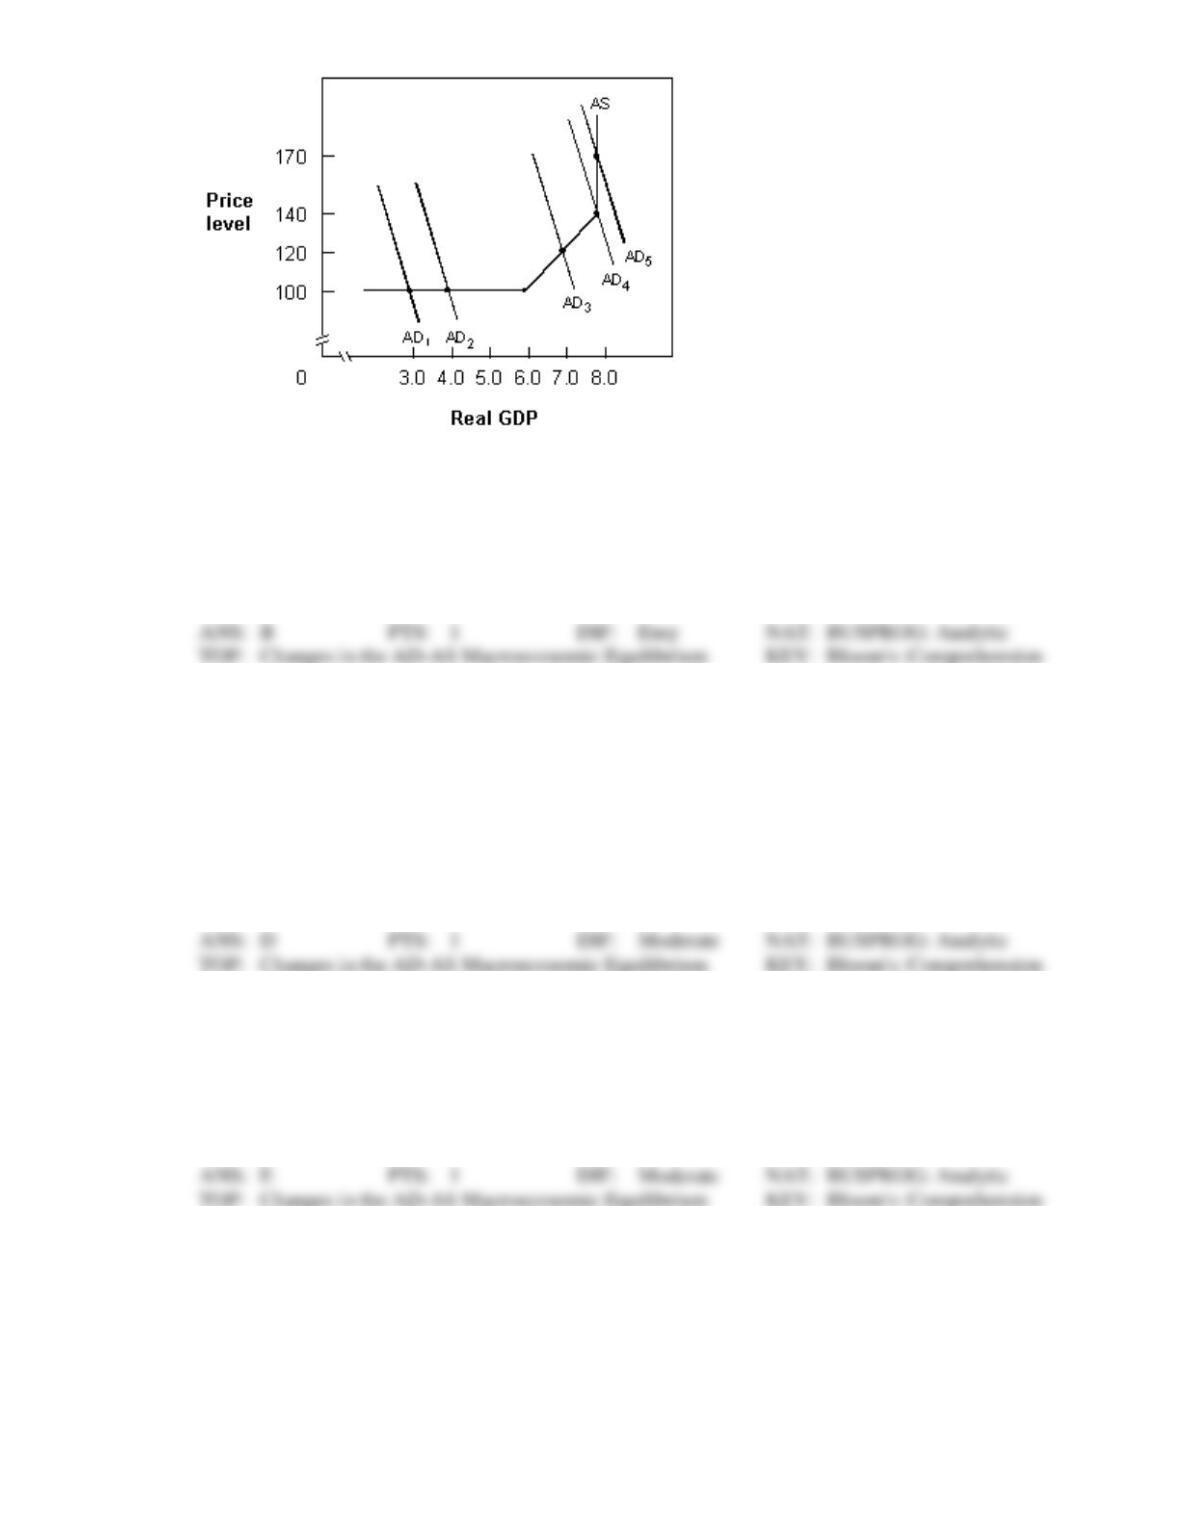
143. In Exhibit 10-8, if aggregate demand shifts from AD1 to AD2,
a.
real GDP will increase from $3.0 to $7.0, and the price level will remain the same.
b.
real GDP will increase from $3.0 to $4.0, and the price level will remain the same.
c.
real GDP and the price level will both remain the same.
d.
real GDP will increase from $3.0 to $4.0, and the price level will increase from 100 to
140.
144. In Exhibit 10-8, if aggregate demand shifts from AD1 to AD3,
a.
real GDP will increase from $3.0 to $4.0, and the price level will increase from 100 to
140.
b.
real GDP will increase from $3.0 to $7.0, and the price level will increase from 100 to
140.
c.
real GDP will increase from $3.0 to $4.0, and the price level does not change.
d.
real GDP will increase from $3.0 to $7.0, and the price level will increase from 100 to
120.
e.
real GDP will not change and the price level will increase from 100 to 140.
145. In Exhibit 10-8, if aggregate demand shifts from AD5 to AD4, real GDP will:
a.
not change, and the price level will fall from 170 to 100.
b.
not change, and the price level will fall from 140 to 100.
c.
fall from $8.0 to $6.0, and the price level will not change.
d.
fall from $8.0 to $6.0, and the price level will fall from 140 to 120.
e.
not change, and the price level will fall from 170 to 140.
146. In Exhibit 10-8, if aggregate demand shifts from AD3 to AD2, real GDP will:
a.
fall from $7.0 to $4.0, and the price level will not change.
b.
not change, and the price level will fall from 120 to 100.
c.
fall from $7.0 to $3.0, and the price level will fall from 120 to 100.
d.
fall from $8.0 to $4.0, and the price level will fall from 120 to 100.
e.
fall from $7.0 to $4.0, and the price level will fall from 120 to 100.
147. In Exhibit 10-8, if aggregate demand shifts from AD3 to AD4, real GDP will:
a.
rise from $7.0 to $8.0, and the price level will rise from 120 to 140.
b.
rise from $7.0 to $8.0, and the price level will rise from 120 to 170.
c.
rise from $7.0 to $8.0, and the price level will rise from 100 to 140.
d.
not change, and the price level will rise from 120 to 140.
e.
rise from $4.0 to $8.0, and the price level will rise from 120 to 140.
148. In Exhibit 10-8, if aggregate demand shifts from AD2 to AD1, real GDP will:
a.
fall from $4.0 to $3.0, and the price level will fall from 120 to 100.
b.
fall from $4.0 to $3.0, and the price level will not change.
c.
fall from $7.0 to $4.0, and the price level will not change.
d.
not change, and the price level will not change.
e.
fall from $4.0 to $3.0, and the price level will fall from 170 to 100.
149. In Exhibit 10-8, if aggregate demand shifts from AD4 to AD5, real GDP will:
a.
not change, and the price level will rise from 120 to 170.
b.
increase from $7.0 to $8.0, and the price level will rise from 120 to 170.
c.
not change, and the price level will rise from 140 to 170.
d.
increase from $4.0 to $7.0, and the price level will not change.
e.
not change, and the price level will rise from 100 to 170.
150. In Exhibit 10-8, when aggregate demand shifts from AD4 to AD5, the economy experiences:
a.
cost push-inflation.
b.
cost-pull inflation.
c.
demand-push inflation.
d.
demand-pull inflation.
e.
price-pull inflation.
TRUE/FALSE
1. The aggregate demand curve is downward sloping.
2. The aggregate demand curve slopes downward because of the real balances, interest-rate, and net
exports effects.
3. The real balances effect is caused by an inverse relationship between the price level and the real value
of financial assets with fixed nominal value.
4. The interest-rate effect is the impact on real GDP caused by the inverse relationship between the price
level and the interest rate.
5. The net exports effect is the direct relationship between net exports and the price level of an economy.
6. An increase in total spending in the economy will shift the aggregate demand curve to the left.
7. The quantity of real GDP rises with the price level, ceteris paribus.
8. The aggregate demand curve shifts due to changes in consumption expenditures, investment
expenditures government spending, and net exports.
9. The aggregate supply curve shows the relationship between the price level and the level of real GDP
produced by the nation’s economy.
10. The aggregate supply curve is vertical at the level of real GDP that corresponds to the natural rate of
unemployment.
11. The classical economists believed there was no role for government to play in restoring full
employment.
12. The classical approach to a downturn in the business cycle was for the government to do nothing.
13. The classical economists believe that prices and wages quickly adjust to keep the economy operating
at full employment.
14. The Keynesian view is that the aggregate supply curve is vertical.
15. The aggregate supply curve is horizontal in the intermediate range.
16. Along the Keynesian range of the aggregate supply curve, higher aggregate demand fails to stimulate
output and only causes inflation.
17. The Keynesian range of the aggregate supply curve applies when the economy is at or near full
employment.
18. If aggregate demand equals aggregate supply, macroeconomic equilibrium exists.
19. An increase in the per unit costs of production within an economy will cause the aggregate supply
curve to shift to the right.
20. An increase in input prices will cause the aggregate supply curve to shift rightward.
21. Stagflation means a simultaneous decrease in the unemployment and inflation rates.
22. Demand-pull inflation is caused by a rightward shift of the aggregate demand curve.
23. Excessive government spending can cause demand-pull inflation.
24. Cost-push inflation is caused by a leftward shift of the aggregate demand curve.
25. A leftward shift in the aggregate supply curve along a fixed aggregate demand curve will cause cost-
push inflation.
26. Cost-push inflation is caused by supply shocks like higher oil prices and poor weather conditions.
ESSAY
1. Why does the aggregate demand (AD) curve slope downward? What could cause the AD curve to shift
to the right? What impact would a rightward shift of the AD curve have on the economy?
2. Discuss the three ranges of the aggregate supply (AS) curve. What could cause the AS curve to shift to
the left? What impact would a leftward shift of the AS curve have on the economy?
3. How are demand-pull and cost-push inflation reflected in terms of the AD-AS model?