Externalities 2643
79.
Which of the following require firms to pay to pollute?
(i)
corrective taxes
(ii)
tradable pollution permits
(iii)
pollution regulations
a.
(i) only
b.
both (i) and (ii)
c.
(iii) only
d.
both (ii) and (iii)
80.
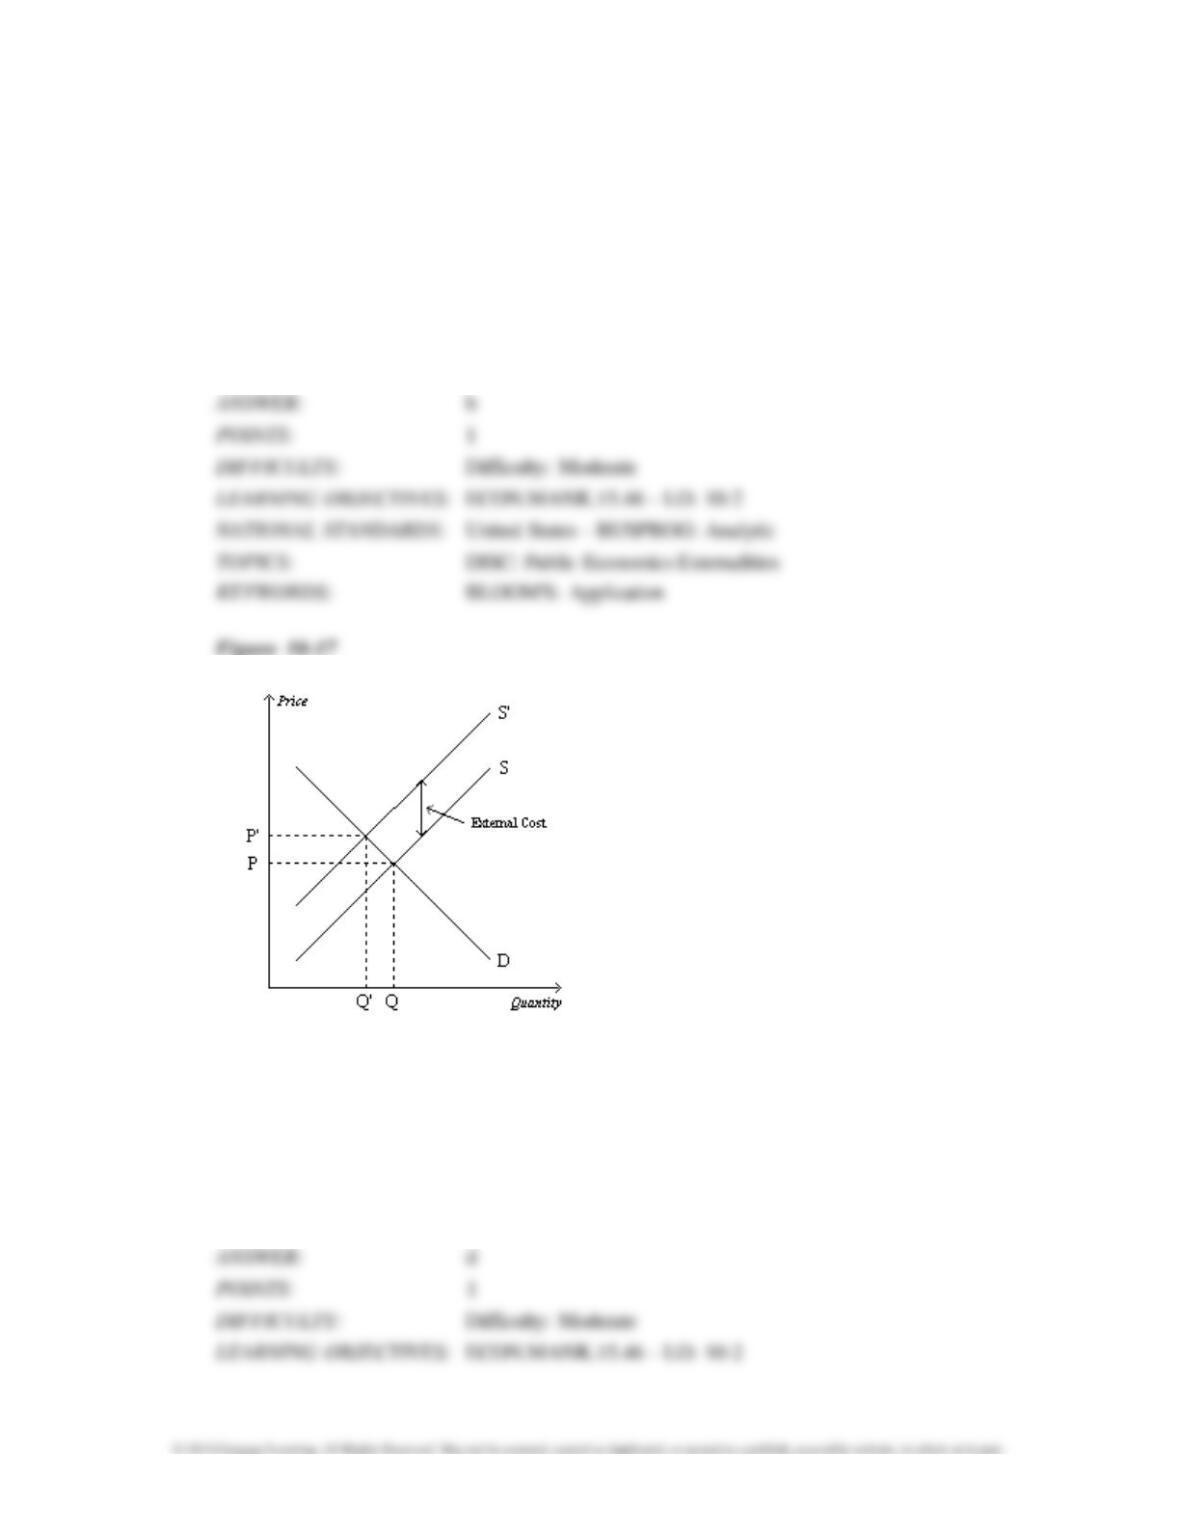
Refer to Figure 10–17. How large would a corrective tax need to be to move this market from
the equilibrium
outcome to the socially-optimal outcome?
a.
An amount equal to P’ minus P.
b.
An amount equal to P’.
c.
An amount equal to P.
d.
An amount equal to the external cost.
2644 Externalities
Table 10-5
The following table shows the marginal costs for each of four firms (A, B, C, and D) to eliminate
units of pollution
from their production processes. For example, for Firm A to eliminate one unit of
pollution, it would cost $54, and
for Firm A to eliminate a second unit of pollution it would cost an
additional $67.
81.
Refer to Table 10-5. If the government charged a fee of $69 per unit of pollution, how many
units of pollution
would the firms eliminate altogether?
a.
7
b.
8
c.
9
d.
10
Firm
Unit to be
A
B
C
D
First unit
54
57
54
62
Second unit
67
68
66
73
Third unit
82
86
82
91
Fourth unit
107
108
107
111
82.
Refer to Table 10-5. If the government charged a fee of $84 per unit of pollution, how many
units of pollution
would the firms eliminate altogether?
a.
7
b.
8
c.
9
d.
10
83.
Refer to Table 10-5. If the government wanted to reduce pollution from 16 units to 6 units,
which of the following
fees per unit of pollution would achieve that goal?
a.
$67
b.
$68
c.
$81
d.
$83
84.
Refer to Table 10–5. If the government wanted to eliminate exactly 11 units of pollution, which
of the following
fees per unit of pollution would achieve that goal?
a.
$75
b.
$87
c.
$90
d.
$106
85.
Refer to Table 10-5. Suppose the government wants to reduce pollution from 16 units to 8 units
and auctions off 8
pollution permits to achieve this goal. Which of the following is a likely auction
price of the permits?
a.
$69
b.
$81
c.
$83
d.
$97
Externalities 2647
Table 10-6
The following table shows the total costs for each of four firms (A, B, C, and D) to eliminate units
of pollution from
their production processes. For example, for Firm A to eliminate one unit of
pollution, it would cost $46, and for
Firm A to eliminate two units of pollution, it would cost a total
of $103.
Firm
Unit to be eliminated
A
B
C
D
One unit
46
45
42
49
Two units
103
100
98
108
Three units
180
173
169
188
Four units
282
263
258
285
86.
Refer to Table 10-6. If the government charged a fee of $85 per unit of pollution, how many
units of pollution
would the firms eliminate altogether?
a.
10
b.
12
c.
14
d.
16
87.
Refer to Table 10-6. If the government charged a fee of $93 per unit of pollution, how many
units of pollution
would the firms eliminate altogether?
a.
10
b.
12
c.
14
d.
16
88.
Refer to Table 10-6. Suppose the government wanted to reduce pollution from 16 units to
exactly 6 units. Which
one of the following fees per unit of pollution would achieve that goal?
a.
$65
b.
$70
c.
$75
d.
$95
89.
Refer to Table 10-6. Suppose there is presently no pollution fee, and the government wishes to
eliminate exactly 8
units of pollution. Which of the following fees per unit of pollution would
achieve that goal?
a.
$65
b.
$75
c.
$80
d.
$88
90.
Which of the following is not a negative externality associated with driving cars?
a.
congestion
b.
pollution
c.
repairs
d.
accidents
91.
In summarizing the research on the externalities associated with driving cars, a 2007 Journal of
Economic
Literature article concluded that the optimal corrective tax on gasoline in the United
States, in 2012 dollars, would
be about
a.
$0.40 per gallon.
b.
$0.90 per gallon.
c.
$2.10 per gallon.
d.
$2.70 per gallon.
92.
Which of the following policies is not an example of a command-and-control policy?
a.
subsidies
b.
Pigovian taxes
c.
tradable pollution permits
d.
None of the above is an example of a command-and-control policy.
93.
Taxes that are enacted to mitigate the effects of negative externalities are sometimes called
a.
control taxes.
b.
command levies.
c.
Pigovian taxes.
d.
Marshallian taxes.
94.
Which of the following statements is true of both pollution permits and corrective taxes?
a.
Both policies internalize the externality of pollution.
b.
Both policies require firms to pay for their pollution.
c.
Both policies lead to the establishment of an equilibrium price of pollution.
d.
All of the above are correct.
2652 Externalities
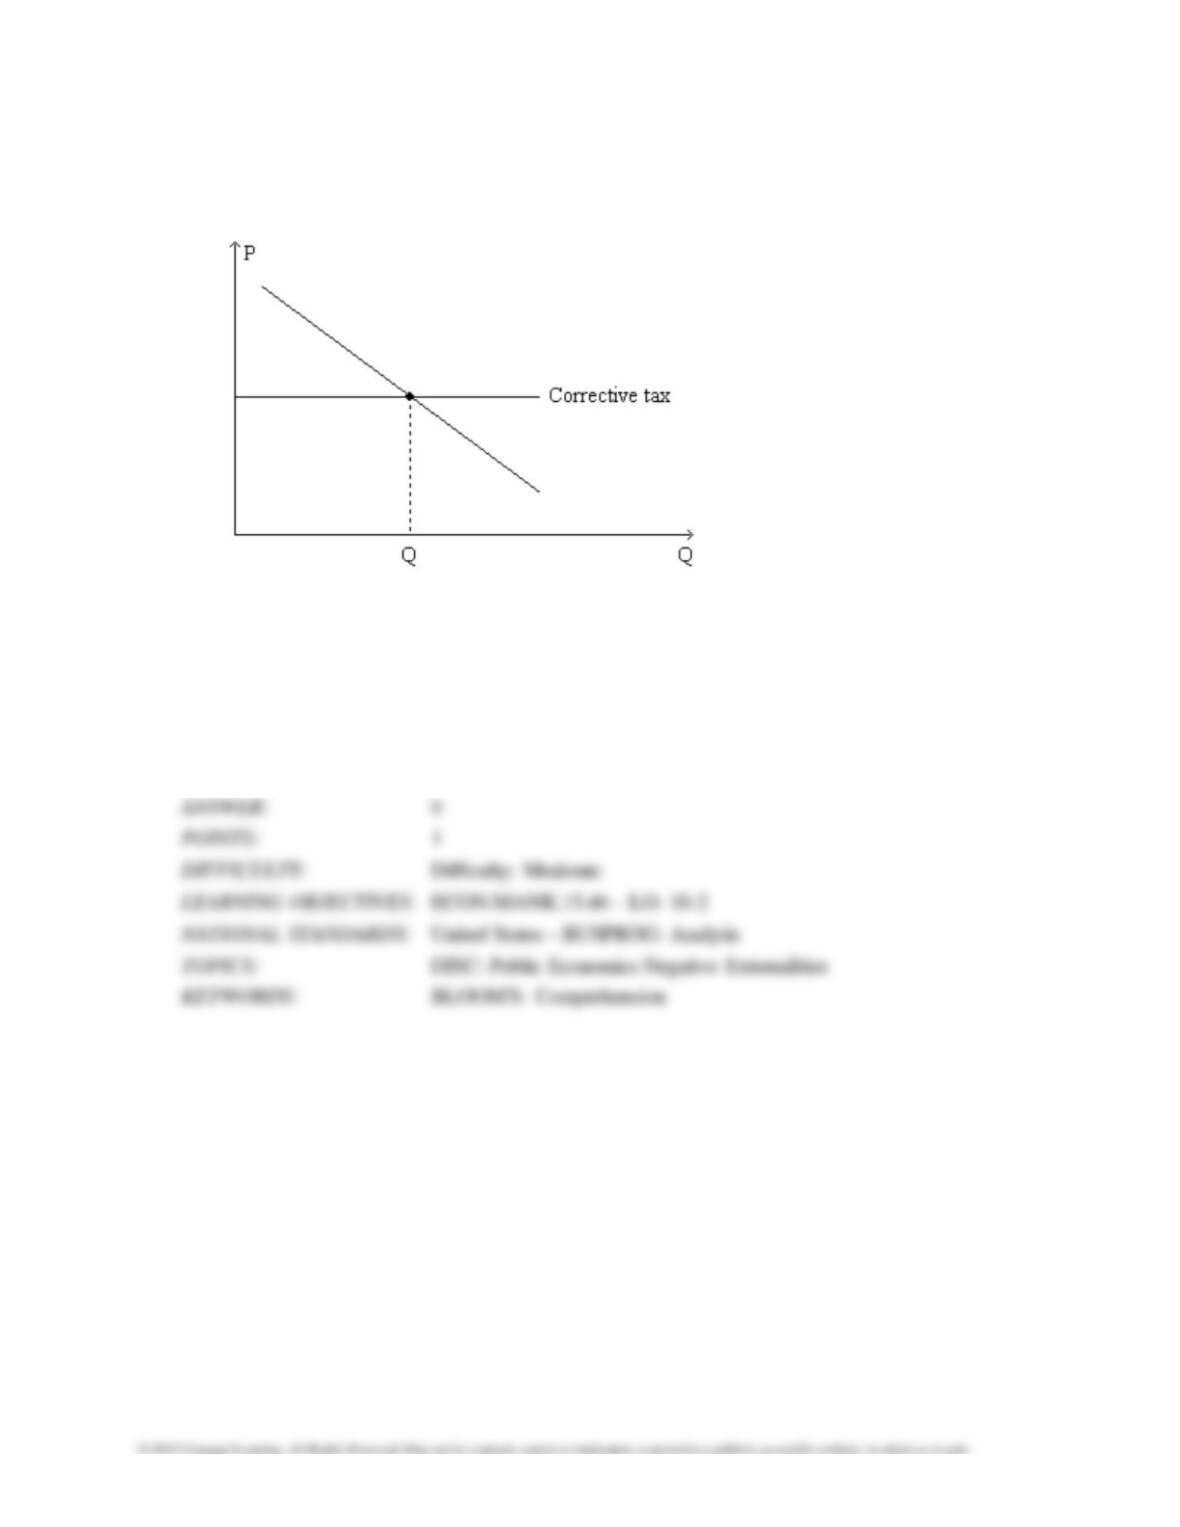
Figure 10–18. The graph represents a corrective tax to reduce pollution. On the axes, Q denotes
the quantity of
pollution and P represents the price of pollution.
95.
Refer to Figure 10–18. What is the appropriate label for the downward-sloping line on the
graph?
a.
“Demand for clean air”
b.
“Demand for pollution rights”
c.
“Supply of pollution permits”
d.
“Tax paid to government”
96.
Refer to Figure 10–18. The line labeled “Corrective tax” could accurately be re-labeled as
a.
“Demand for clean air.”
b.
“Demand for pollution rights.”
c.
“Price of pollution.”
d.
“Rate of subsidy.”
97.
Refer to Figure 10–18. The tax depicted on the graph
a.
gives polluting firms an incentive to develop cleaner technologies.
b.
is viewed by most economists as less effective than a command-and-control policy as a means
of reducing
pollution.
c.
has the effect of moving the allocation of resources further from the social optimum than it
would be in the
absence of the tax.
d.
All of the above are correct.
98.
The business activities of Firm A confer positive externalities on Firm B, and the business
activities of Firm B
confer positive externalities on Firm A. If the two firms merged, then
a.
their respective markets would move closer to the social optimum.
b.
their respective markets would move further away from the social optimum.
c.
total surplus in their respective markets would decrease.
d.
the merger would serve as an example of a misguided public policy toward externalities.
99.
The tax on gasoline
a.
reduces efficiency by causing large deadweight losses.
b.
reduces efficiency by decreasing consumer surplus and producer surplus.
c.
enhances efficiency by serving as a corrective device in a market with positive externalities.
d.
enhances efficiency by serving as a corrective device in a market with negative externalities.
100.
Which of the following policies is an example of a command-and-control policy?
a.
subsidies to education
b.
maximum levels of pollution that factories may emit
c.
tradable pollution permits
d.
None of the above is an example of a command-and-control policy.
101.
Which of the following statements is correct about a market in which pollution is emitted?
a.
Both corrective taxes and pollution permits internalize the externality of pollution.
b.
Corrective taxes internalize the externality of pollution, but pollution permits do not internalize
that externality.
c.
Corrective taxes fail to internalize the externality of pollution, but corrective taxes internalize
that externality.
d.
Neither corrective taxes nor pollution permits internalize the externality of pollution.
102.
Which of the following statements is correct about a market in which pollution is emitted?
a.
Both corrective taxes and pollution permits move the market toward the social optimum.
b.
Corrective taxes move the market toward the social optimum, but pollution permits do not
move the market
toward the social optimum.
c.
Pollution permits move the market toward the social optimum, but corrective taxes do not
move the market
toward the social optimum.
d.
Neither corrective taxes nor pollution permits move the market toward the social optimum.
Externalities 2657
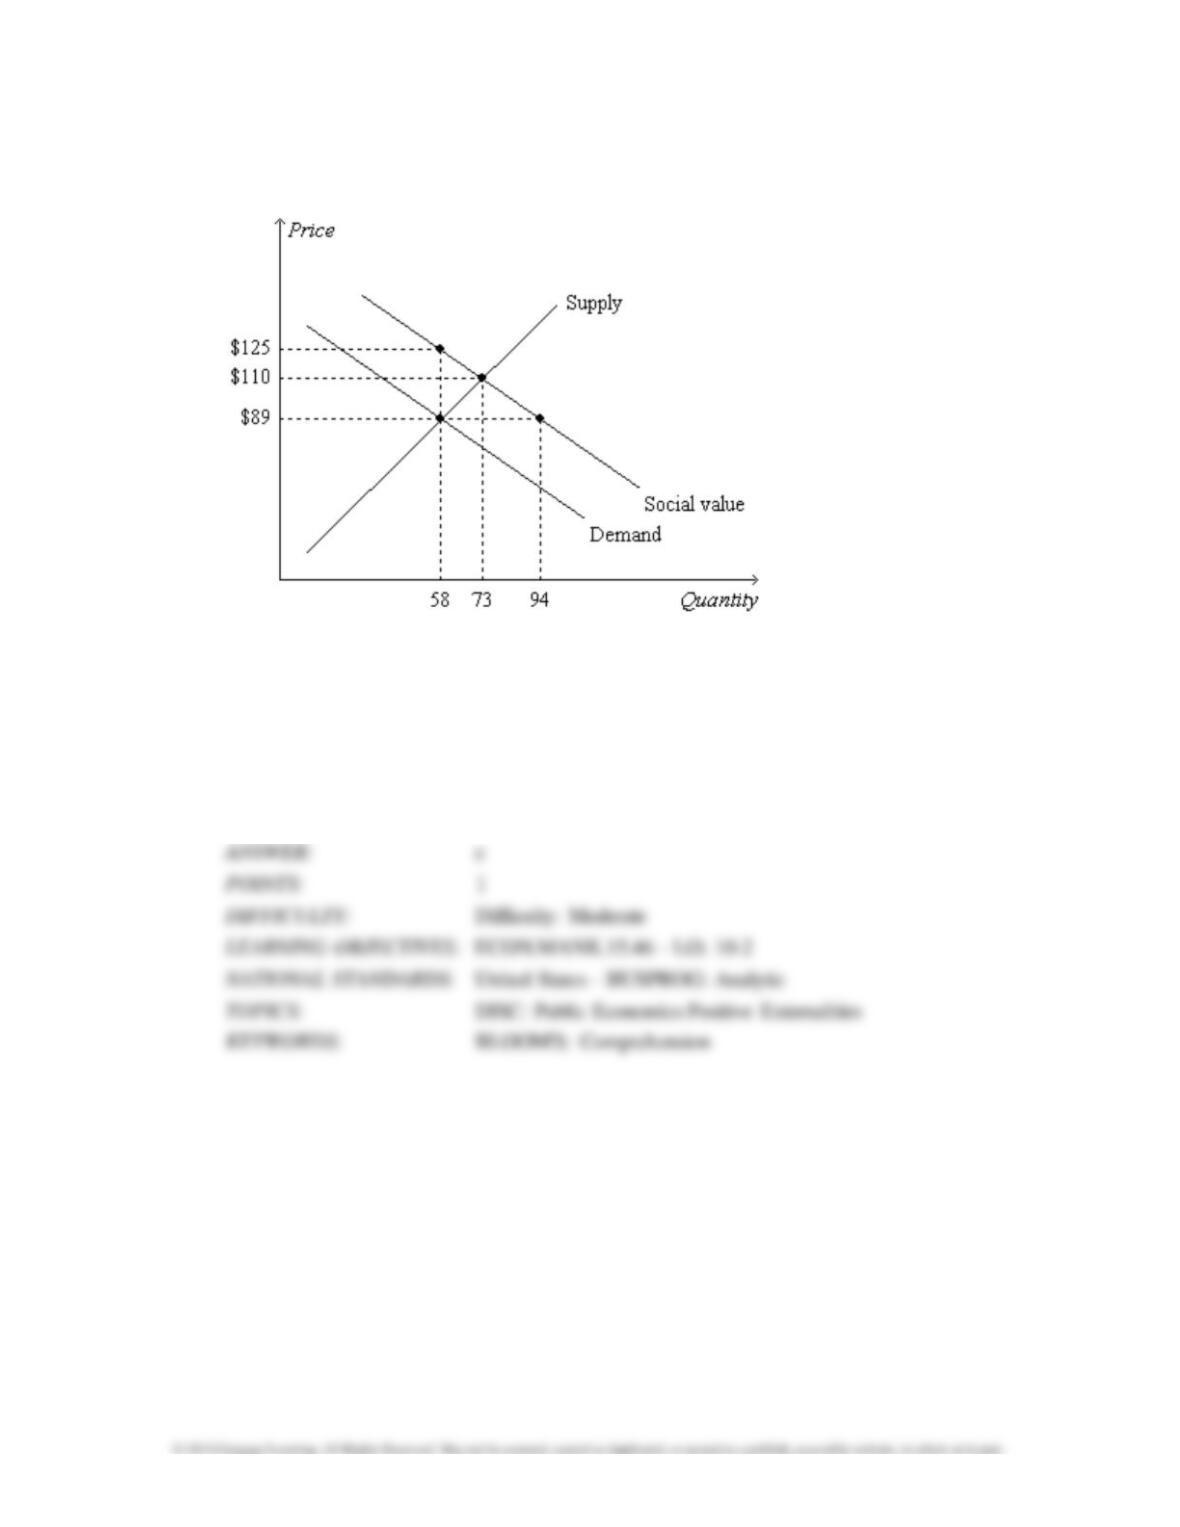
Figure 10–19
103.
Refer to Figure 10-19. Which of the following quantities decreases as the quantity of the good
is increased?
a.
the private cost of the good
b.
the social cost of the good
c.
the private value of the good
d.
the external benefit of the good
104.
Refer to Figure 10-19. Each additional unit of the good that is produced yields an external
a.
benefit of $15.
b.
benefit of $36.
c.
cost of $15.
d.
cost of $36.
105.
Refer to Figure 10-19. Each additional unit of the good that is produced yields an external
benefit of
a. $15.
b.
$23.
c.
$36.
d.
$89.
106.
Refer to Figure 10-19. Note that the lines labeled “Demand” and “Social Value”are parallel.
Also, the slopes of
the lines on the graph reflect the following facts: (1) Private value and social
value decrease by $1.00 with each
additional unit of the good that is consumed, and (2) private
cost increases by $1.40 with each additional unit of the
good that is produced. Thus, when the
59th unit of the good is produced and consumed, social well-being increases
by
a. $28.00.
b. $31.40.
c. $33.60.
d. $36.00.
107.
Refer to Figure 10-19. Note that the lines labeled “Demand” and “Social Value”are parallel.
Also, the slopes of
the lines on the graph reflect the following facts: (1) Private value and social
value decrease by $1.00 with each
additional unit of the good that is consumed, and (2) private
cost increases by $1.40 with each additional unit of the
good that is produced. Thus, when the
74th unit of the good is produced and consumed, social well-being
a.
decreases by $2.40.
b.
decreases by $1.60.
c.
increases by $1.00.
d.
increases by $1.40.
108.
Refer to Figure 10-19. The socially optimal quantity of output is
a.
58 units.
b.
73 units.
c.
between 73 and 94 units.
d.
94 units.
109.
Refer to Figure 10-19. How many units of the good are produced in a market equilibrium?
a.
fewer than 58
b.
58
c.
73
d.
94
110.
Refer to Figure 10-19. The social optimum can be reached if
a.
a subsidy of $36 is applied to each unit of the good.
b.
a subsidy of $23 is applied to each unit of the good.
c.
a tax of $23 is applied to each unit of the good.
d.
a tax of $15 is applied to each unit of the good.
111.
The gasoline tax
a.
is similar to most other taxes in that it causes deadweight losses.
b.
produces the unfortunate side-effect of making the roads more dangerous.
c.
can be viewed as a corrective tax aimed at multiple negative externalities associated with
driving.
d.
can be viewed as a command-and-control policy aimed at discouraging people from driving.
112.
To economists, good environmental policy begins by acknowledging one of the Ten Principles of
Economics:
a.
Trade can make everyone better off.
b.
People face trade-offs.
c.
Markets are usually a good way to organize economic activity.
d.
A country’s standard of living depends on its ability to produce goods and services.
113.
If an objective of public policy is to allocate pollution to those factories that face the highest cost
of reducing it, then
that objective could be achieved by
a.
a corrective tax, but not by regulation.
b.
regulation, but not by a corrective tax.
c.
either regulation or a corrective tax.
d.
neither regulation nor a corrective tax.
114.
In terms of their economic effects, which of the following policies toward pollution are most
similar to one another?
a.
regulation and corrective taxes
b.
regulation and tradable pollution permits
c.
corrective taxes and tradable pollution permits
d.
All of these policies produce the same economic effects.