Use the table for the question(s) below.
Consider the following Price and Dividend data for Ford Motor Company:
Date Price ($) Dividend ($)
December 31, 2004 $14.64
January 26, 2005 $13.35 $0.10
April 28, 2005 $9.14 $0.10
July 29, 2005 $10.74 $0.10
October 28, 2005 $8.02 $0.10
December 30, 2005 $7.72
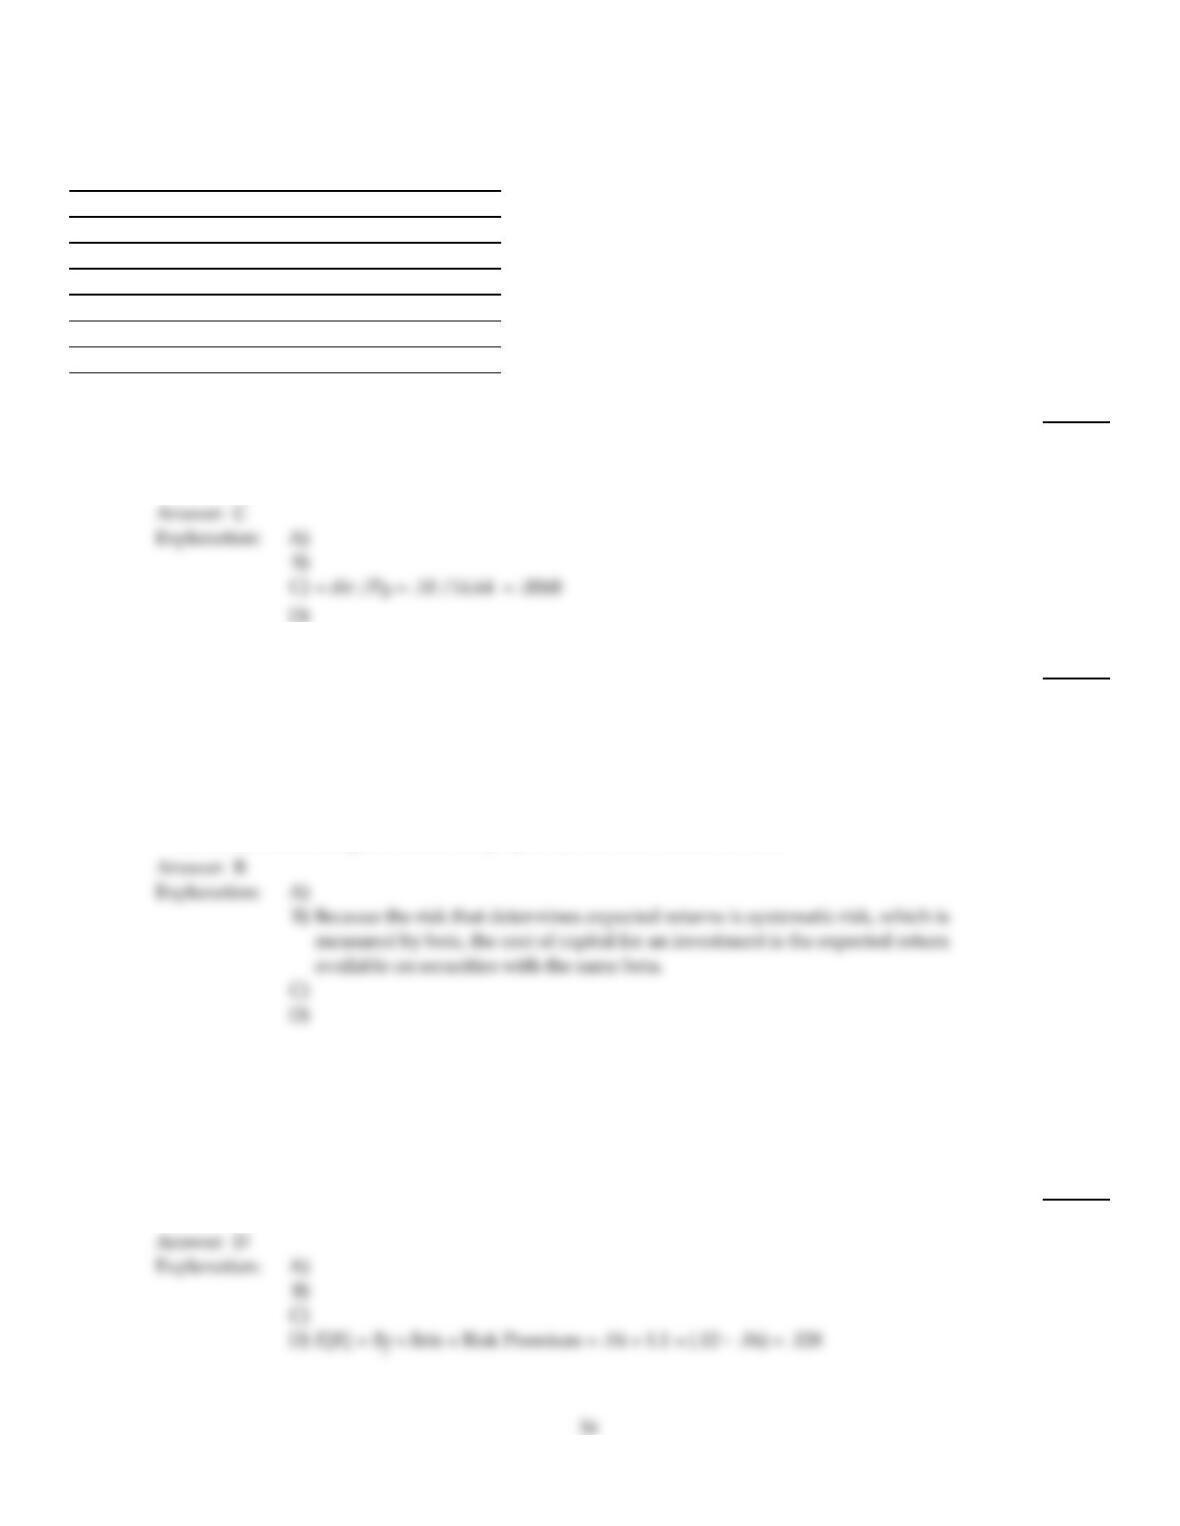
67)
Assume that you purchased Ford Motor Company stock at the closing price on December 31, 2004
and sold it after the dividend had been paid at the closing price on January 26, 2005. Your dividend
yield for this period is closest to:
67)
A)
–8.80%
B)
0.75%
C)
0.70%
D)
–8.15%
68)
Which of the following statements is false?
68)
A)
The Capital Asset Pricing Model is the most important method for estimating the cost of
capital that is used in practice.
B)
Because the risk that determines expected returns is unsystematic risk, which is measured by
beta, the cost of capital for an investment is the expected return available on securities with
the same beta.
C)
To determine a project’s cost of capital we need to estimate its beta.
D)
A common assumption is that the project has the same risk as the firm.
Use the information for the question(s) below.
Suppose that in the coming year, you expect Exxon–Mobil stick to have a volatility of 42% and a beta of 0.9, and Merck‘s
stock to have a volatility of 24% and a beta of 1.1. The risk free interest rate is 4% and the markets expected return is 12%.
69)
The cost of capital for a project with the same beta as Merck’s stock is closest to:
69)
A)
11.2%
B)
12.4%
C)
11.6%
D)
12.8%
Use the information for the question(s) below.
Big Cure and Little Cure are both pharmaceutical companies. Big Cure presently has a potential “blockbuster” drug before
the Food and Drug Administration (FDA) waiting for approval. If approved, Big Cure’s blockbuster drug will produce $1
billion in net income for Big Cure. Little Cure has 10 separate less important drugs before the FDA waiting for approval. If
approved, each of Little Cure’s drugs would produce $100 million in net income for Little Cure. The probability of the FDA
approving a drug is 50%.
70)
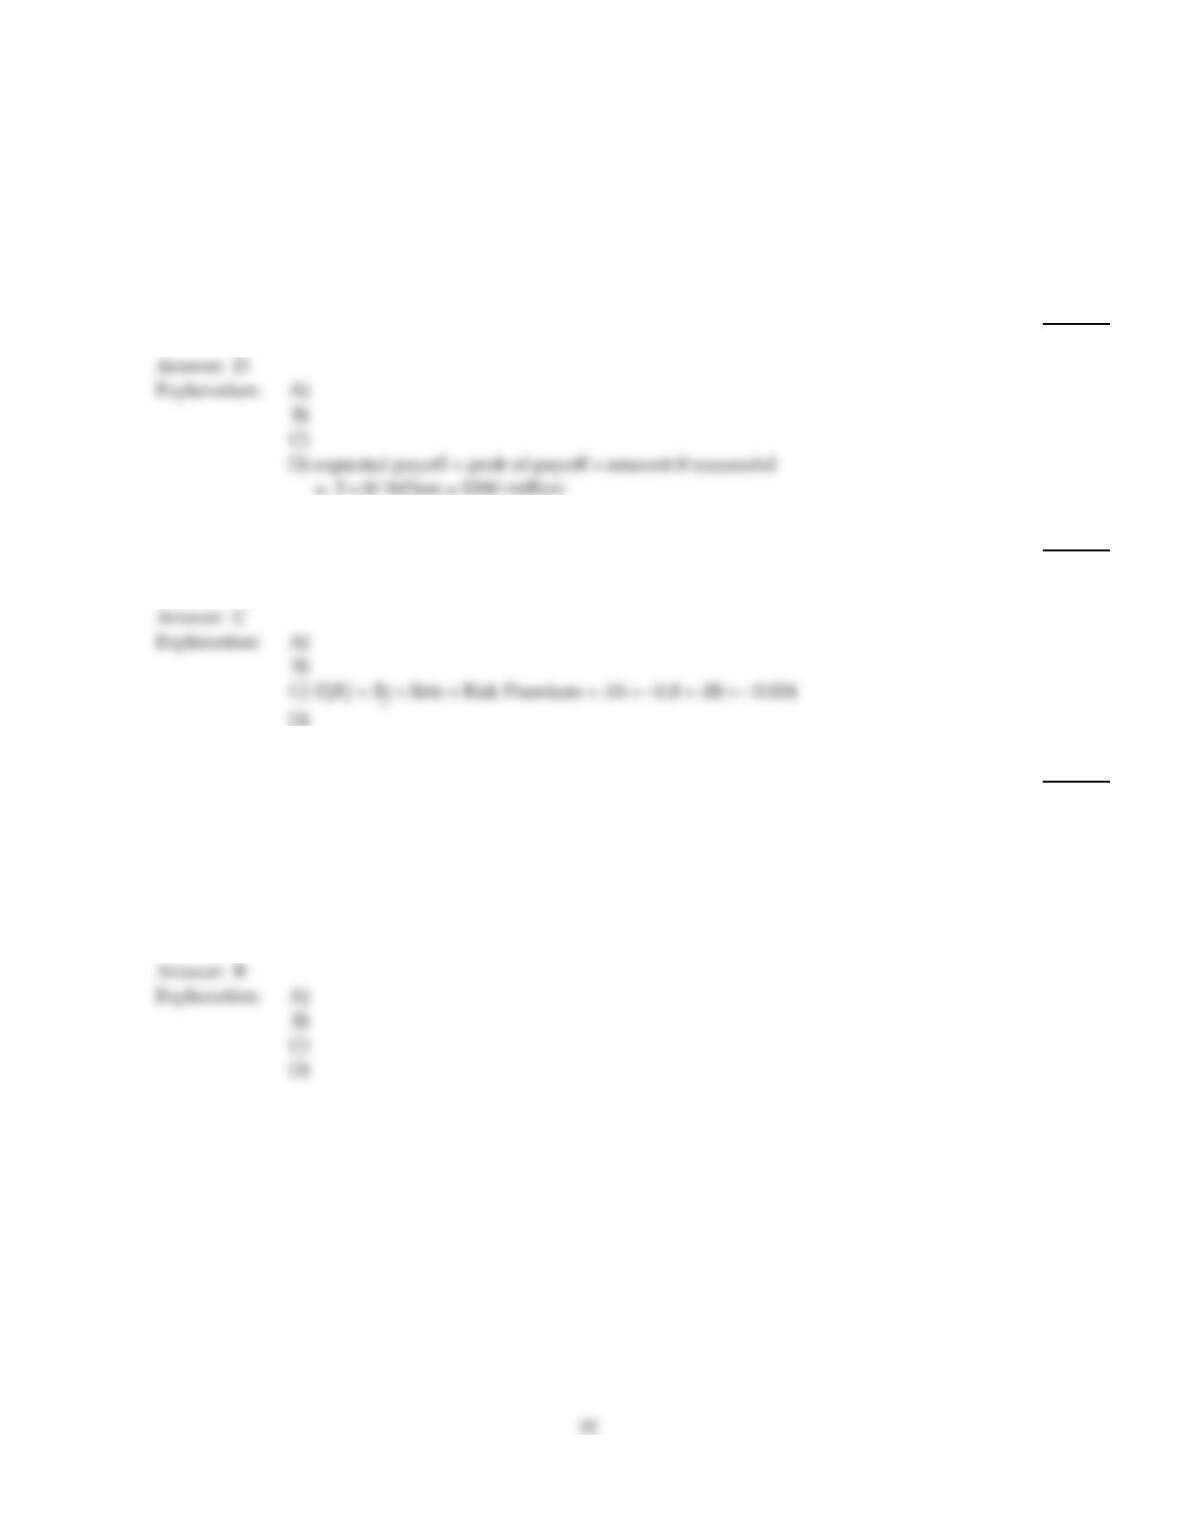
What is the expected payoff for Big Cure’s Blockbuster drug?
70)
A)
$1 billion
B)
$100 million
C)
$0
D)
$500 million
71)
Suppose that Gold Digger’s Beta is –0.8. If the market risk premium is 8% and the risk–free interest
rate is 4%, then then expected return for Gold Digger’s stock is?
71)
A)
10.4%
B)
2.4%
C)
–2.4%
D)
4.8%
72)
Which of the following is consistent with the CAPM and efficient capital markets?
72)
A)
A security with only diversifiable risk has an expected return that exceeds the risk–free
interest rate.
B)
A security with only systematic risk has an expected return that exceeds the risk–free interest
rate.
C)
Small stocks with a beta of 1.5 tend to have higher returns on average than large stocks with a
beta of 1.5.
D)
A security with a beta of 1 has a return last year of 8% when the market has a return of 12%.
73)
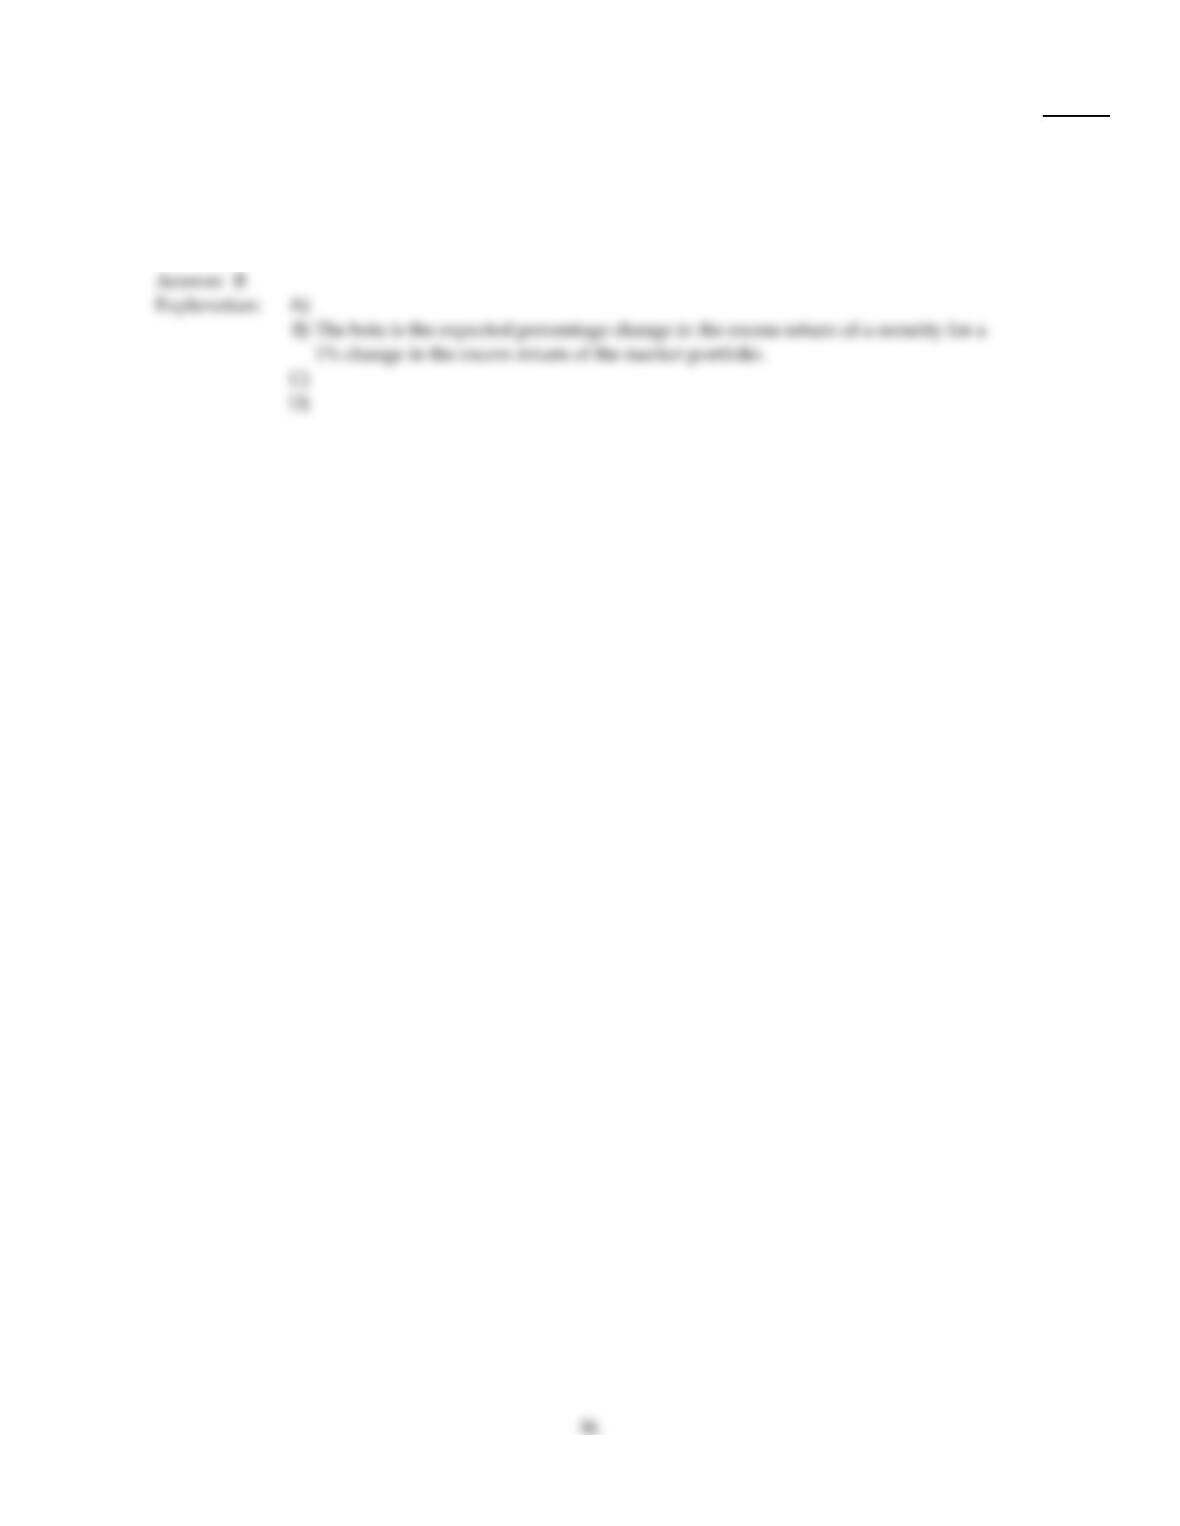
Which of the following statements is false?
73)
A)
Volatility measures total risk, while beta measures only systematic risk.
B)
The beta is the expected percentage change in the excess return of the market portfolio for a
1% change in the excess return of a security.
C)
Beta measures the sensitivity of a security to market wide risk factors.
D)
Utilities tend to be stable and highly regulated, and thus are insensitive to fluctuations in the
overall market.
Use the table for the question(s) below.
Consider the following realized annual returns:
Year End
S&P 500
Realized
Return
IBM
Realized
Return
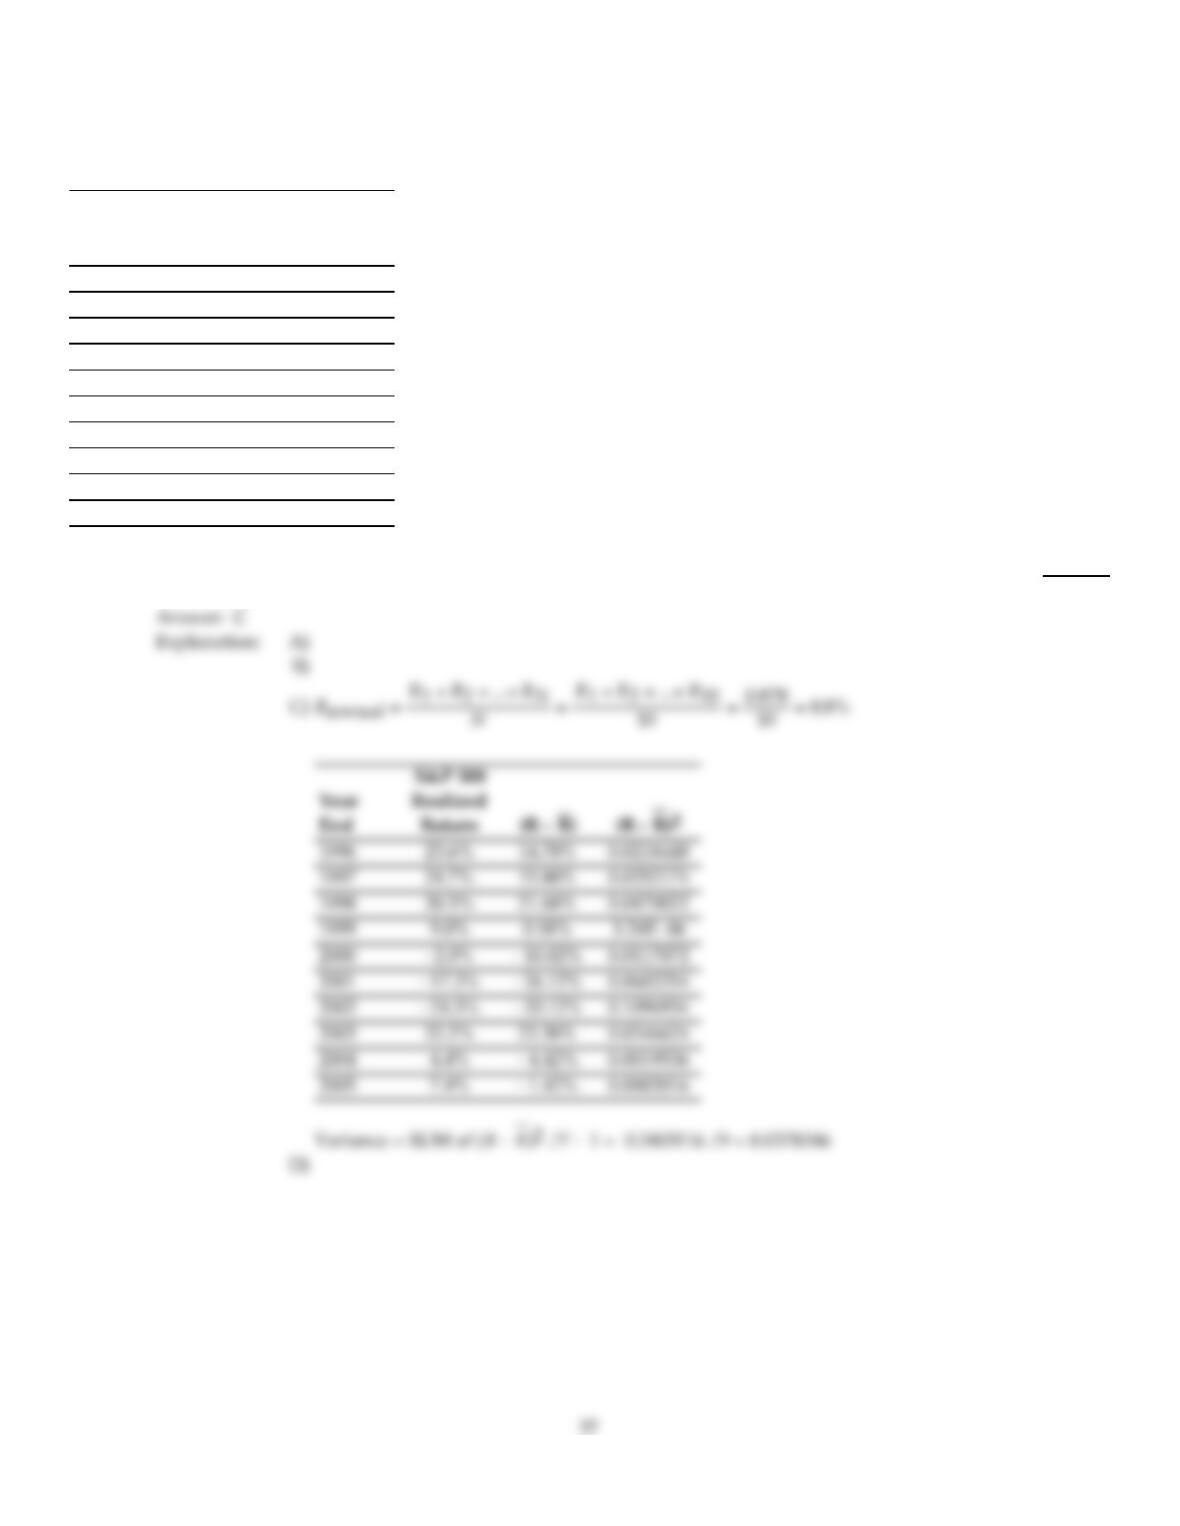
1996 23.6% 46.3%
1997 24.7% 26.7%
1998 30.5% 86.9%
1999 9.0% 23.1%
2000 –2.0% 0.2%
2001 –17.3% –3.2%
2002 –24.3% –27.0%
2003 32.2% 27.9%
2004 4.4% –5.1%
2005 7.4% –11.3%
74)
The variance of the returns on the S&P 500 from 1996 to 2005 is closest to:
74)
A)
.1935
B)
.0450
C)
.0375
D)
.3400
ESSAY. Write your answer in the space provided or on a separate sheet of paper.
Use the table for the question(s) below.
Consider the following realized annual returns:
Year End
Market
Realized
Return
Microsoft
Realized
Return
1996 21.2% 88.3%
1997 30.3% 56.4%
1998 22.3% 114.6%
1999 25.3% 68.4%
2000 –11.0% –62.8%
2001 –11.3% 52.7%
2002 –20.8% –22.0%
2003 33.1% 6.9%
2004 13.0% 9.2%
2005 7.3% –0.9%
75)
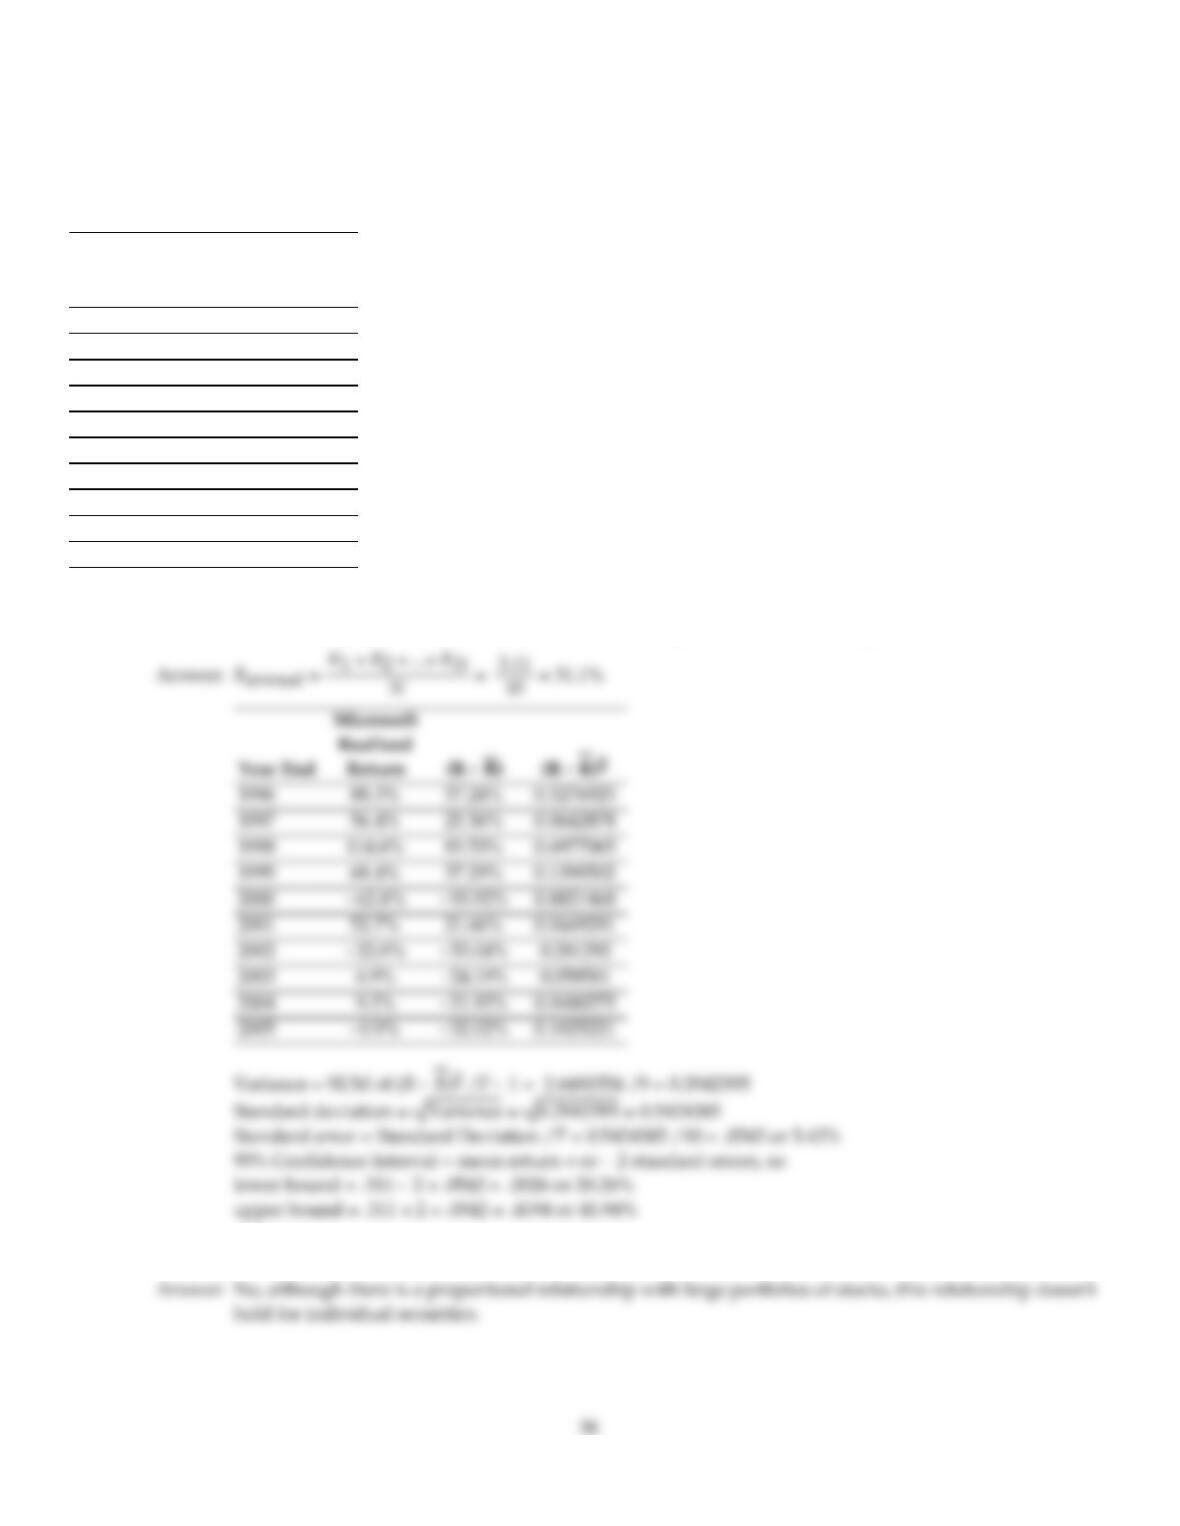
Suppose that you want to use the 10 year historical average return on Microsoft to forecast the expected future
return on Microsoft. Calculate the 95% confidence interval for your estimate of the expect return.
76)
Do expected returns for individual stocks increase proportionately with volatility?
Use the table for the question(s) below.
Consider the following Price and Dividend data for General Motors:
Date Price ($) Dividend ($)
December 31, 2004 $40.06
February 9, 2005 $36.80 $0.50
May 7, 2005 $30.41 $0.50
August 10, 2005 $34.86 $0.50
November 8, 2005 $25.86 $0.50
December 30, 2005 $18.86
77)
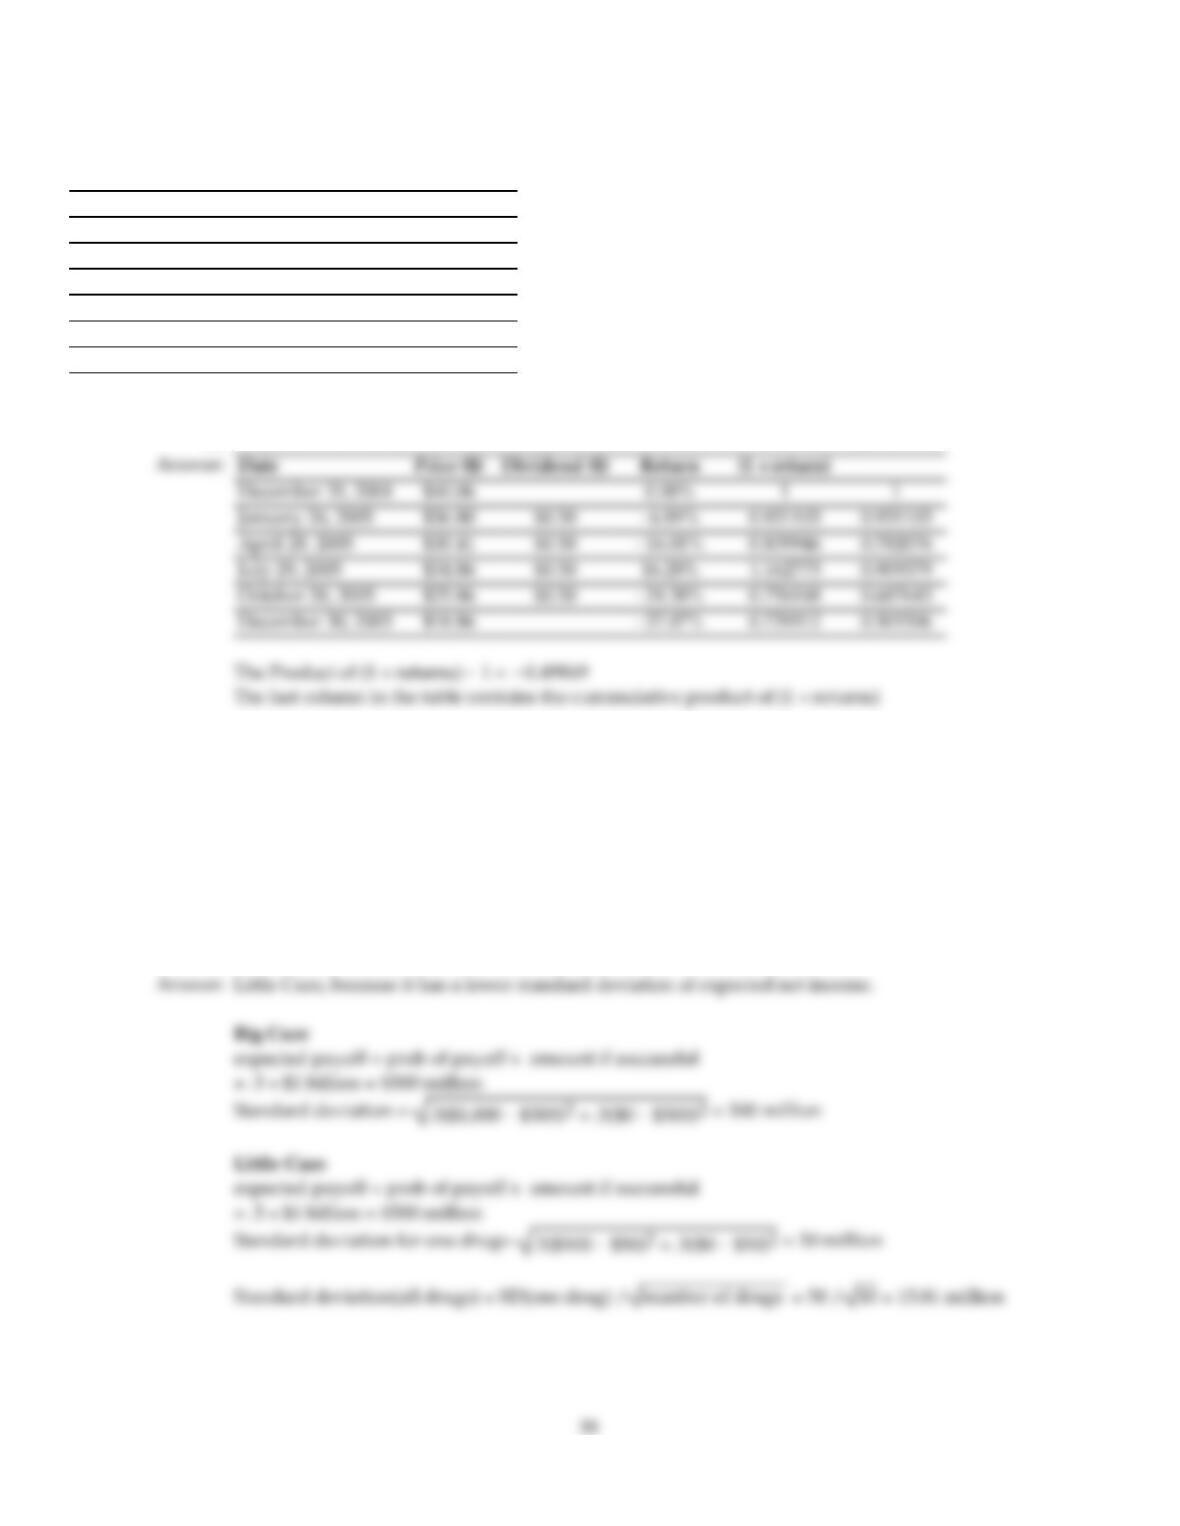
Assume that you purchased General Motors stock at the closing price on December 31, 2004 and sold it at the
closing price on December 30, 2005. Calculate your realized annual return is for the year 2005.
Use the information for the question(s) below.
Big Cure and Little Cure are both pharmaceutical companies. Big Cure presently has a potential “blockbuster” drug before
the Food and Drug Administration (FDA) waiting for approval. If approved, Big Cure’s blockbuster drug will produce $1
billion in net income for Big Cure. Little Cure has 10 separate less important drugs before the FDA waiting for approval. If
approved, each of Little Cure’s drugs would produce $100 million in net income for Little Cure. The probability of the FDA
approving a drug is 50%.
78)
Which pharmaceutical company faces less risk?
Use the table for the question(s) below.
Consider the following realized annual returns:
Year End
Market
Realized
Return
Microsoft
Realized
Return
1996 21.2% 88.3%
1997 30.3% 56.4%
1998 22.3% 114.6%
1999 25.3% 68.4%
2000 –11.0% –62.8%
2001 –11.3% 52.7%
2002 –20.8% –22.0%
2003 33.1% 6.9%
2004 13.0% 9.2%
2005 7.3% –0.9%
79)
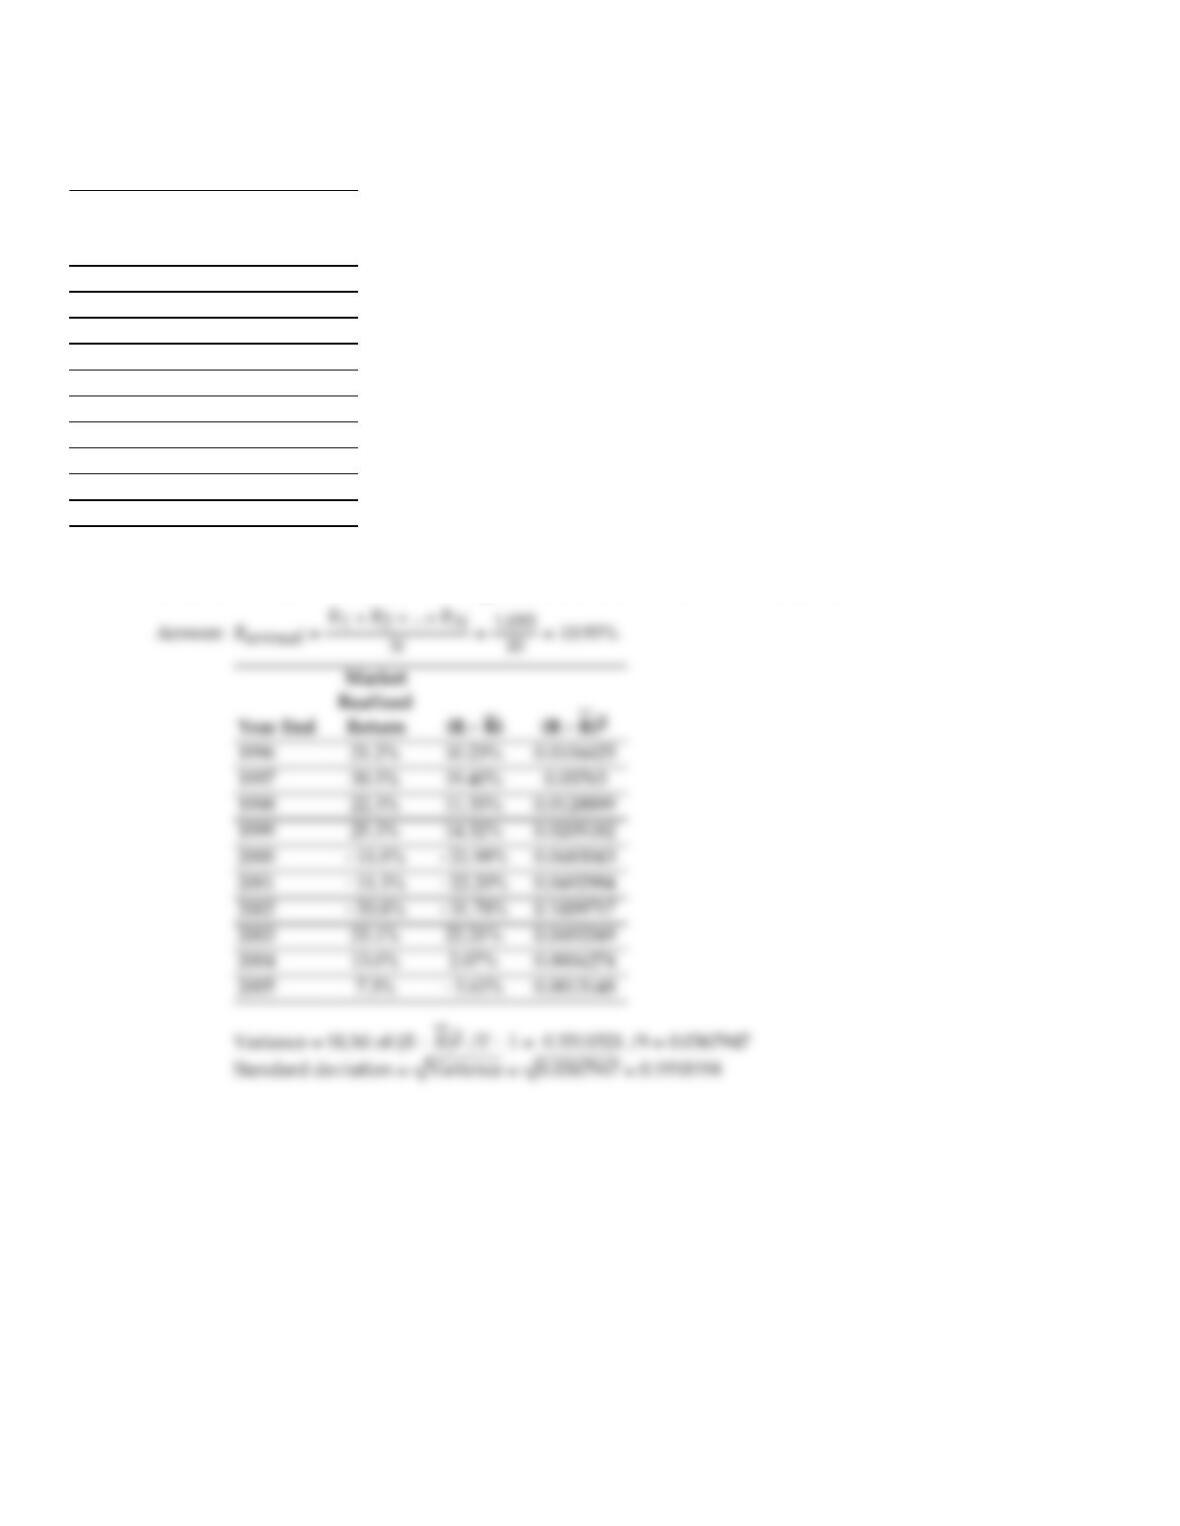
Using the data provided in the table, calculate the average annual return, the variance of the annual returns,
and the standard deviation of the average returns for the market from 1996 to 2005.
40
80)
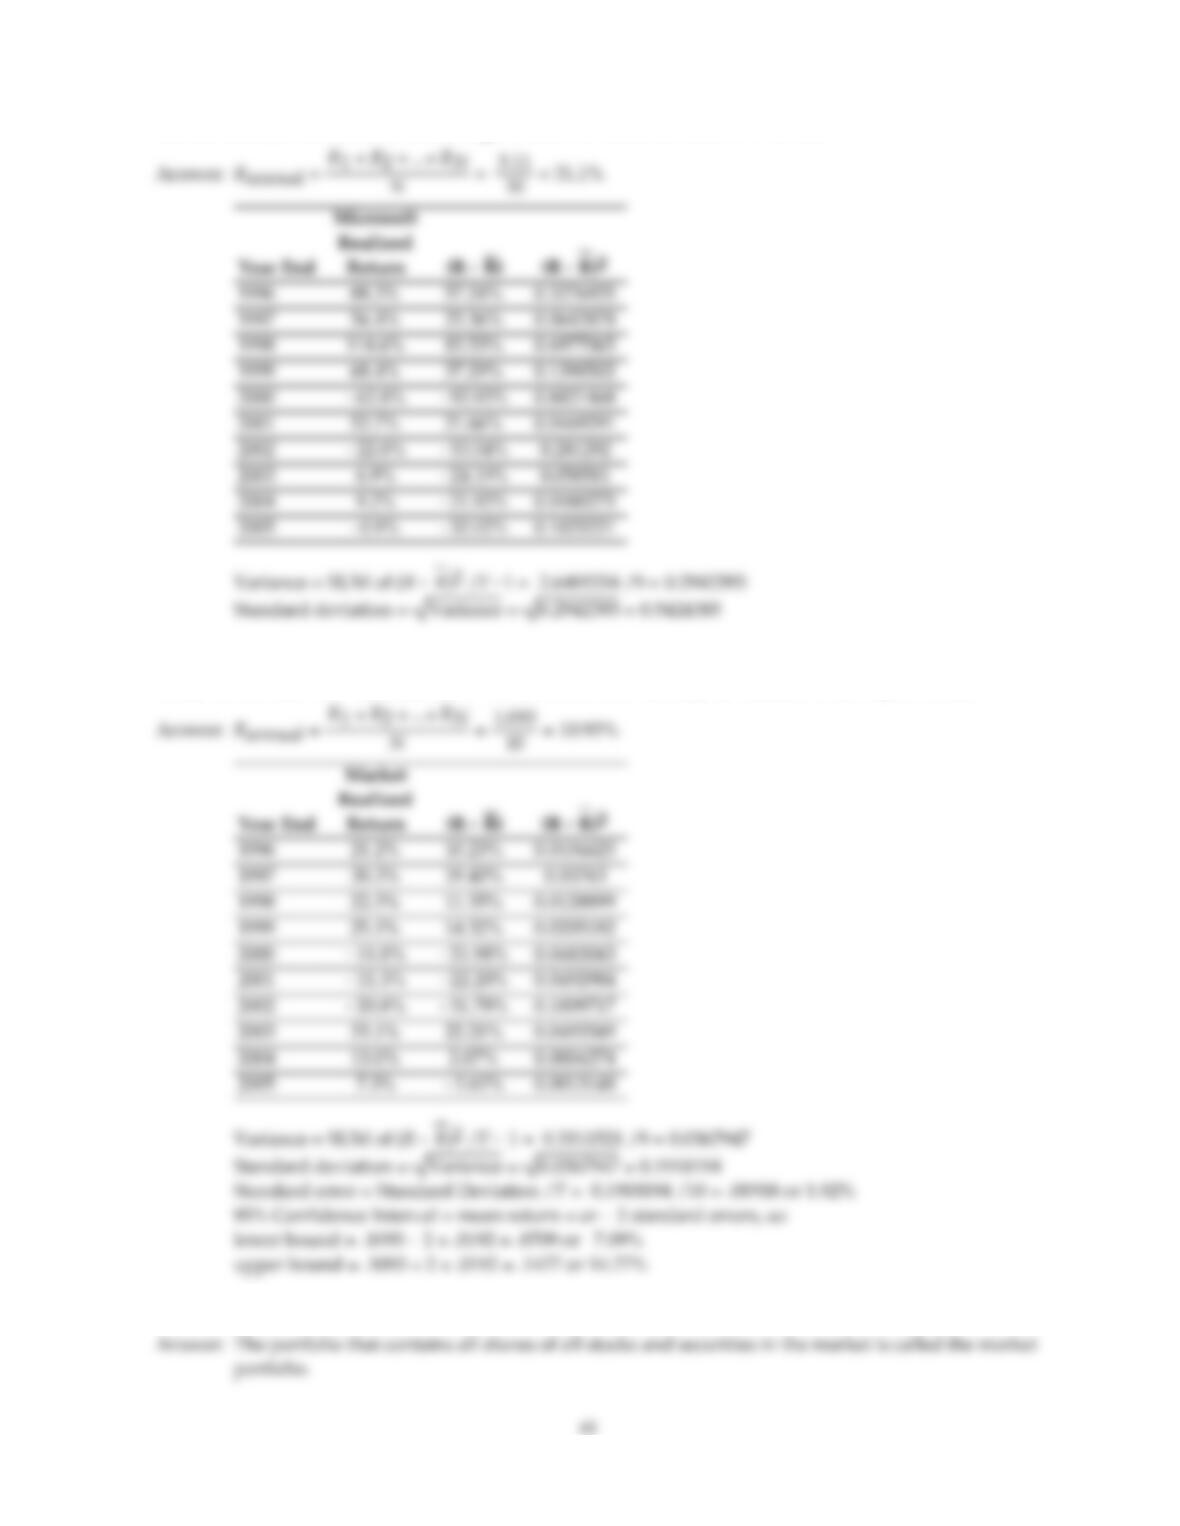
Using the data provided in the table, calculate the average annual return, the variance of the annual returns,
and the standard deviation of the average returns for Microsoft from 1996 to 2005.
81)
Suppose that you want to use the 10 year historical average return on the Market to forecast the expected future
return on the S&P 500. Calculate the 95% confidence interval for your estimate of the expect return.
82)
What is the market portfolio?
Answer Key
Testname: C10
Answer Key
Testname: C10
43
Answer Key
Testname: C10
44
Answer Key
Testname: C10