b.
What problem does a constant A/R turnover assumption cause?
c.
Provide a solution to the problem caused by a constant A/R turnover assumption.
5. The following balance sheet and income statement pertain to Goode Corp., using the following
assumptions complete a forecasted 2013 income statement:
Assumptions for 2013:
Revenue growth rate
45%
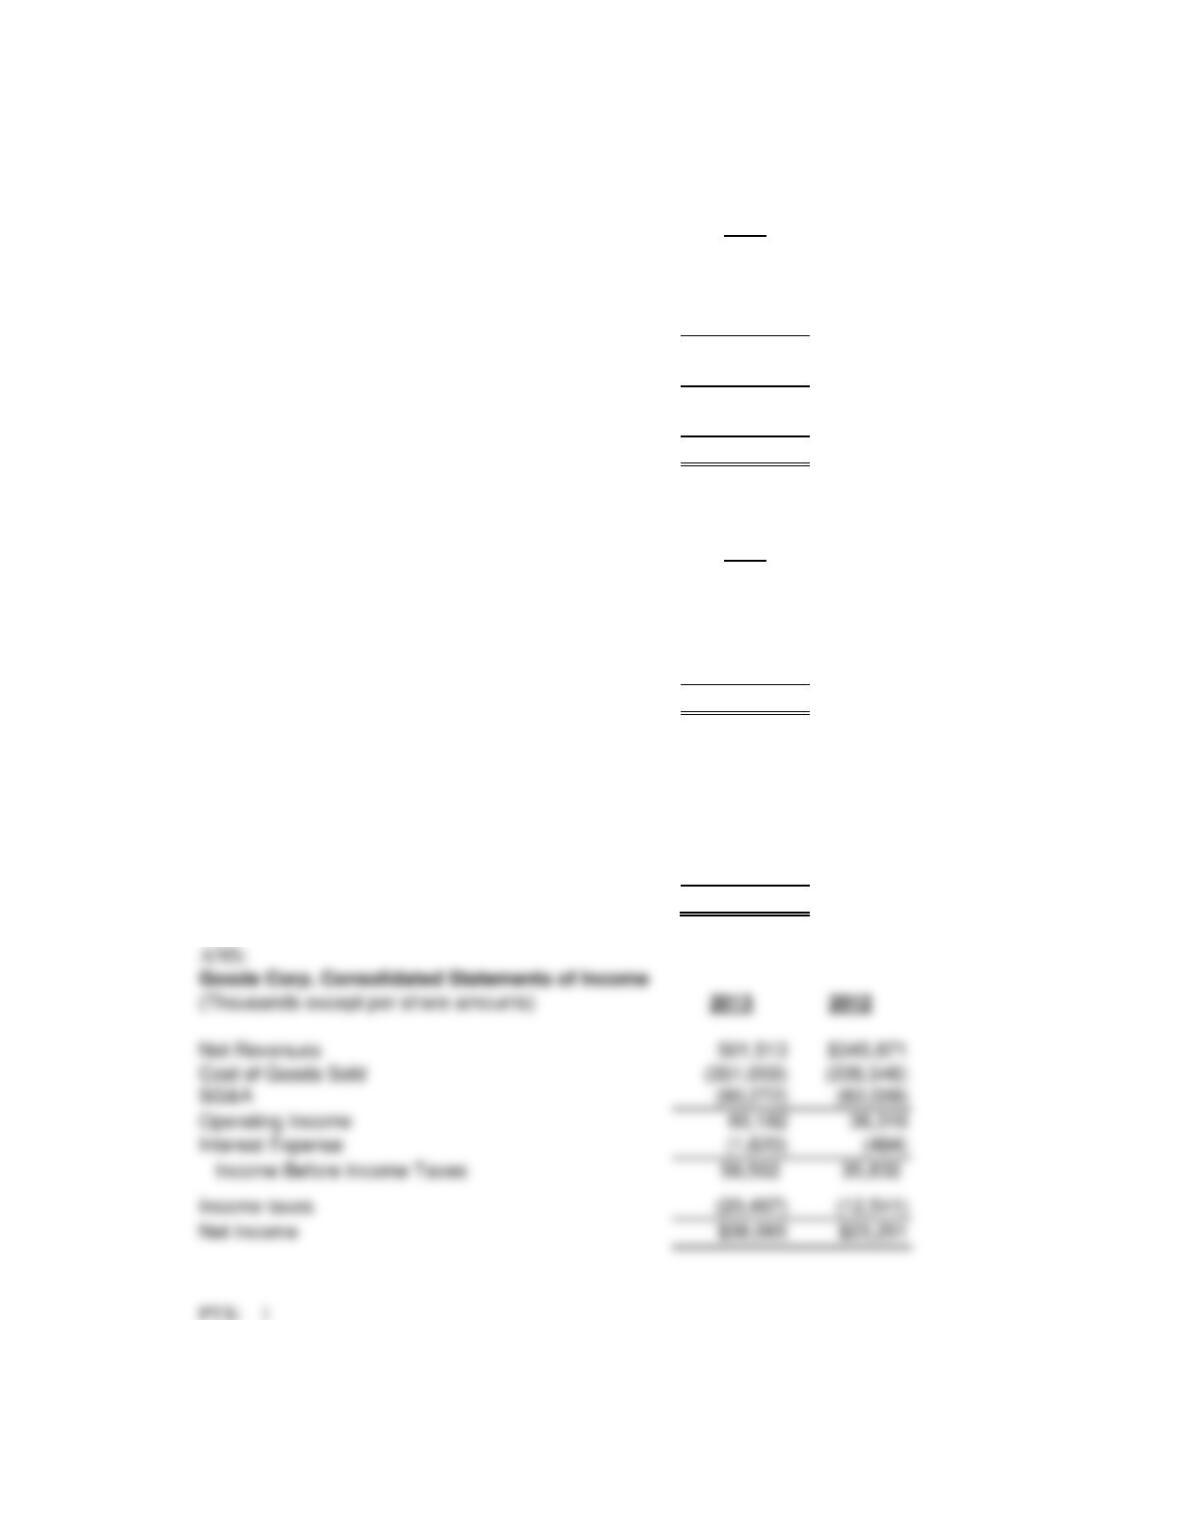
COGS
70% of sales
Operating expenses
18% of sales
Interest expense
12% of beginning long-term debt
Tax rate
35%
Goode Corp. Consolidated Statement of Income
(Thousands except per share amounts)
2012
Net Revenues
$345,871
Cost of Revenue
(226,546)
SG&A
(83,009)
Operating Income
36,316
Interest Expense
(484)
Income Before Income Taxes
35,832
Income taxes
(12,541)
Net Income
$23,291
Goode Corp Consolidated Balance Sheet
(Thousands)
2012
Current Assets
Cash and Equivalents
7,905
Merchandise inventory
6,308
Accounts receivable
6,614
PPE (including intangibles), net
39,458
Total Assets
60,285
Liabilities and Stockholders’ Equity
Accounts payable
9,643
Long-term debt
13,500
Shareholders’ Equity
Common stock and APIC
28,613
Retained earnings
8,529
Total Liabilities and Shareholders’ Eq.
60,285
6. Simmons Company
Goode Corp. Consolidated Statements of Income
(Thousands except per share amounts)
Net Revenues
501,513
SG&A
Interest Expense
Income taxes
(12,541)
These data represent a summary of your first-iteration forecast amounts for Year 1. Simmons uses
dividends as a flexible financial account.
Year + 1
Operating Income
$ 58
Interest Expense
8
Income before Tax
$ 50
Tax Provision (20.0 percent effective tax rate)
10
Net Income
$ 40
Total Assets
$200
Accrued Liabilities
$ 43
Long-Term Debt
$ 80
Common Stock, at par
$ 20
Retained Earnings (at the beginning of Year 1)
$ 34
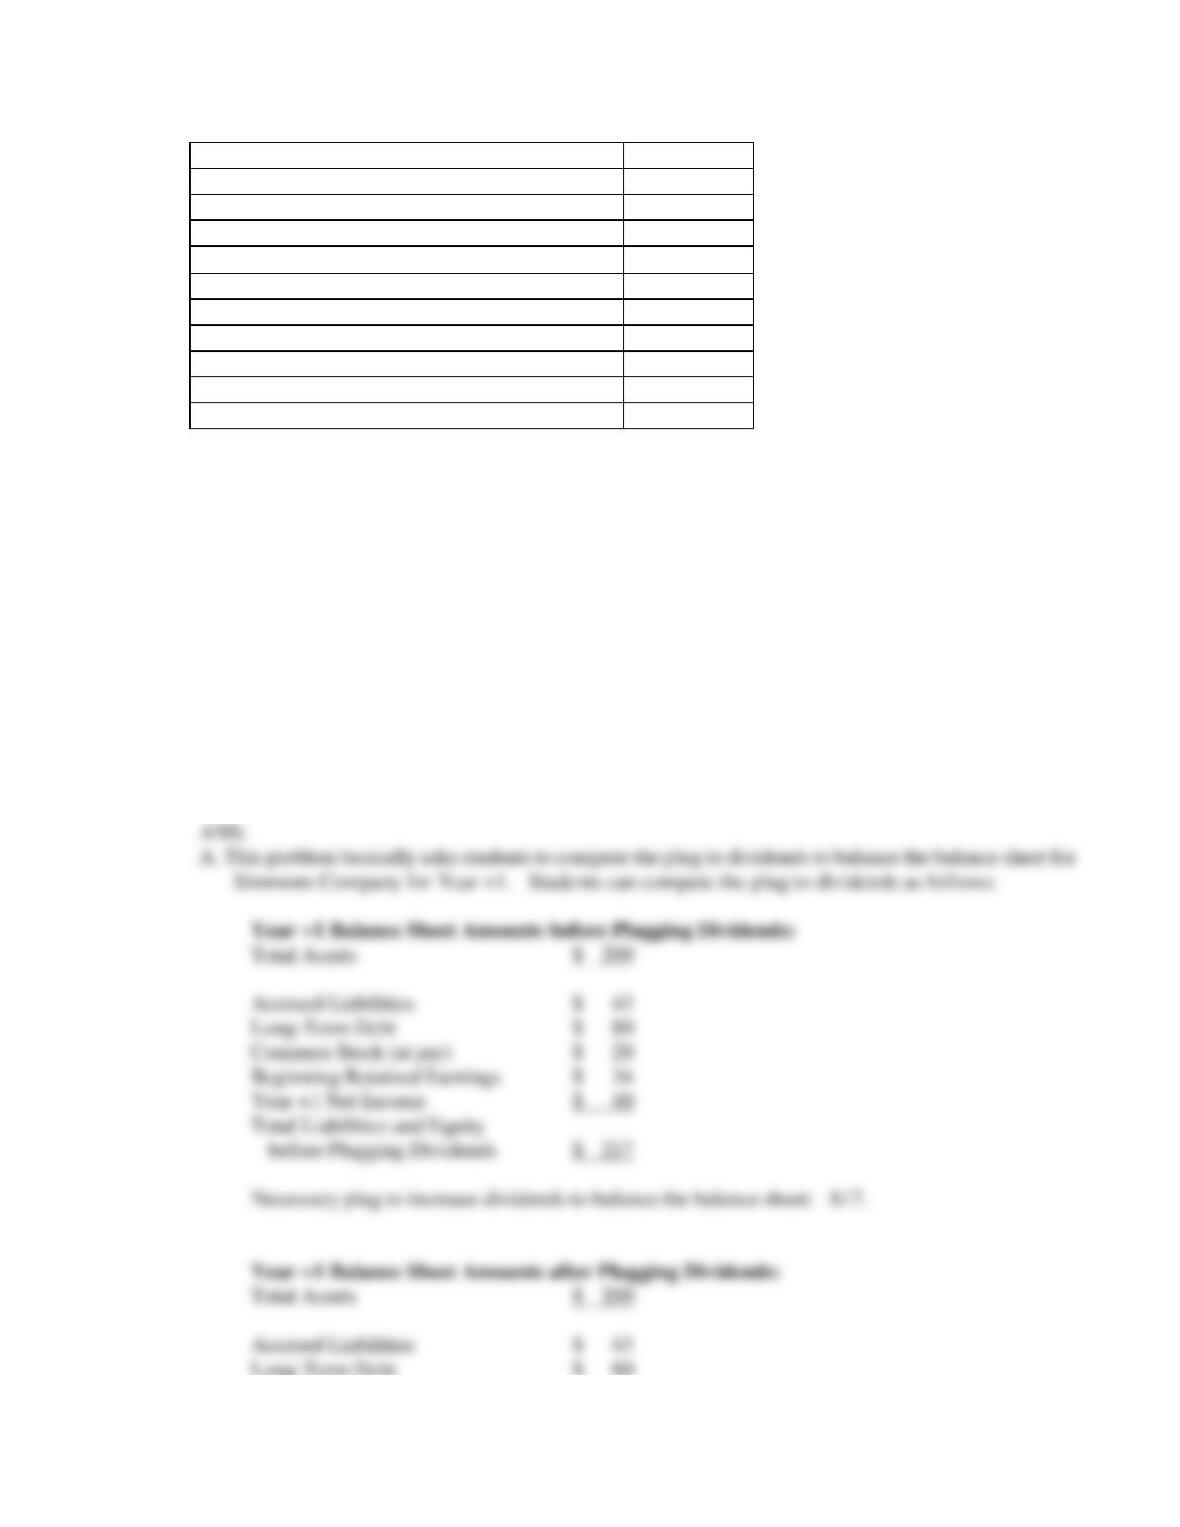
A. See the information for Simmons Company.
Compute the amount of dividends you can assume that Simmons will pay in order to balance your
projected balance sheet. Present the projected balance sheet.
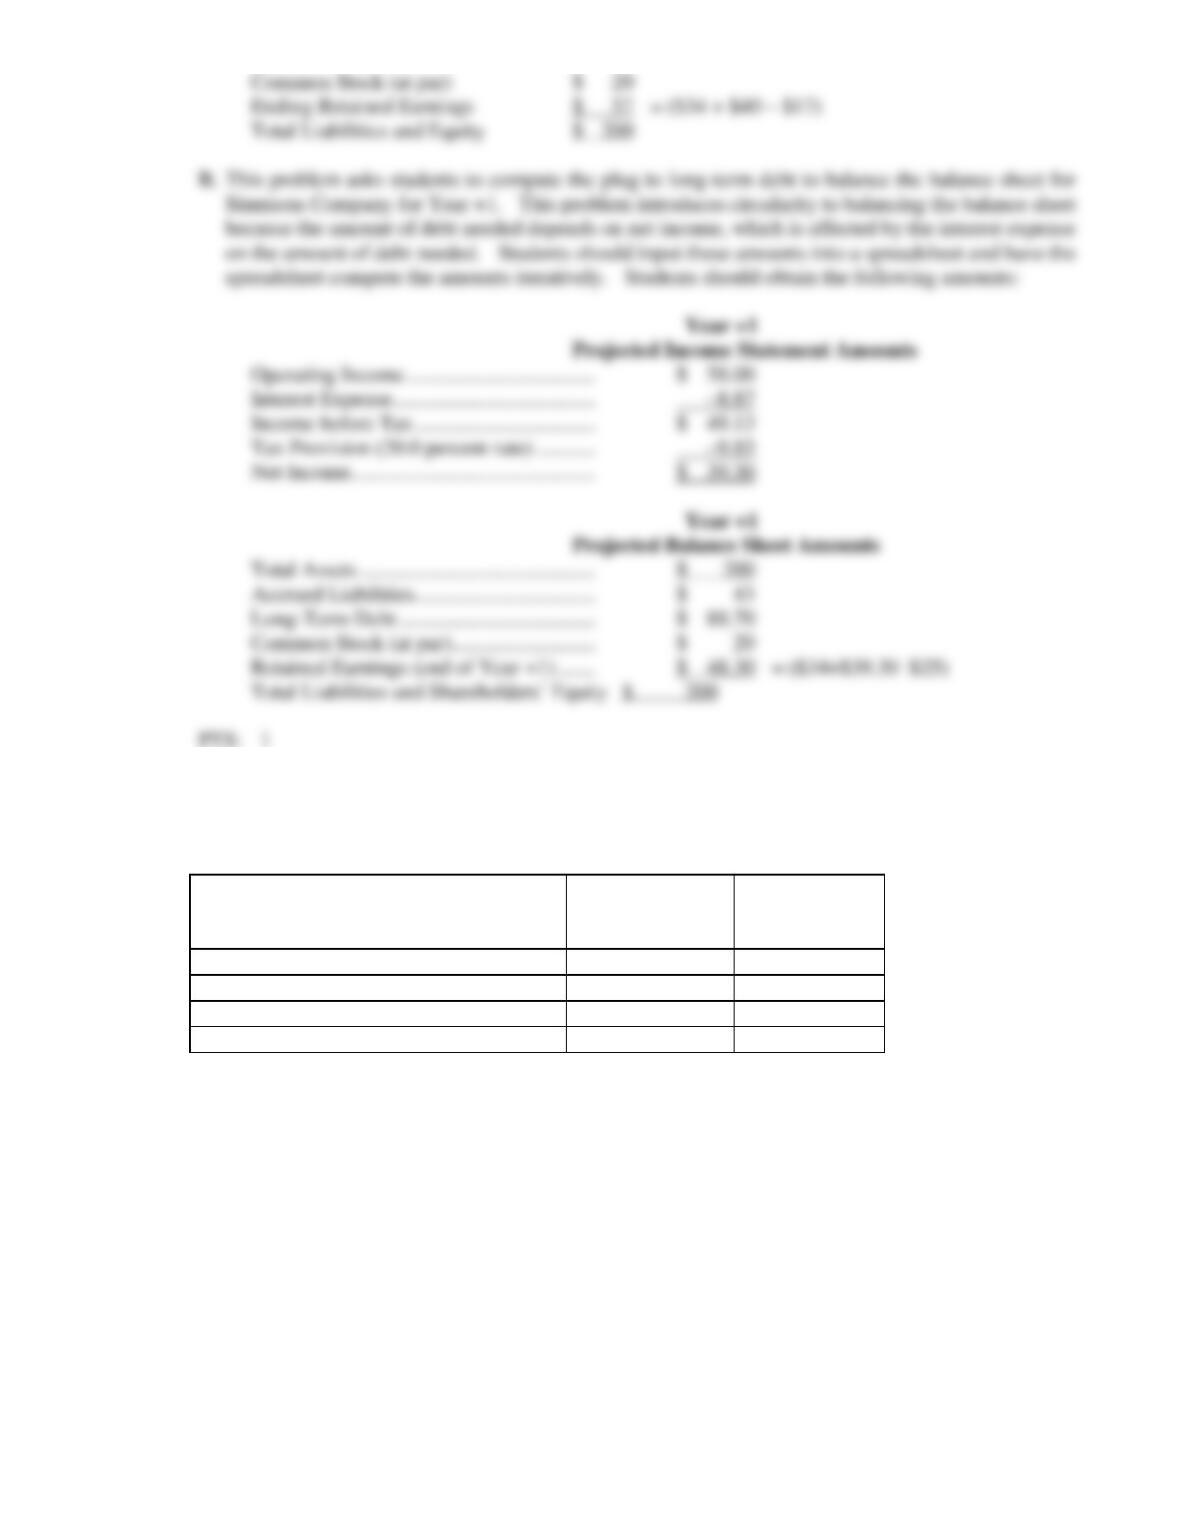
B. See the information for Simmons Company.
Now assume that Simmons pays common shareholders a dividend of $25 in Year +1. Also assume
that Simmons uses long-term debt as a flexible financial account, increasing borrowing when it needs
capital and paying down debt when it generates excess capital. For simplicity, assume that Simmons
pays 10.0 percent interest expense on the ending balance in long-term debt for the year and that
interest expense is tax deductible at Simmons’ average tax rate of 20.0 percent.
Present the projected income statement and balance sheet for Year +1. (Hint: Because of the
circularity between interest expense, net income, and debt, several iterations may be needed to
balance the projected balance sheet and to have the projected balance sheet articulate with net
income. You may find it helpful to program a spreadsheet to work the iterative computations.)
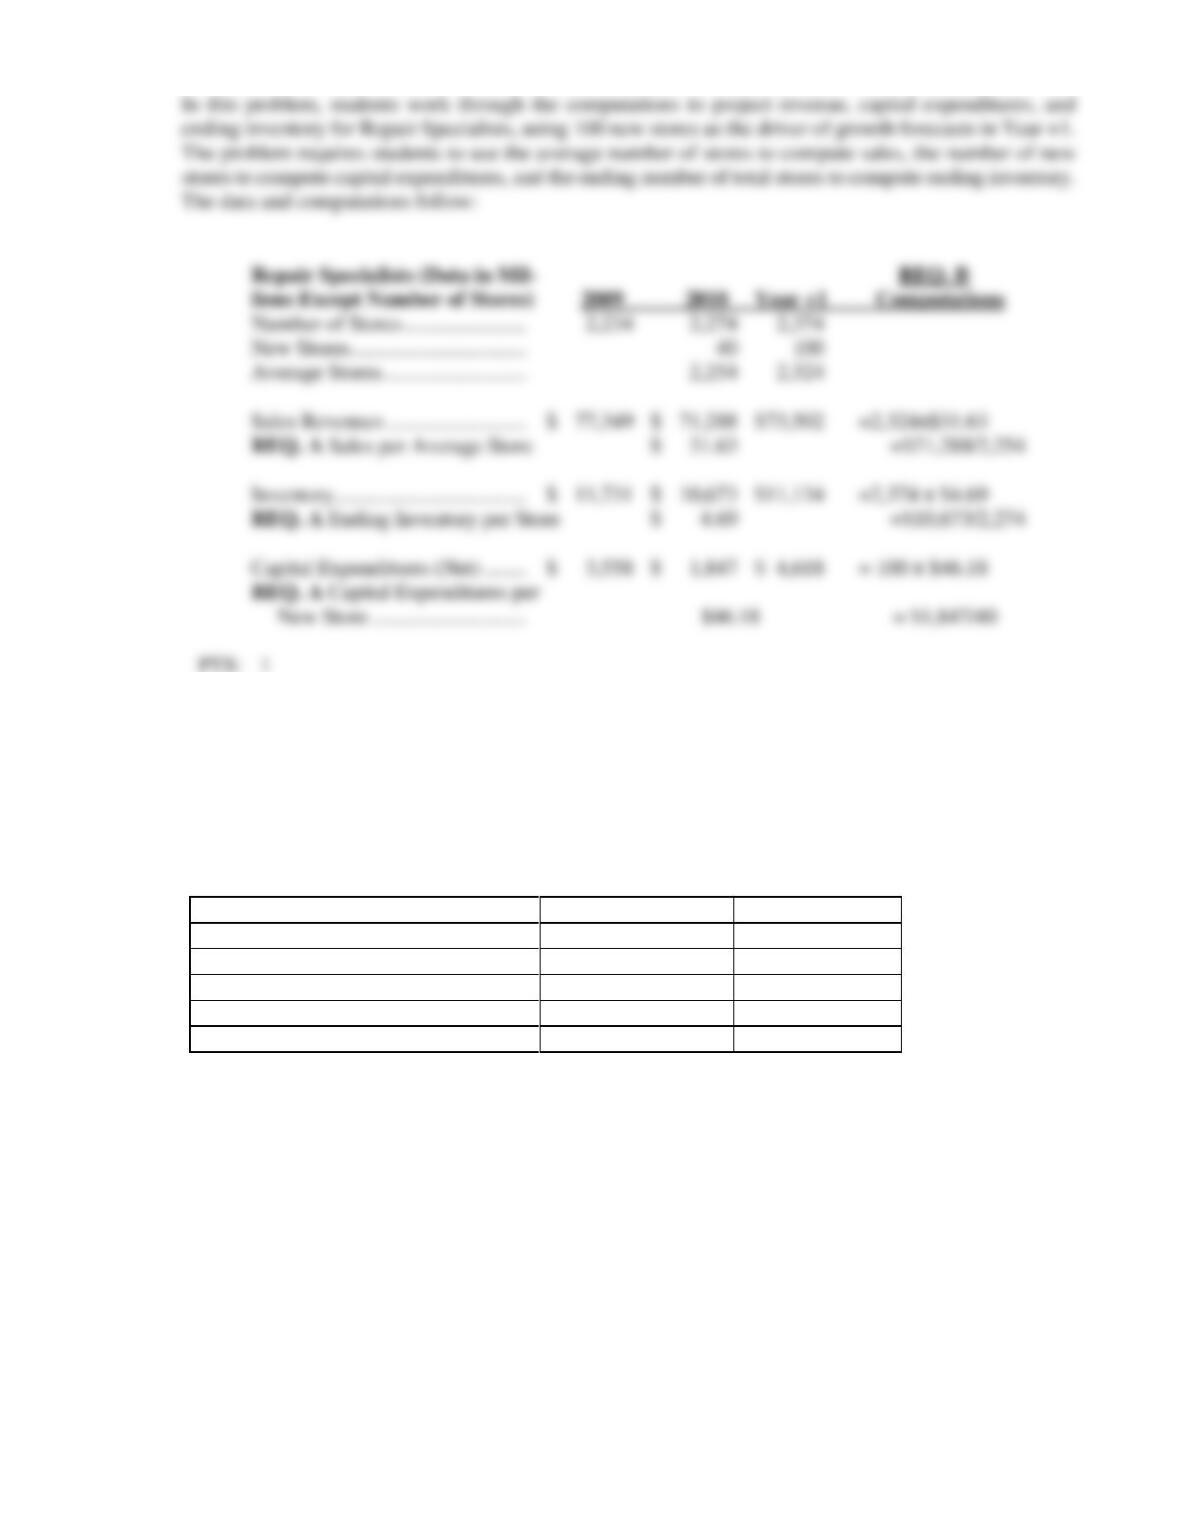
7. Repair Specialists is a leading retailer of home improvement products. It operates large warehouse-style
stores. Despite declining sales and difficult economic conditions in 2009 and 2010, Repair Specialists
continued to invest in new stores. The following table provides summary data for Repair Specialists.
Repair Specialists
(amounts in millions except number of
stores)
2009
2010
Number of stores
2,234
2,274
Sales revenues
$77,349
$71,288
Inventory
$11,731
$10,673
Capital expenditures, net
$ 3,558
$ 1,847
Required
a. Use the preceding data for Repair Specialists to compute average revenues per store,
capital spending per new store, and ending inventory per store in 2010.
b. Assume that Repair Specialists will add 100 new stores by the end of Year 1. Use
the data from 2010 to project Year 1 sales revenues, capital spending, and ending
inventory. Assume that each new store will be open for business for an average of
one-half year in Year 1. For simplicity, assume that in Year 1, Repair Specialists’ sales
revenues will grow, but only because it will open new stores.
ANS:
8. Techtronics is a leader in manufacturing computer chips, which is very capital-intensive. Because the
production processes in computer chip manufacturing require sophisticated and rapidly changing
technology, production and manufacturing assets in the chip industry tend to have relatively short useful
lives.
The following summary information relates to Techtronics’ property, plant, and
equipment for 2009 and 2010:
Techtronics (amounts in millions)
2009
2010
Property, Plant, and Equipment, at cost
$ 46,052
$ 48,088
Accumulated Depreciation
$(29,134)
$(30,544)
Property, Plant, and Equipment, net
$ 16,918
$ 17,544
Depreciation Expense
$ 4,360
Capital Expenditures, net
$ 5,200
Required
Assume that Techtronics depreciates all property, plant, and equipment using the straight-line
depreciation method and zero salvage value. Assume that Intel spends $6,000 on new
depreciable assets in Year 1 and does not sell or retire any property, plant, and equipment
during Year 1.
a. Compute the average useful life that Techtronics used for depreciation in 2010.
b. Project total depreciation expense for Year 1 using the following steps: (i) project
depreciation expense for Year 1 on existing property, plant, and equipment at the
end of 2010; (ii) project depreciation expense on capital expenditures in Year 1
assuming that Intel takes a full year of depreciation in the first year of service; and
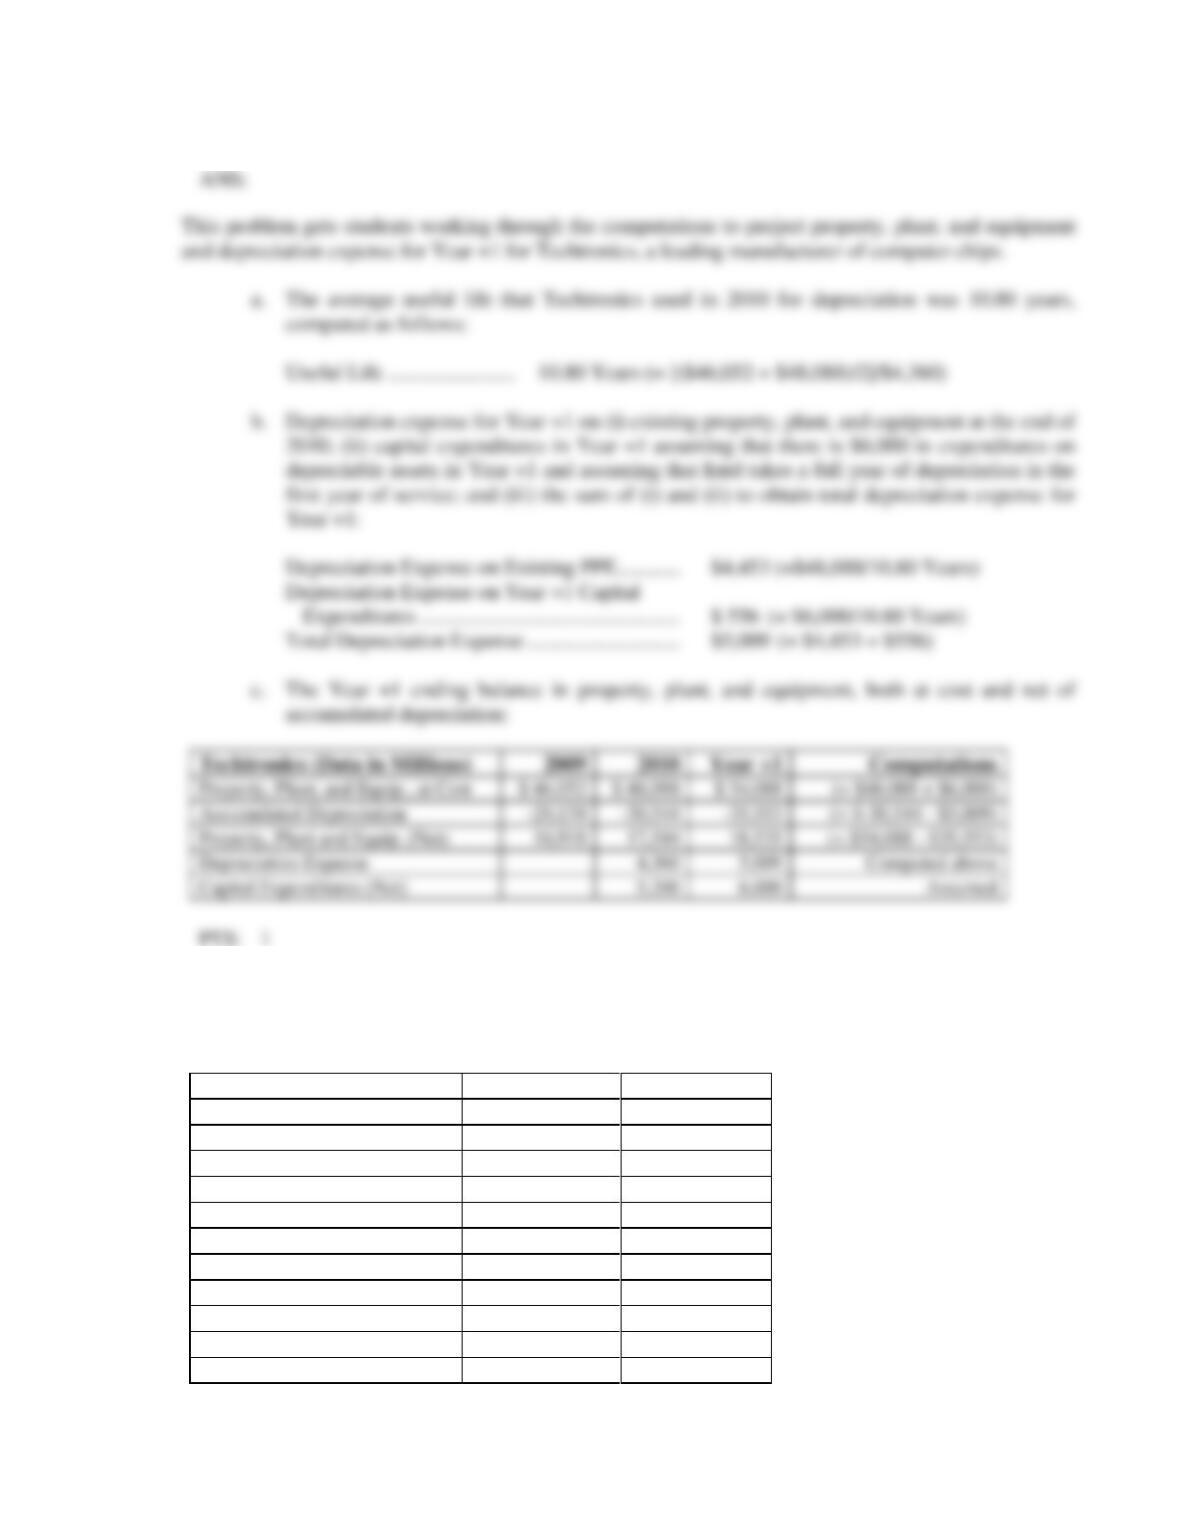
(iii) sum the results of (i) and (ii) to obtain total depreciation expense for Year 1.
c. Project the Year 1 ending balance in property, plant, and equipment, both at cost
and net of accumulated depreciation.
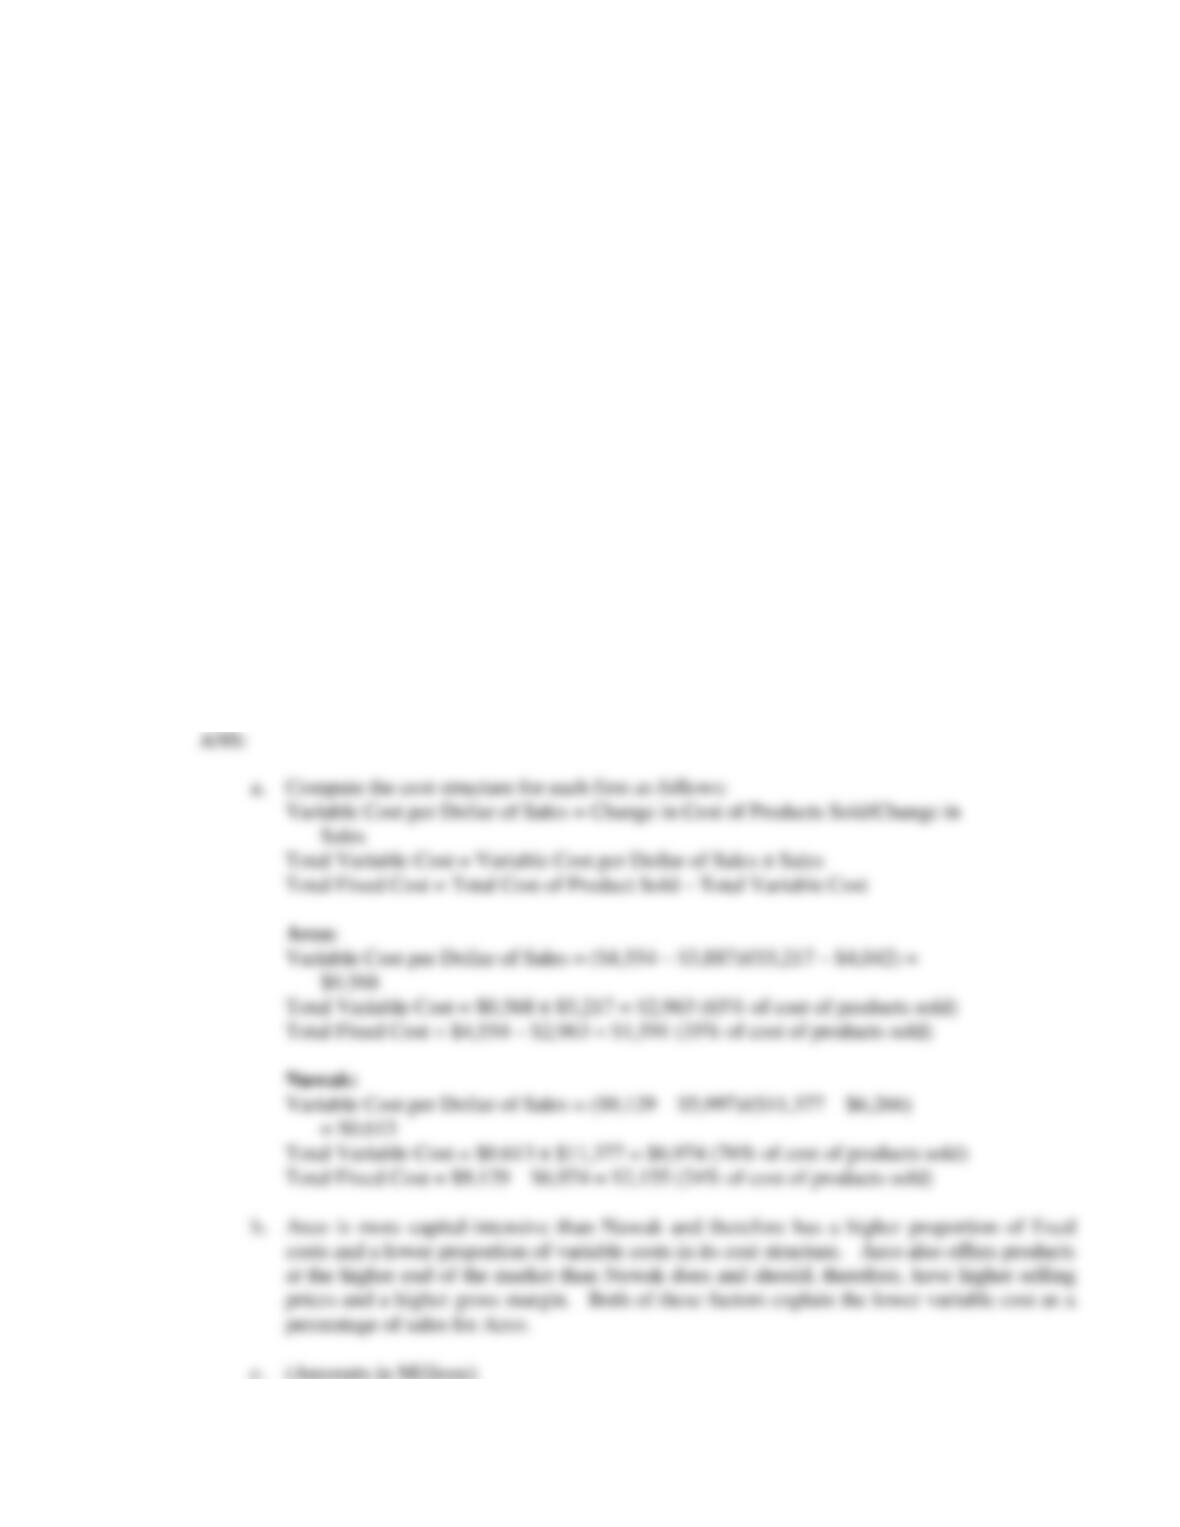
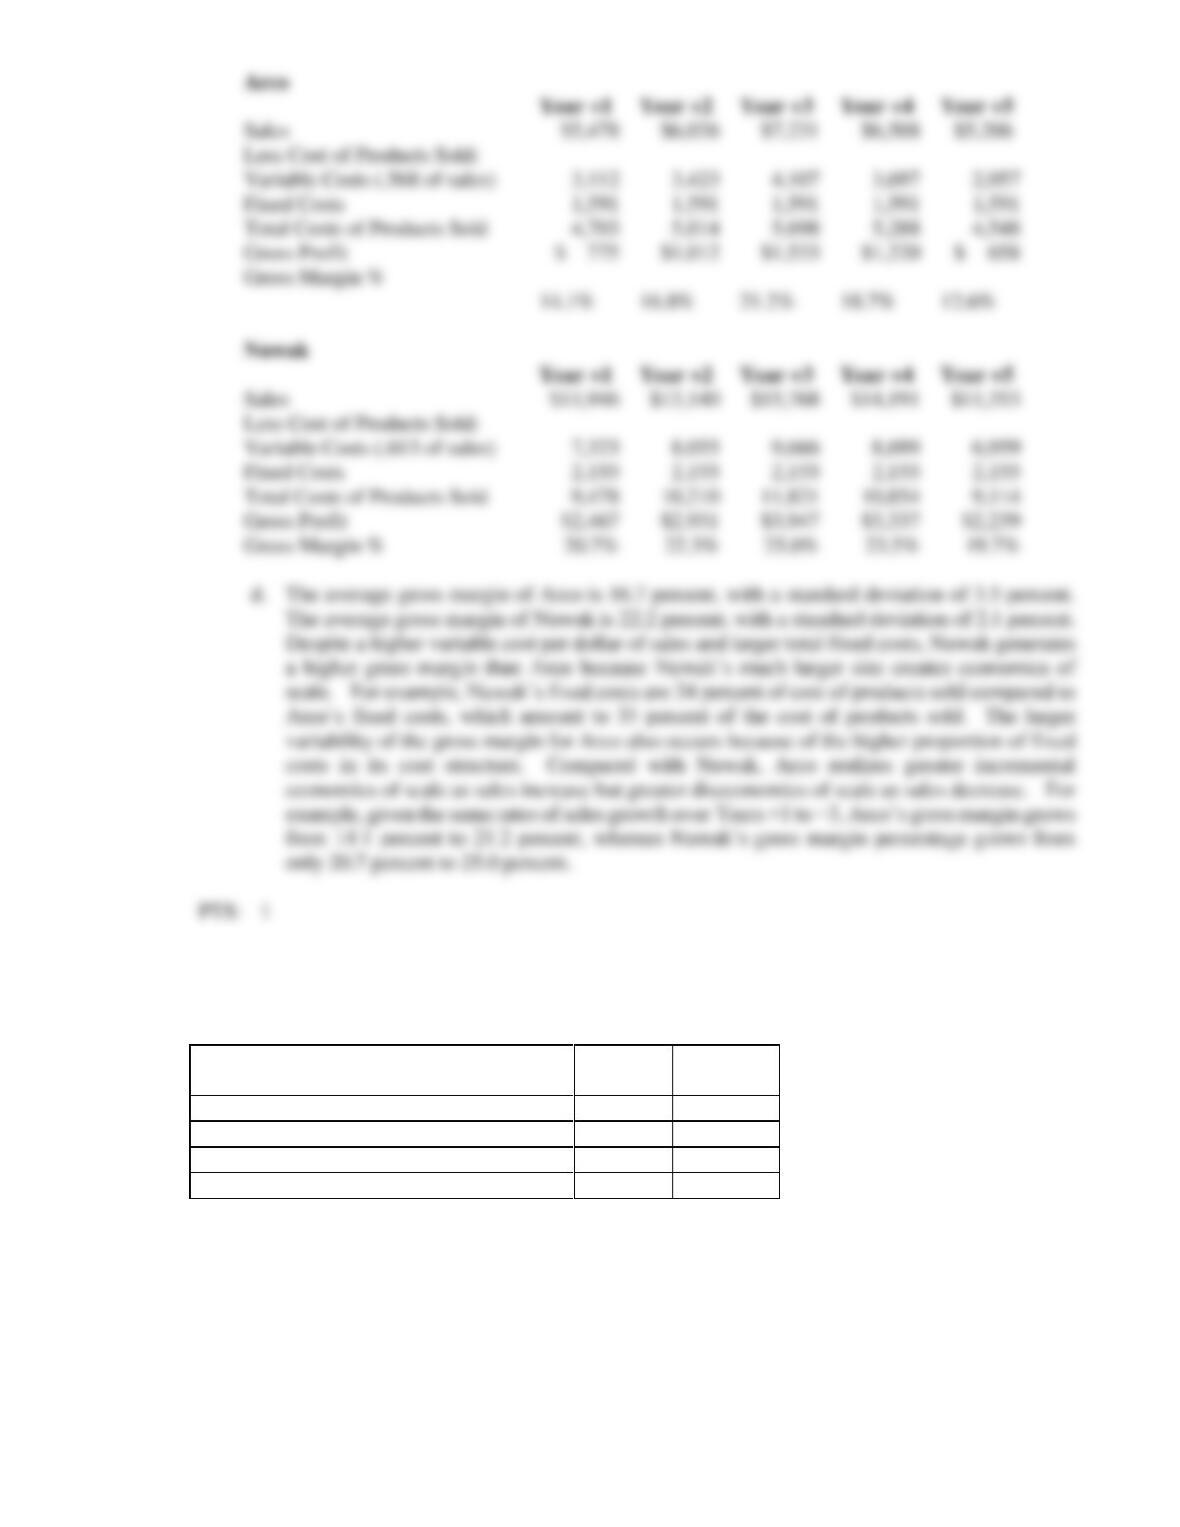
9. Arco is an integrated manufacturer in capital-intensive industry. Nuwak manufactures more
commodity-level products in the same industry at the lower end of the market and uses less
capital-intensive processes. The following data describe sales and cost of products sold for both firms for
Years 3 and 4.
($ amounts in millions)
Year 3
Year 4
Arco
Sales
$4,042
$ 5,217
Cost of Products Sold
3,887
4,554
Gross Profit
$ 155
$ 663
Gross Margin
3.8%
12.7%
Nuwak
Sales
$6,266
$11,377
Cost of Products Sold
5,997
9,129
Gross Profit
$ 269
$ 2,248
Gross Margin
4.3%
19.8%
Techtronics (Data in Millions)
Industry analysts anticipate the following annual changes in sales for the next five years:
Year +1, 5 percent increase; Year +2, 10 percent increase; Year +3, 20 percent increase; Year +4, 10
percent decrease; Year +5, 20 percent decrease.
Required
a. The analyst can sometimes estimate the variable cost as a percentage of sales for a
particular cost (for example, cost of products sold) by dividing the amount of the
change in the cost item between two years by the amount of the change in sales for
those two years. The analyst can then multiply the variable-cost percentage times
sales to estimate the total variable cost. Subtracting the variable cost from the total
cost yields an estimate of the fixed cost for that particular cost item. Follow this procedure
to estimate the manufacturing cost structure (variable cost as a percentage of
sales, total variable costs, and total fixed costs) for cost of products sold for both Arco and Nuwak in
Year 4.
b. Discuss the structure of manufacturing cost (that is, fixed versus variable) for each
firm in light of the manufacturing process and type of product produced.
c. Using the analysts’ forecasts of sales changes, compute the projected sales, cost of
products sold, gross profit, and gross margin (gross profit as a percentage of sales)
of each firm for Year +1 through Year +5.
d. Why do the levels and variability of the gross margin percentages differ for these two
firms for Year +1 through Year +5?
10. Saunders Corporation manufactures consumer electronics products. Selected income statement data for
2009 and 2010 follow (amounts in millions of dollars):
Saunders Corporation (amounts in
millions of dollars)
2009
2010
Sales
8,296
8,871
Cost of Goods Sold
(5,890)
(6,290)
Selling and Administrative Expenses
(1,788)
(1,714)
Operating Income before Income Taxes
618
867
Required
3,112
3,423
4,107
3,697
2,957
7,323
8,055
9,666
8,699
6,959
9,478
9,114
20.7%
22.3%
25.0%
23.5%
19.7%
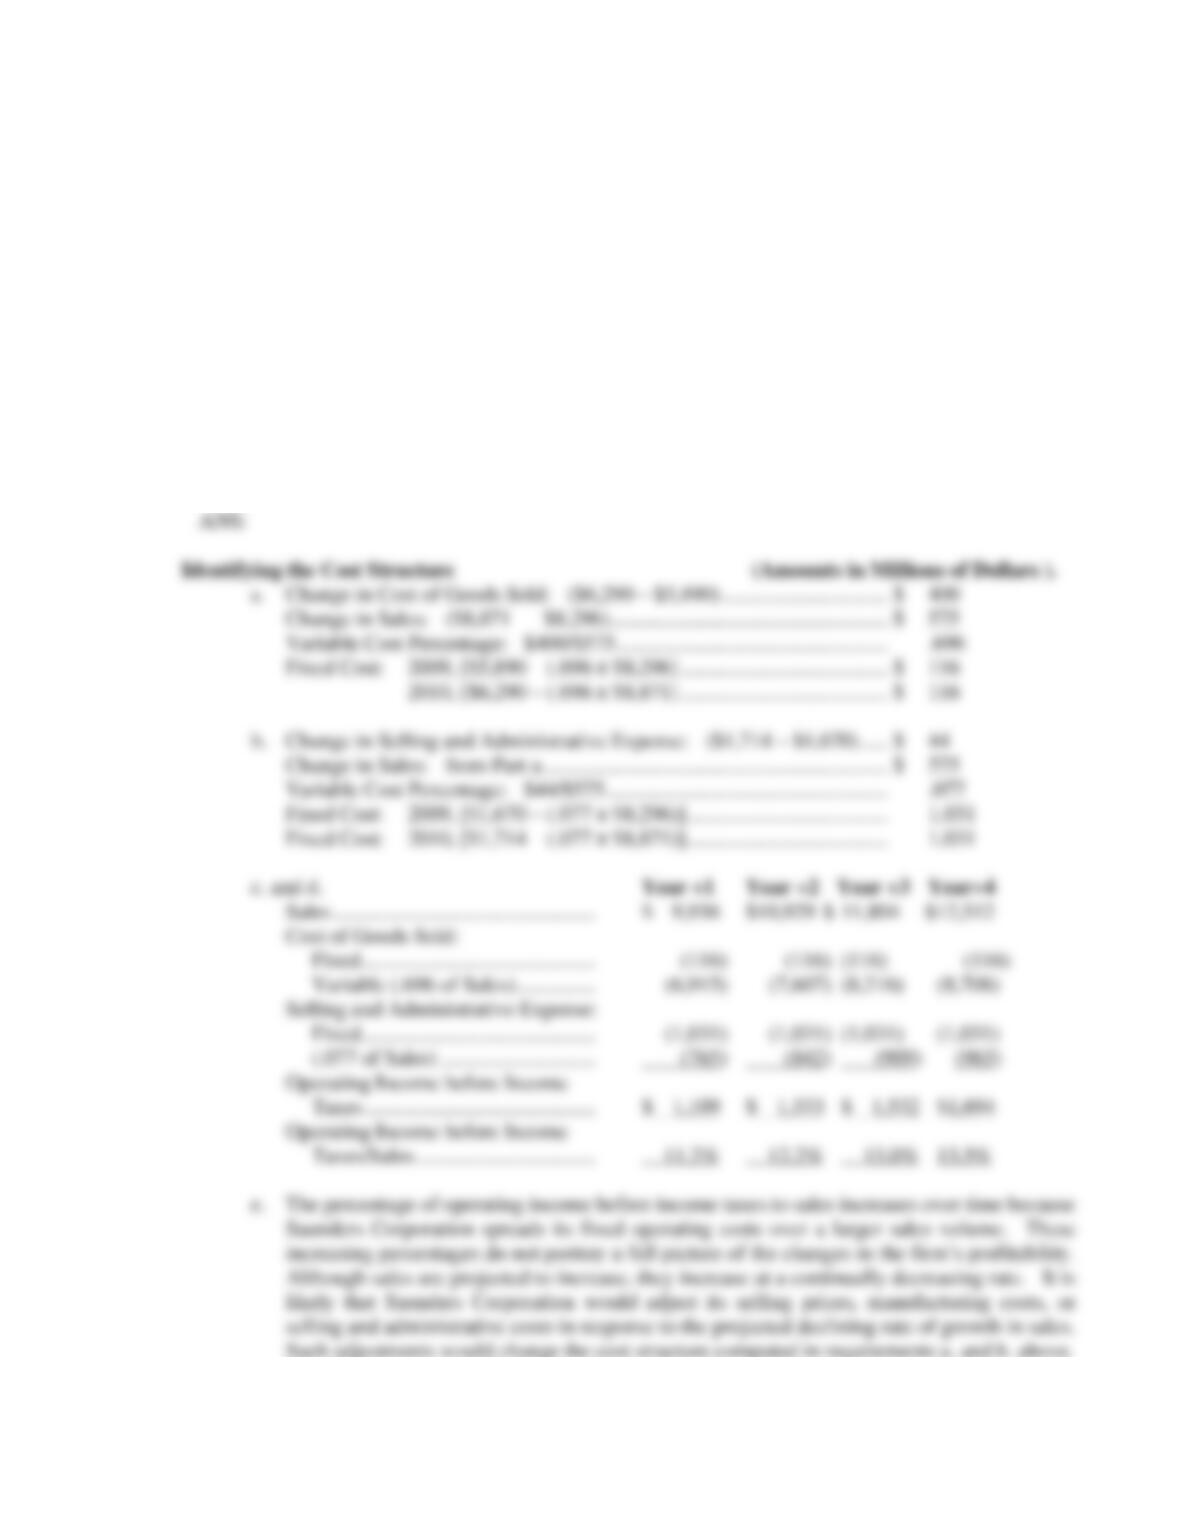
a. The analyst can sometimes estimate the variable cost as a percentage of sales for a particular cost (for
example, cost of goods sold) by dividing the amount of the change in the cost item between two years by
the amount of the change in sales for those two years. The analyst can then multiply total sales by the
variable-cost percentage to determine the total variable cost. Subtracting the variable cost from the total
cost yields the fixed cost component for that particular cost item. Follow this procedure to determine the
cost structure (fixed cost plus variable cost as a percentage of sales) for cost of goods sold for Saunders.
b. Repeat requirement a. for selling and administrative expenses.
c. Saunders Corporation discloses that it expects sales to grow at the following percentages
in future years: Year 1, 12 percent; Year 2, 10 percent; Year 3, 8 percent; Year 4, 6 percent. Project sales,
cost of goods sold, selling and administrative expenses, and operating income before income taxes for
Saunders for Year 1 to Year 4 using the cost structure amounts derived in requirements a. and b.
d. Compute the ratio of operating income before income taxes to sales for Year 1 through Year 4.
e. Interpret the changes in the ratio computed in requirement d. in light of the expected changes in sales.
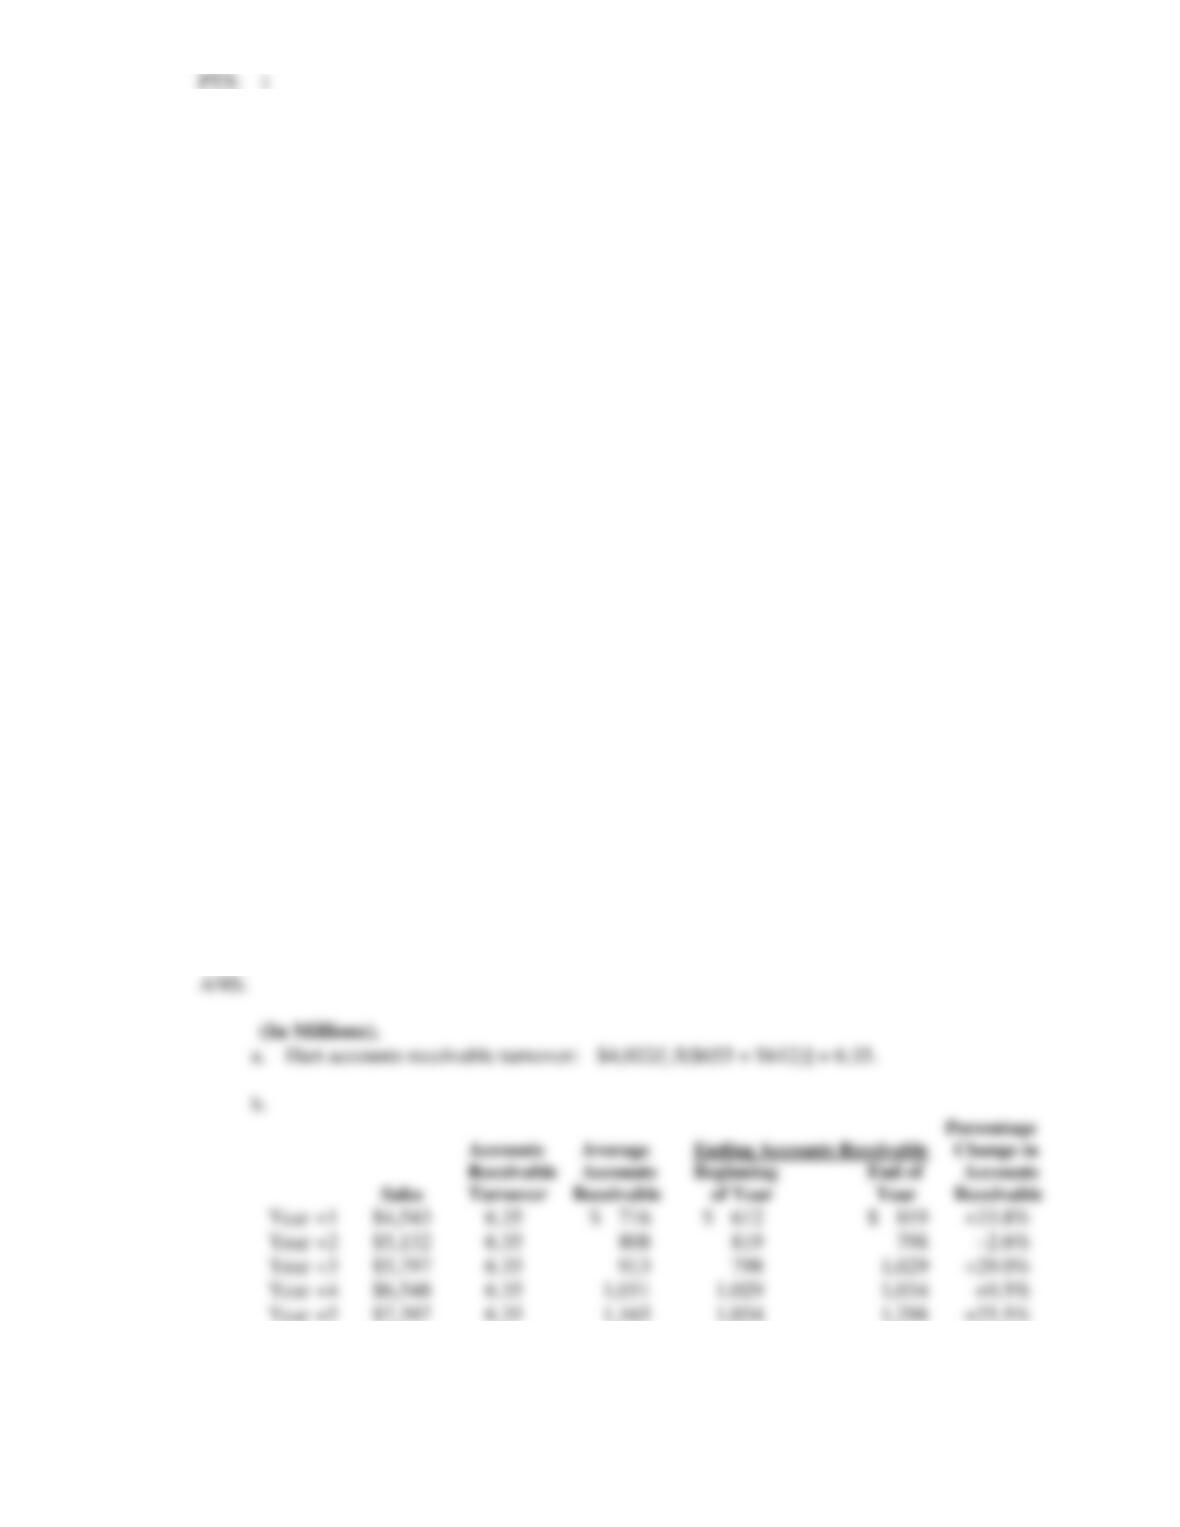
11. Hart designs, manufactures, and markets toys in domestic and international markets. Sales during 2010
totaled $4,022 million. Accounts receivable totaled $655 million at the beginning of 2010 and $612
million at the end of 2010.
Required
a. Use the average balance to compute the accounts receivable turnover ratio for Hart for 2010.
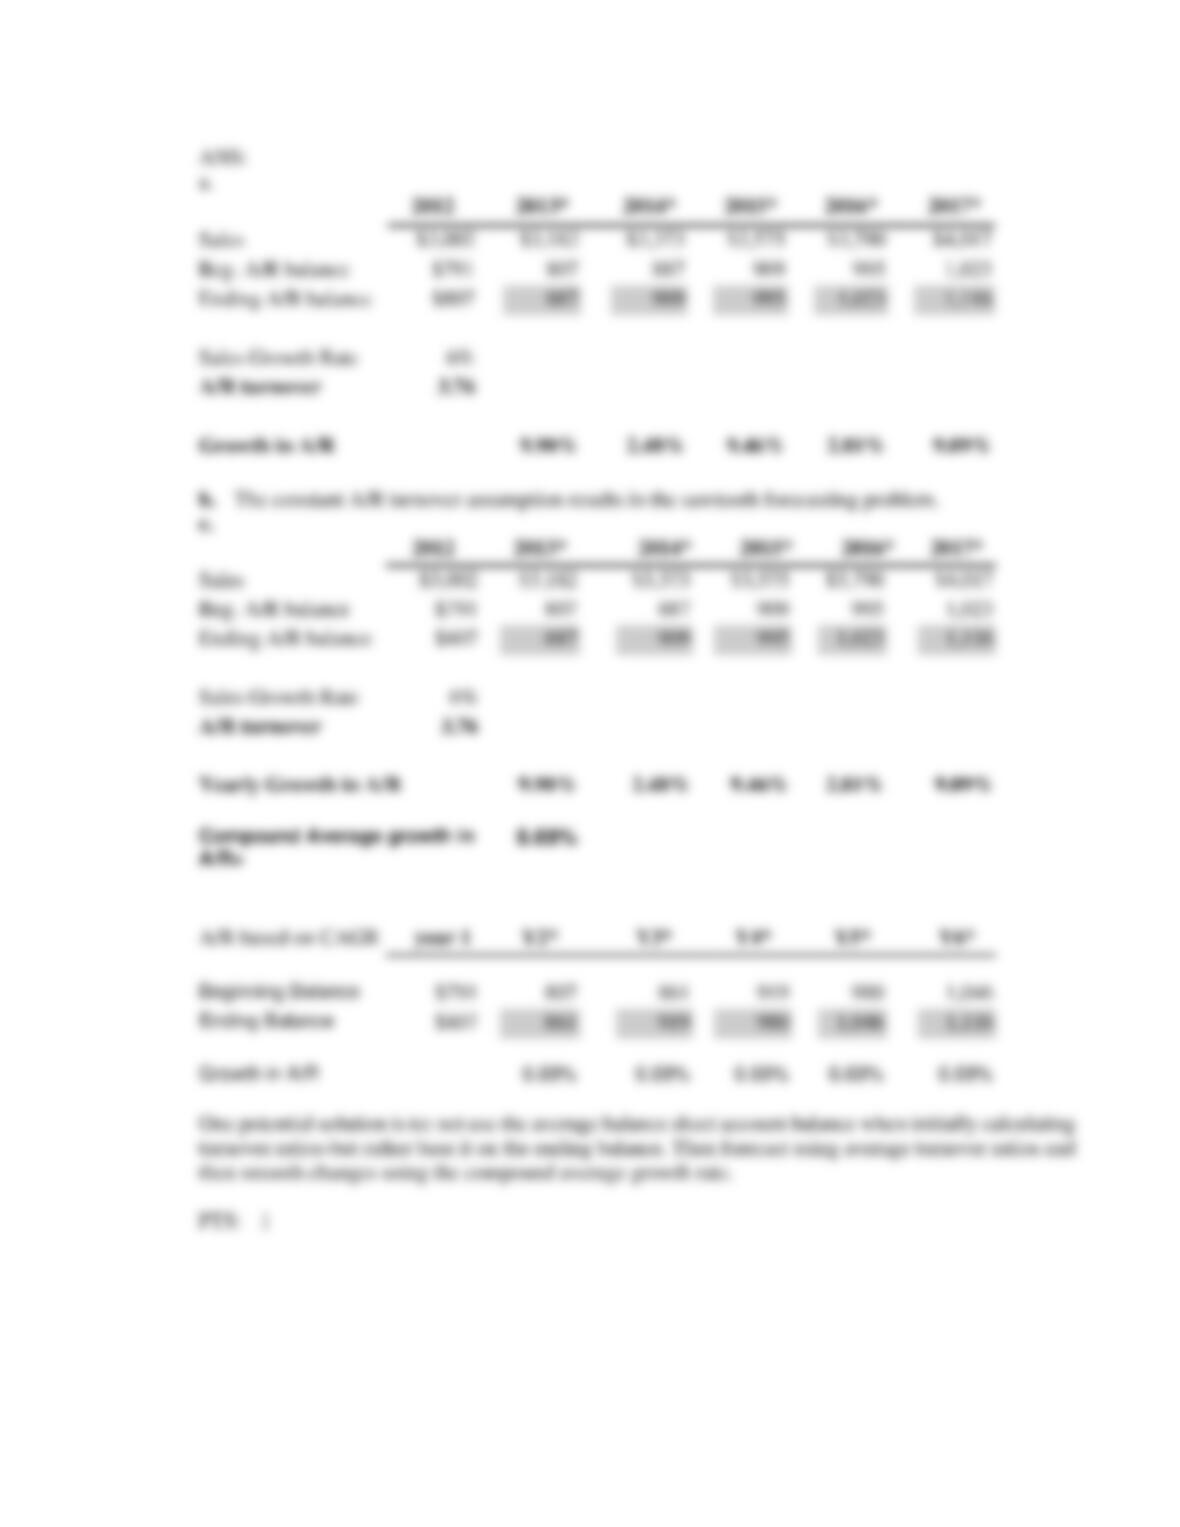
b. Hart generated a compound annual sales growth rate of 13.0 percent over the past two years. Assume
that Hart’s sales will continue to grow at that rate each year for Year +1 through Year +5 and that the
accounts receivable turnover ratio each year will equal the ratio computed in requirement a. for 2010.
Project the amount of accounts receivable at year-end through Year +5 based on the accounts receivable
turnover computed in requirement a. Also compute the percentage change in accounts receivable
between each of the year-ends through Year +5.
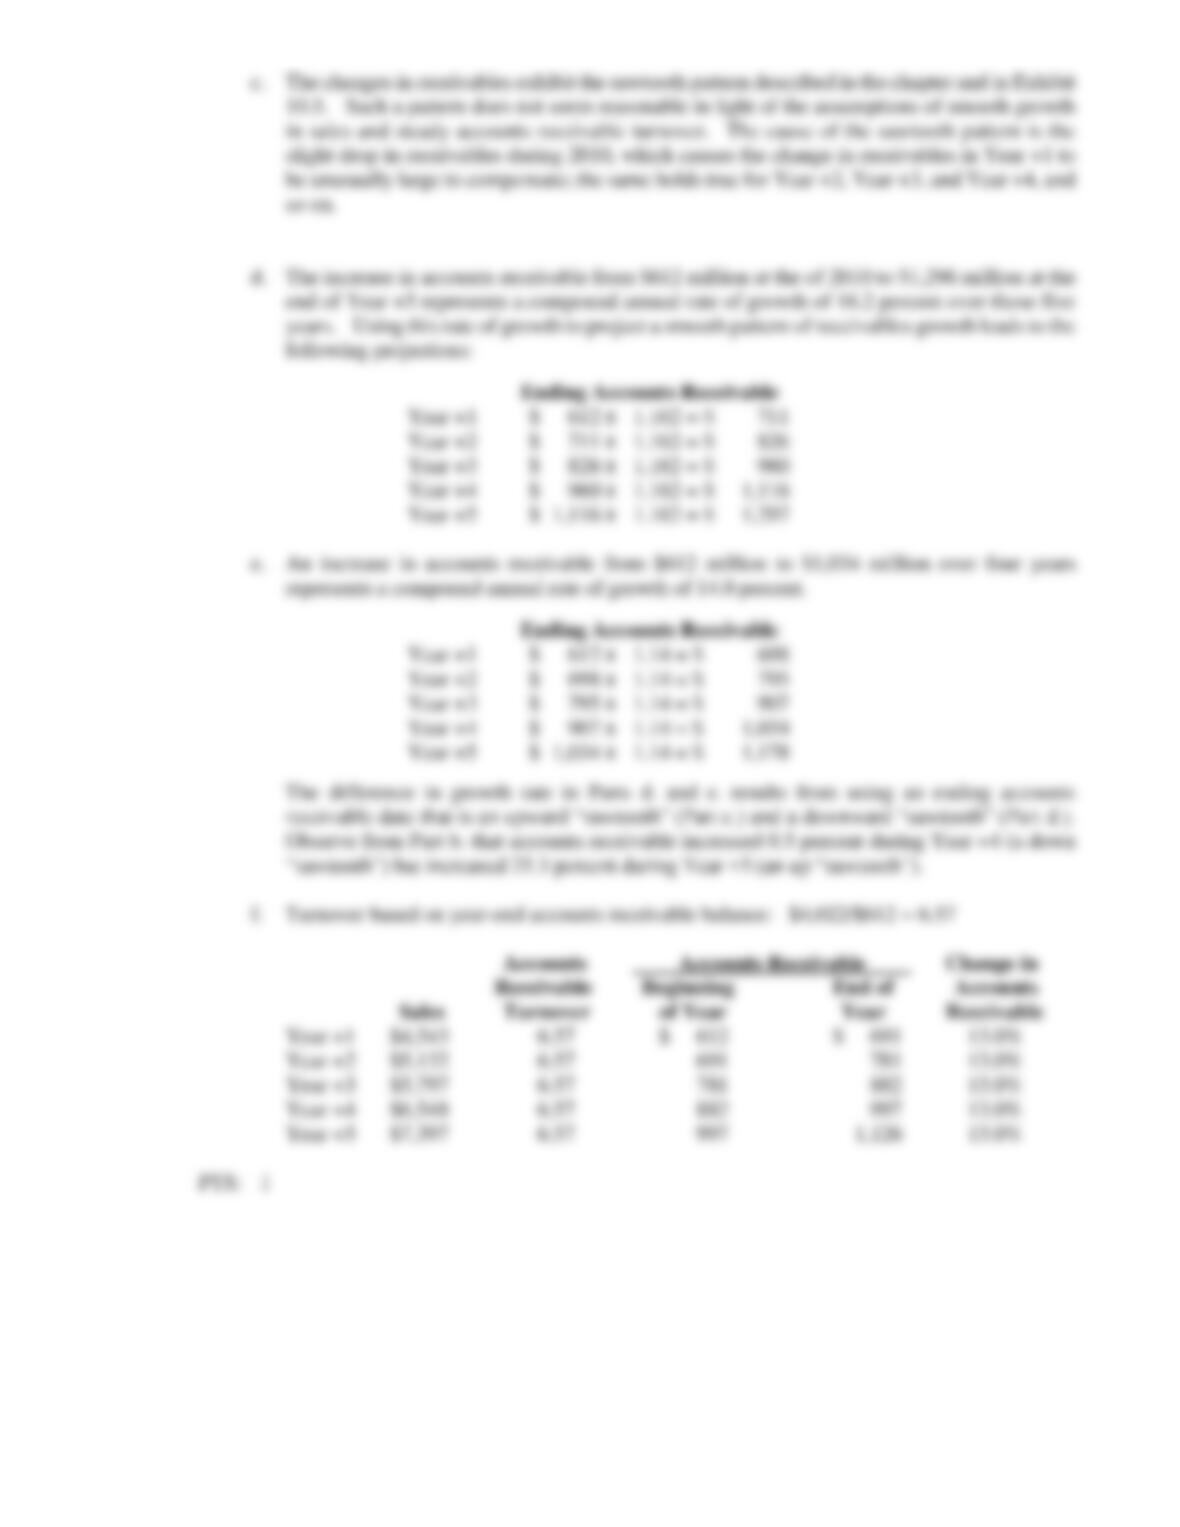
c. Does the pattern of growth in your projections of Hart’s accounts receivable seem
reasonable considering the assumptions of smooth growth in sales and steady turnover? Explain.
d. The changes in accounts receivable computed in requirement b. display the sawtooth pattern depicted
in Exhibit 10.5 in the text. Smooth the changes in accounts receivable by computing the year-end
accounts receivable balances for Year 1 through Year 5 using the compound annual growth rate in
accounts receivable between the end of 2010 and the end of Year +1 from requirement b.
e. Smooth the changes in accounts receivable using the compound annual growth rate in accounts
receivable between the end of 2010 and the end of Year +4 from requirement b. Apply this growth rate to
compute accounts receivable at the end of Year +1 through Year +5. Why do the amounts for ending
accounts receivable using the growth rate from requirement d. differ from those using the growth rate
from this requirement?
f. Compute the accounts receivable turnover for 2010 by dividing sales by the balance in accounts
receivable at the end of 2010 (instead of using average accounts receivable as in requirement a). Use this
accounts receivable turnover ratio to compute the projected balance in accounts receivable at the end of
Year +1 through Year +5. Also compute the percentage change in accounts receivable between the
year-ends for Year +1 through Year +5.
12. Benson sells books through retail stores and on the Web. For a retailer like Benson, inventory is a critical
element of the business and it is necessary to carry a wide array of titles. In 2010, sales totaled $5,122
million and cost of sales and occupancy totaled $3,541 million. Inventories constitute the largest asset on
Benson’s balance sheet, totaling $1,203 million at the end of 2010 and $1,358 million at the end of 2009.
Required
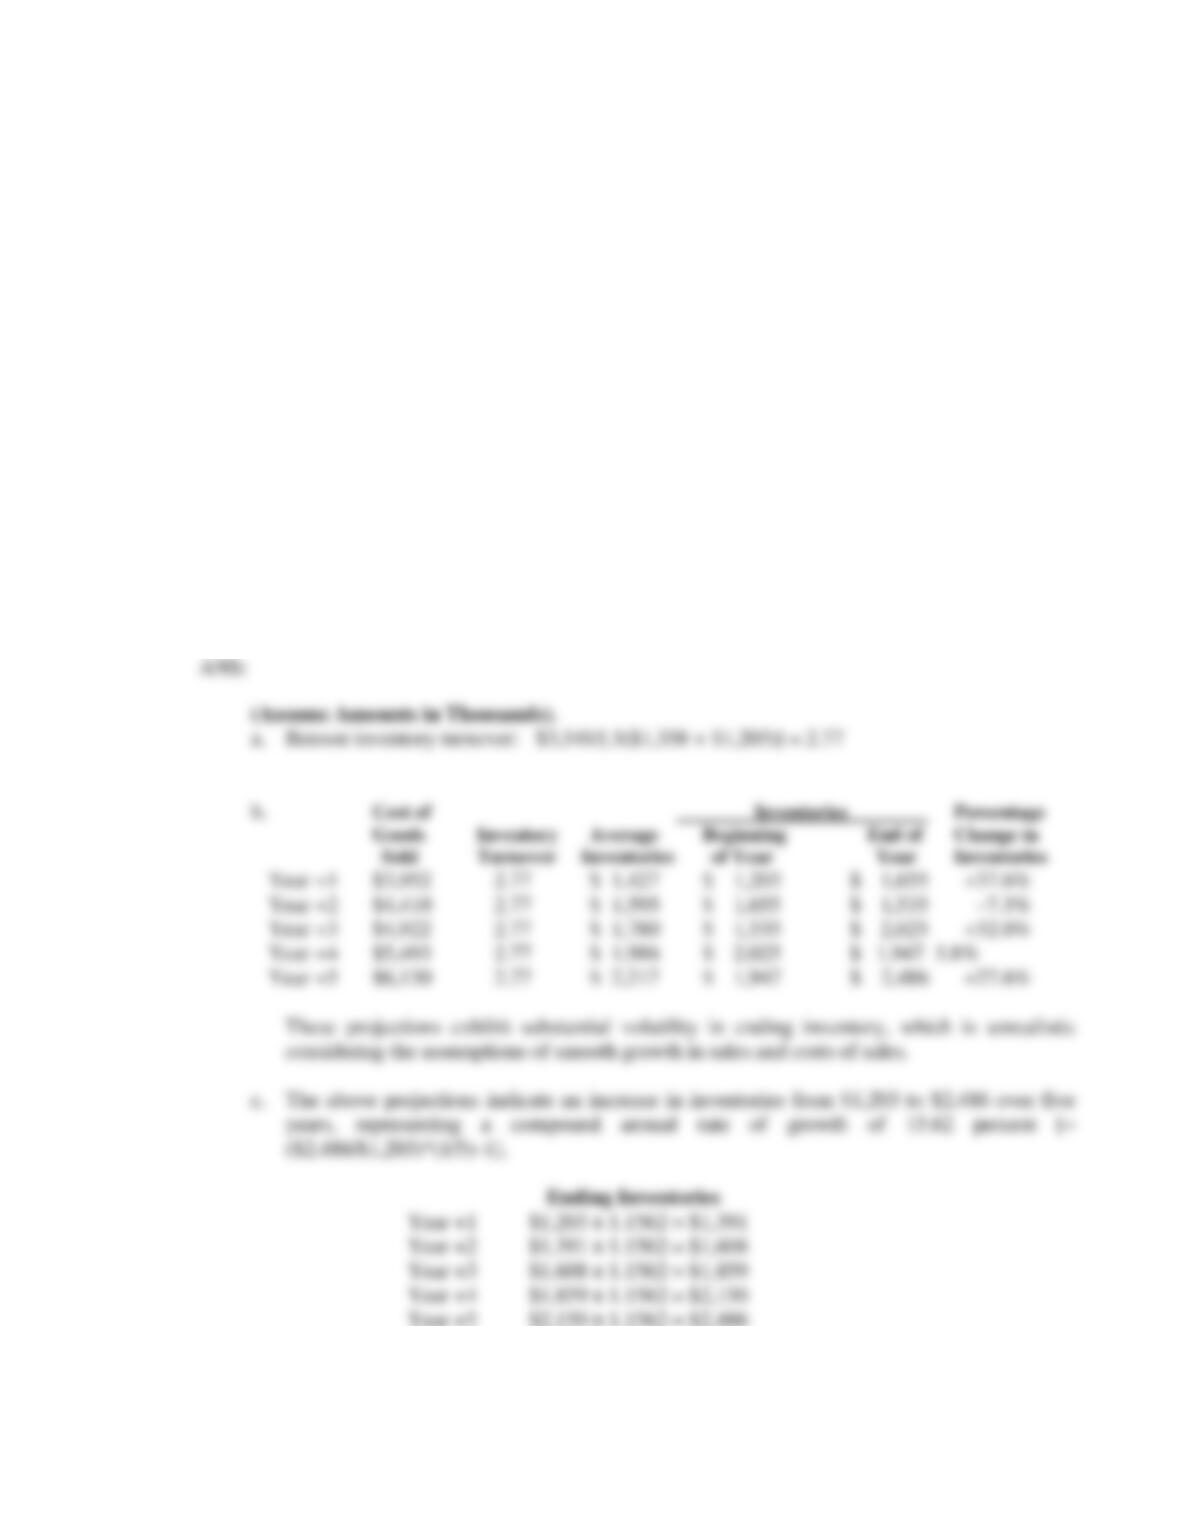
a. Compute the inventory turnover ratio for Benson for 2010.
b. Over the last two years, the number of Benson retail stores has remained fairly steady and sales have
grown at a compounded annual rate of 11.6 percent. Assume that the number of stores will remain
constant and that sales will continue to grow at an annual rate of 11.6 percent each year between Year +1
and Year +5. Also assume that the future cost of goods sold to sales percentage will equal that realized in
2010 (which is very similar to the cost of goods sold percentage over the past three years). Project the
amount of inventory at the end of Year +1 through Year +5 using the inventory turnover ratio computed
in Part a. Also compute the percentage change in inventories between each of the year-ends between
2010 and Year +5. Does the pattern of growth in your projections of Benson inventory seem reasonable
to you considering the assumptions of smooth growth in sales and steady cost of goods sold percentages?
Explain.
c. The changes in inventories in Part b display the sawtooth pattern depicted in Exhibit 10.5 of the text.
Smooth the changes in the inventory forecasts between 2010 and Year +5 using the compound annual
growth rate in inventories between the end of 2010 and the end of Year +5 implied by the projections in
Part b. Does this pattern of growth seem more reasonable? Explain.
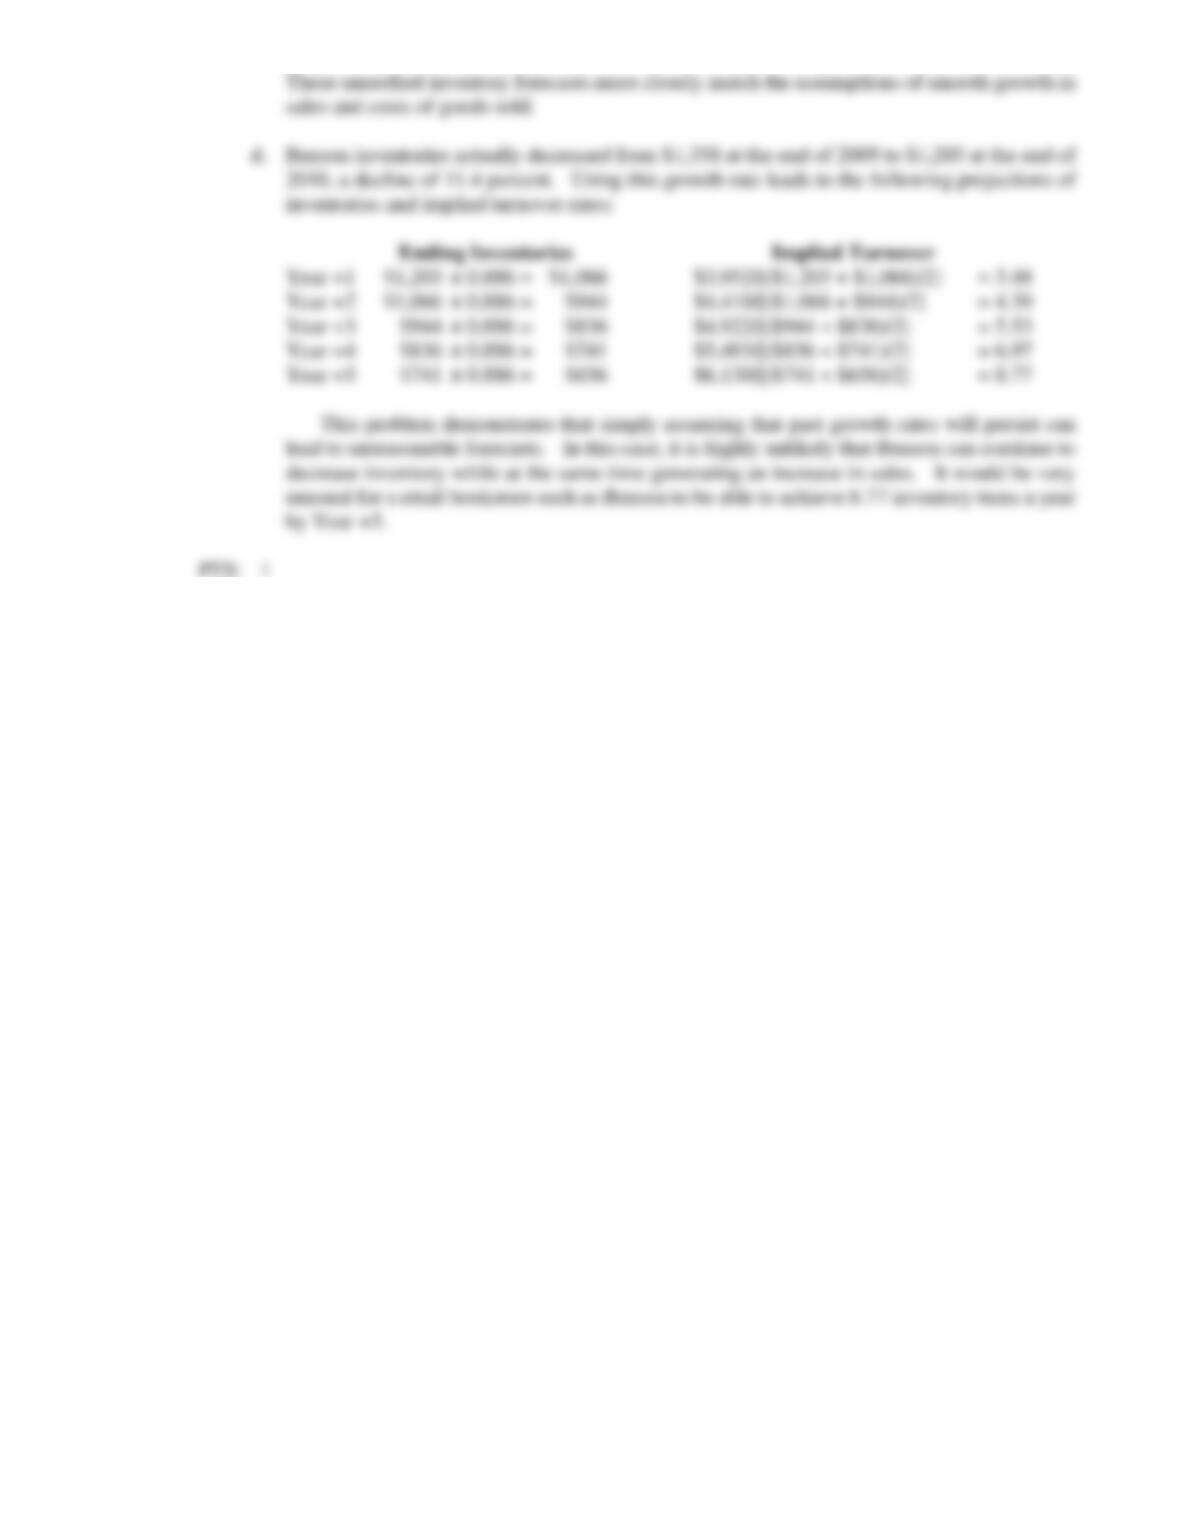
d. Now suppose that instead of following the smoothing approach in Part c, you used the rate of growth
in inventory during 2010 to project future inventory balances at the end of Year +1 through Year +5. Use
these projections to compute the implied inventory turnover rates. Does this pattern of growth and
efficiency in inventory for Benson seem reasonable? Explain.