1.4 Fitting Models to Data
41
c.
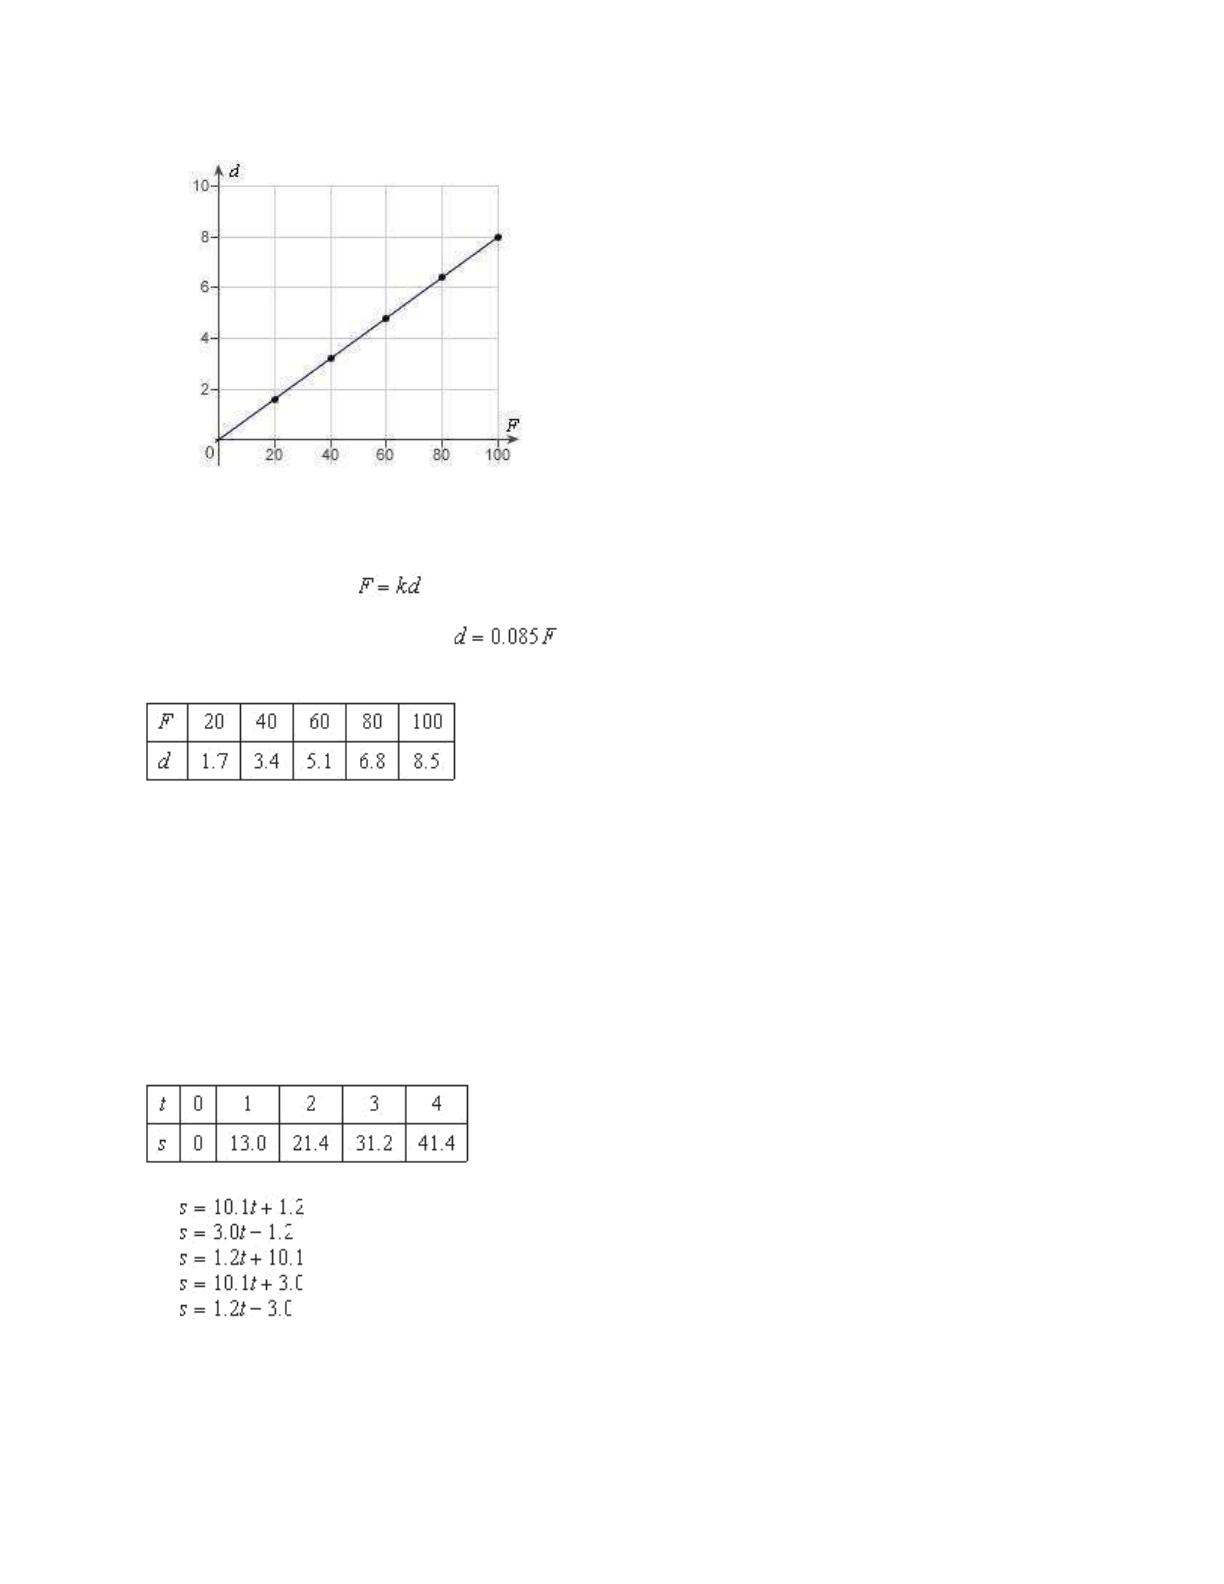
____ 7. Hooke’s Law states that the force F required to compress or stretch a spring (within its
elastic limits) is proportional to the distance d that the spring is compressed or stretched from its
original length. That is,
where k is a measure of the stiffness of the spring and is called the
spring constant. The table shows the elongation d in centimeters of a spring when a force of F
newtons is applied. Use the model
to estimate the elongation of the spring when a force
of 55 newtons is applied. Round your answer to two decimal places.
8.08 cm
6.38 cm
4.68 cm
2.98 cm
9.78 cm
____ 8. In an experiment, students measured the speed s (in meters per second) of a falling object t
seconds after it was released. The results are shown in the table below. Use the regression
capabilities of a graphing utility to find a linear model for the data. Round all numerical values in
your answer to one decimal place.
a.
b.
c.
d.
e.
42
Chapter 1: Preparation for Calculus
____
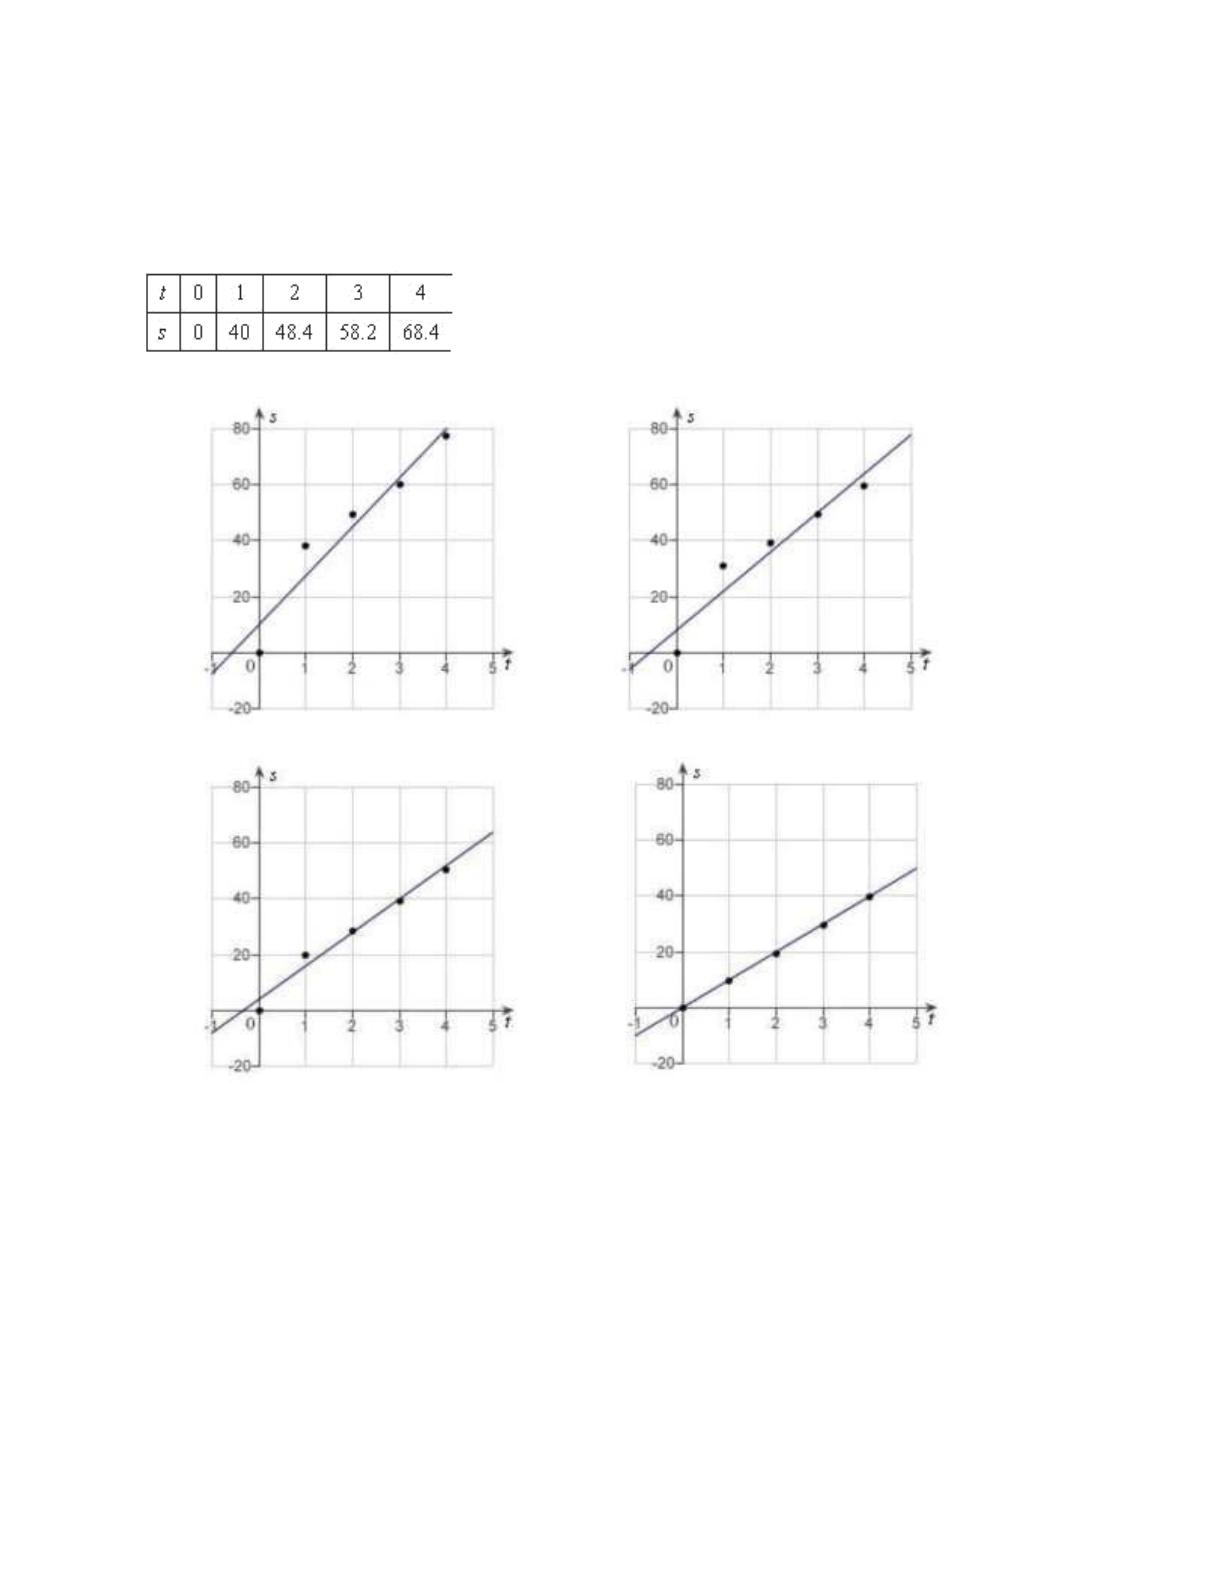
9.
In an experiment, students measured the speed s (in meters per second) of a falling
object t seconds after it was released. The results are shown in the table below. Use the
regression capabilities of a graphing utility to find a linear model for the data. Round all
numerical values in your answer to one decimal place.
a. d.
b. e.
1.4 Fitting Models to Data
43
c.
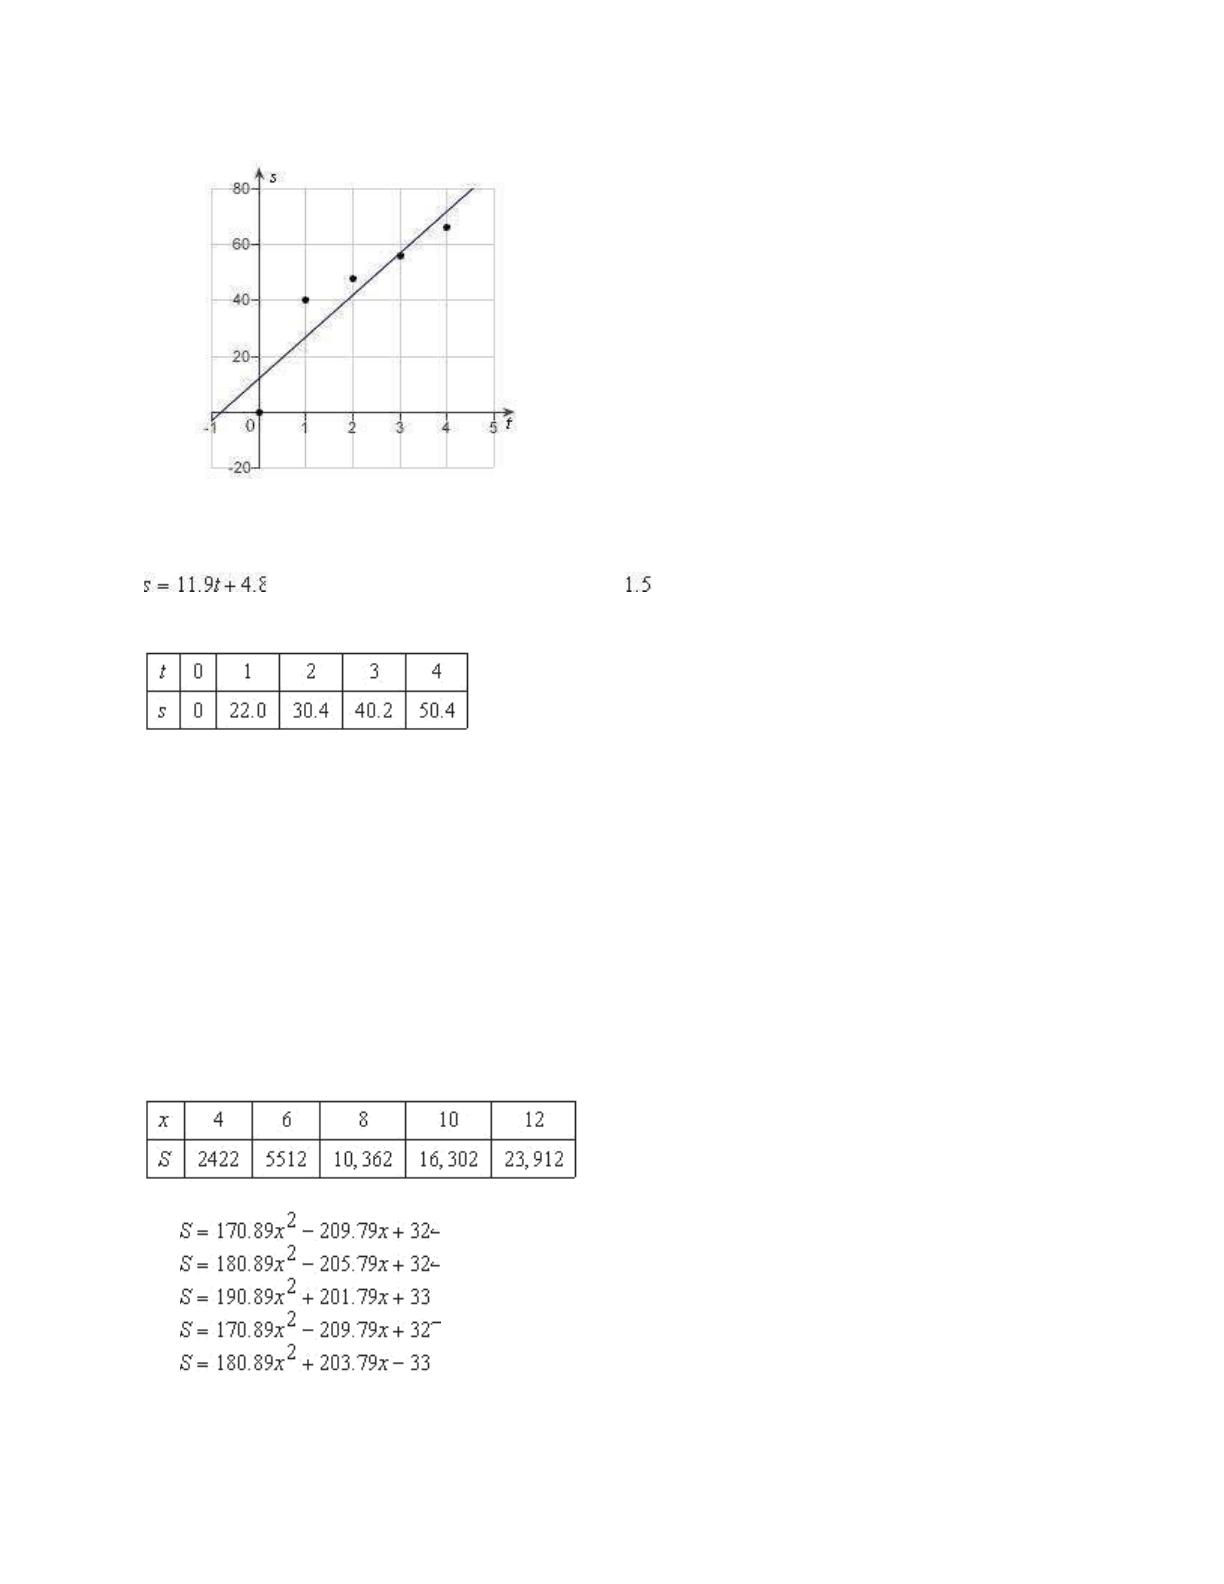
____ 10. In an experiment, students measured the speed s (in meters per second) of a falling
object t seconds after it was released. The results are shown in the table below. Use the model
to estimate the speed of the object after seconds. Round your answer to two
decimal places.
21.05 meters/second
20.95 meters/second
24.25 meters/second
23.55 meters/second
22.65 meters/second
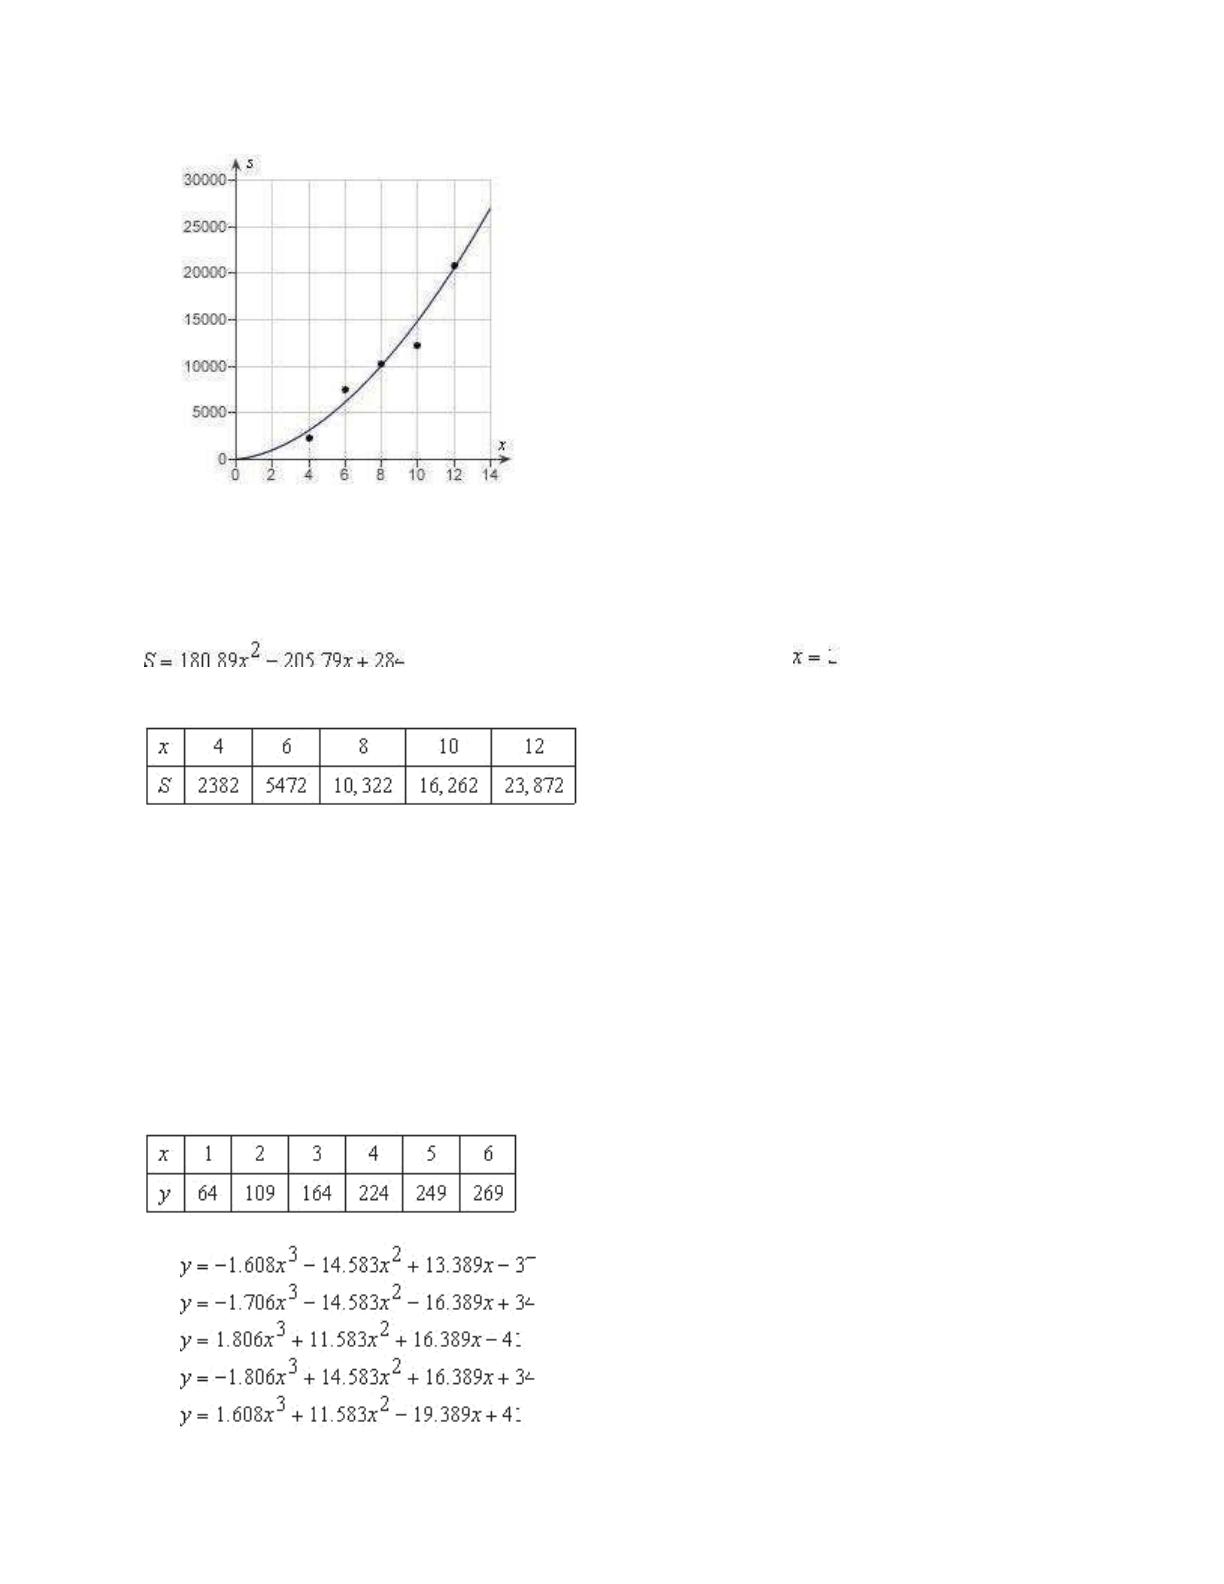
____ 11. Students in a lab measured the breaking strength S (in pounds) of wood 2 inches thick, x
inches high, and 12 inches long. The results are shown in the table below. Use the regression
capabilities of a graphing utility to fit a quadratic model to the data. Round the numerical values in your
answer to two decimal places, where applicable.
a.
b.
c.
d.
e.
44 Chapter 1: Preparation for Calculus
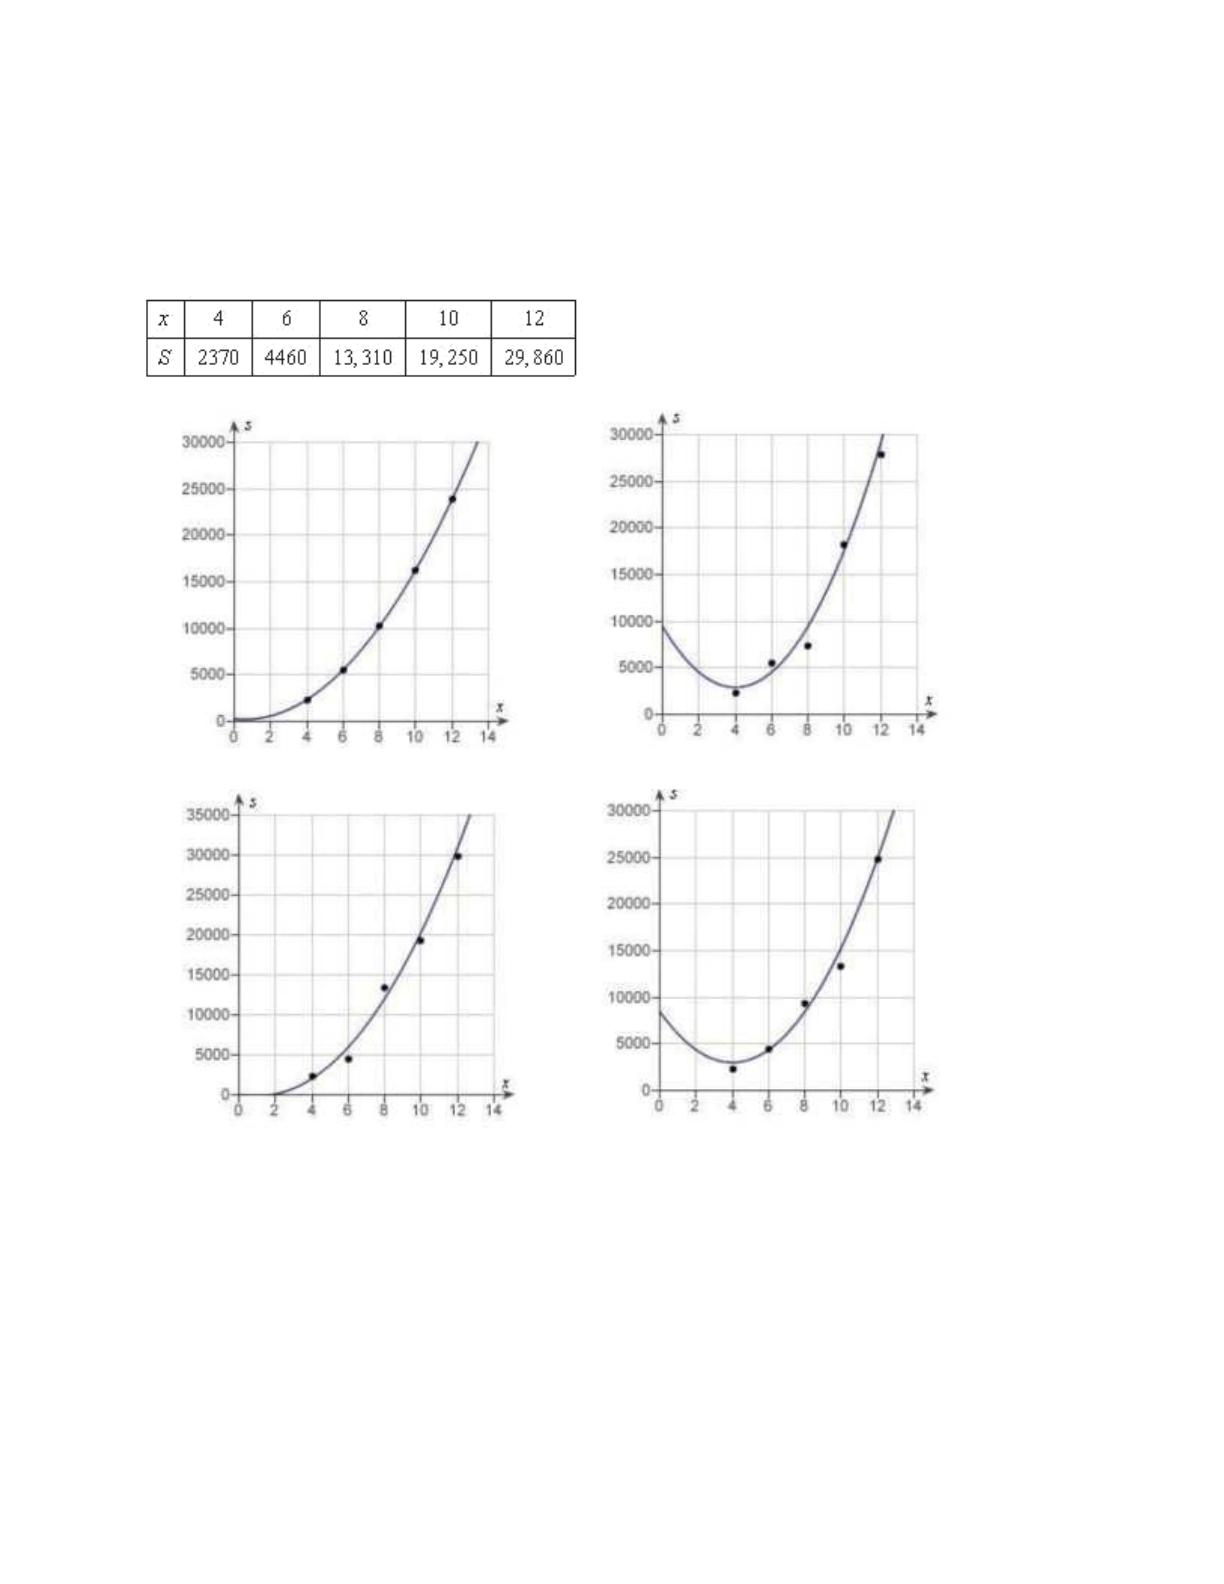
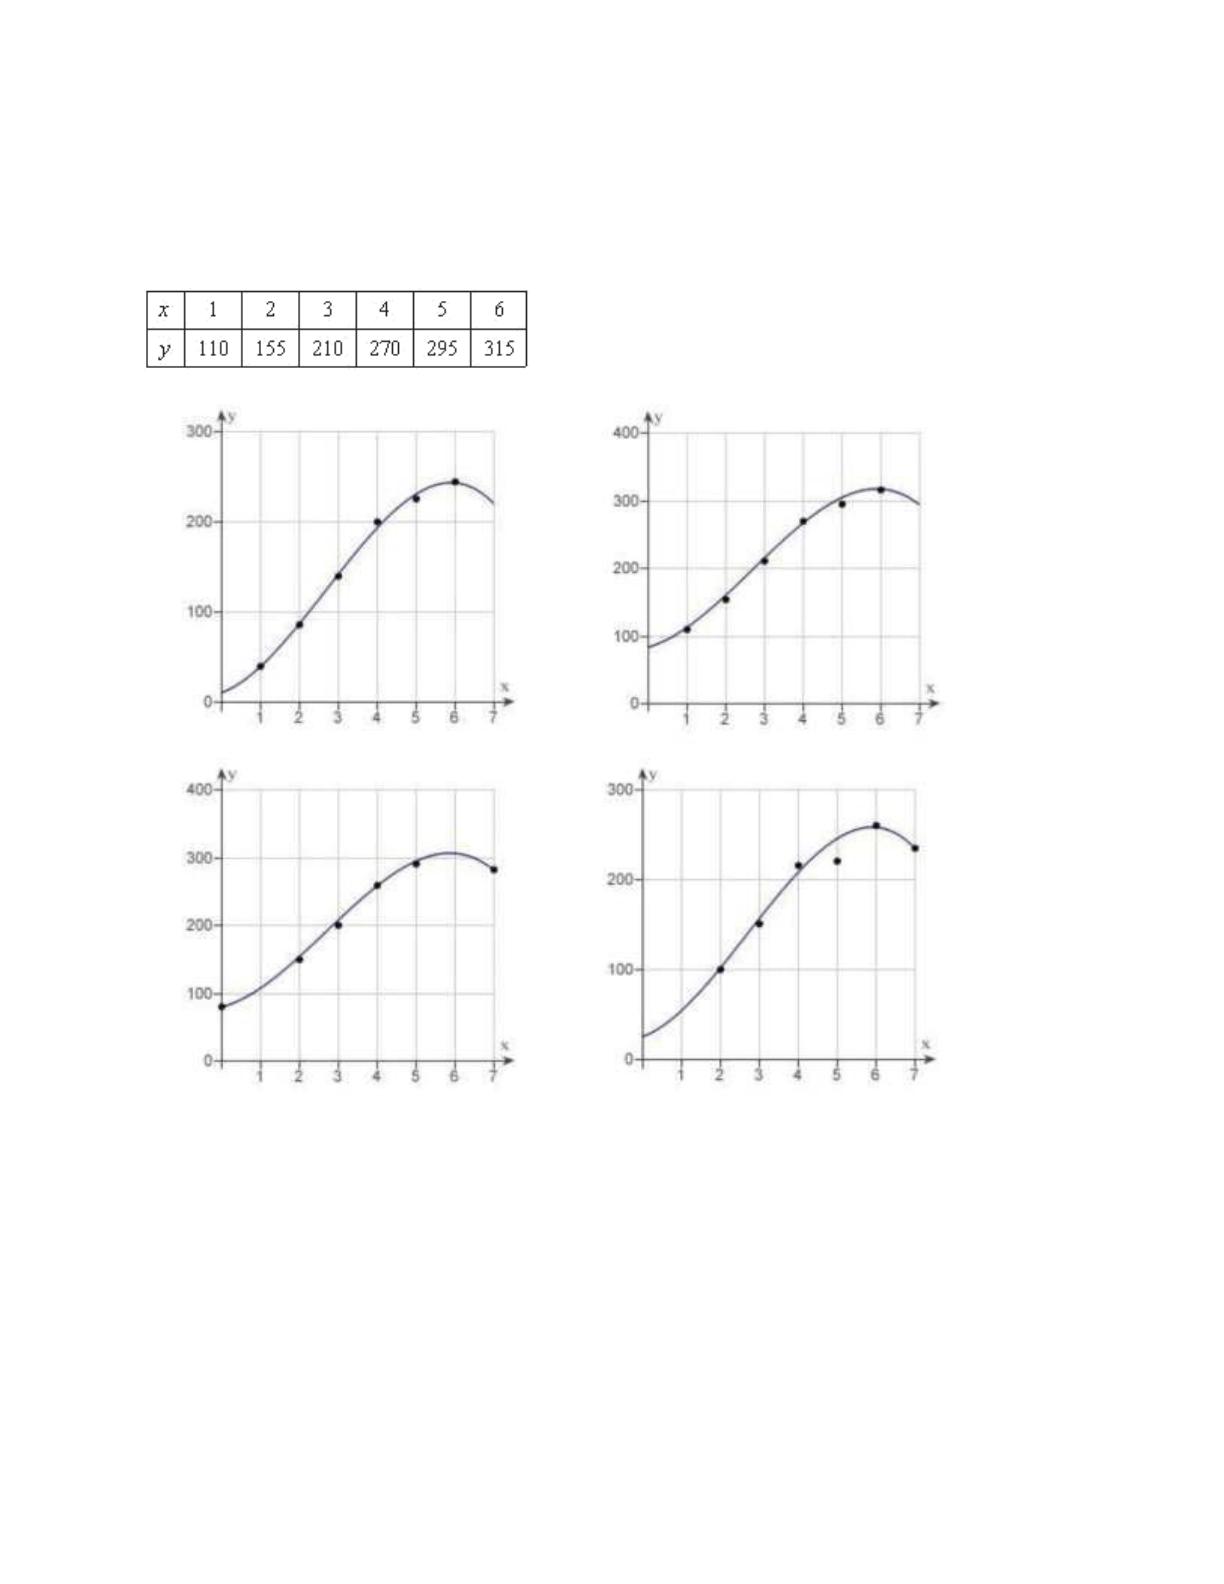
____ 12. Students in a lab measured the breaking strength S (in pounds) of wood 2 inches thick,
x inches high, and 12 inches long. The results are shown in the table below. Use a graphing
utility to plot the data and graph the quadratic model.
a. d.
b. e.
1.4 Fitting Models to Data
45
c.
____ 13. Students in a lab measured the breaking strength S (in pounds) of wood 2 inches thick,
x inches high, and 12 inches long. The results are shown in the table below. Use the model
to approximate the breaking strength when . Round your answer
to two decimal places.
595.98 pounds
390.19 pounds
957.76 pounds
801.77 pounds
751.97 pounds
____ 14. A V8 car engine is coupled to a dynamometer and the horsepower y is measured at
different engine speeds x (in thousands of revolutions per minute) . The results are shown in the
table below. Use the regression capabilities of a graphing utility to find a cubic model for the data.
Round the numerical values in your answer to three decimal places, where applicable.
a.
b.
c.
d.
e.
46 Chapter 1: Preparation for Calculus
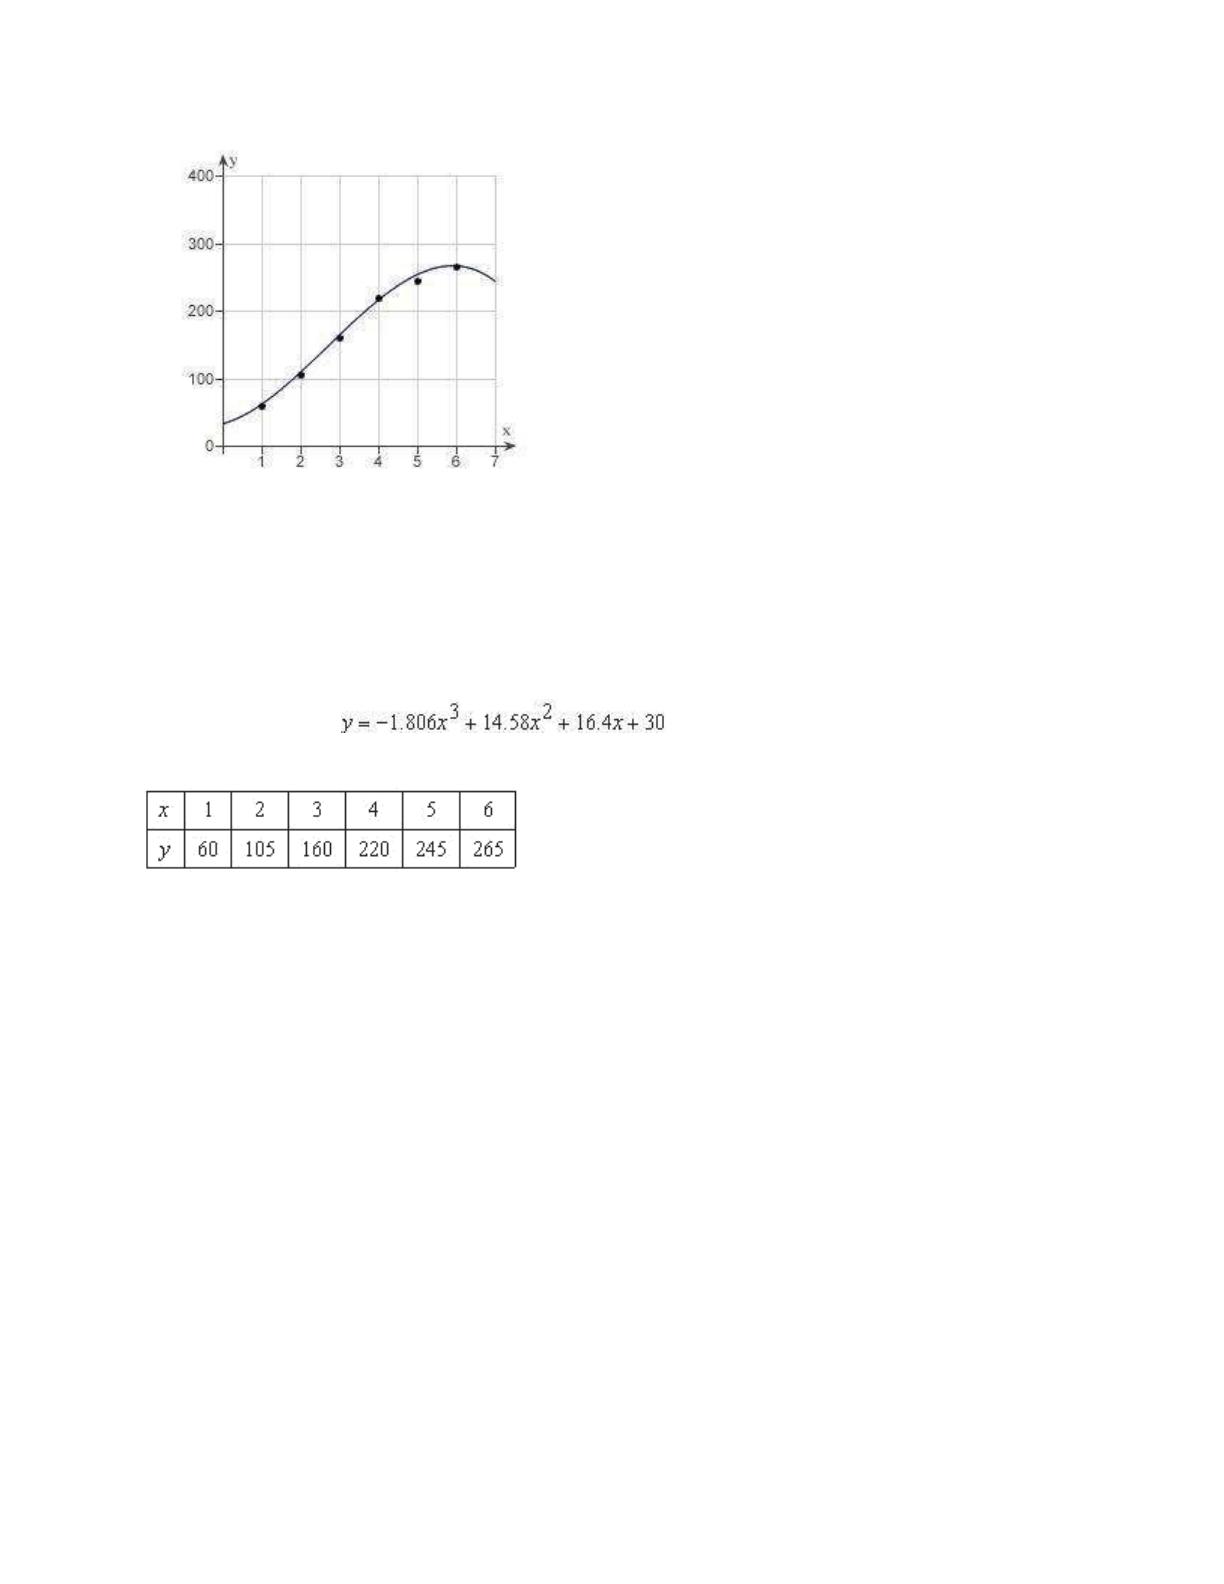
____ 15. A V8 car engine is coupled to a dynamometer and the horsepower y is measured at
different engine speeds x (in thousands of revolutions per minute). The results are shown in the table
below. Use a graphing utility to plot the data and graph the cubic model.
a. d.
b. e.
1.4 Fitting Models to Data
47
c.
____ 16. A V8 car engine is coupled to a dynamometer and the horsepower y is measured at
different engine speeds x (in thousands of revolutions per minute). The results are shown in the table
below. Use the model to approximate the horsepower when the
engine is running at 5500 revolutions per minute. Round your answer to two decimal places.
260.77 hp
262.73 hp
262.36 hp
261.38 hp
261.91 hp
48 Chapter 1: Preparation for Calculus
1.4 Fitting Models to Data
Answer Section
1.5 Inverse Functions
49
1.5 Inverse Functions
Multiple Choice
Identify the choice that best completes the statement or answers the question.
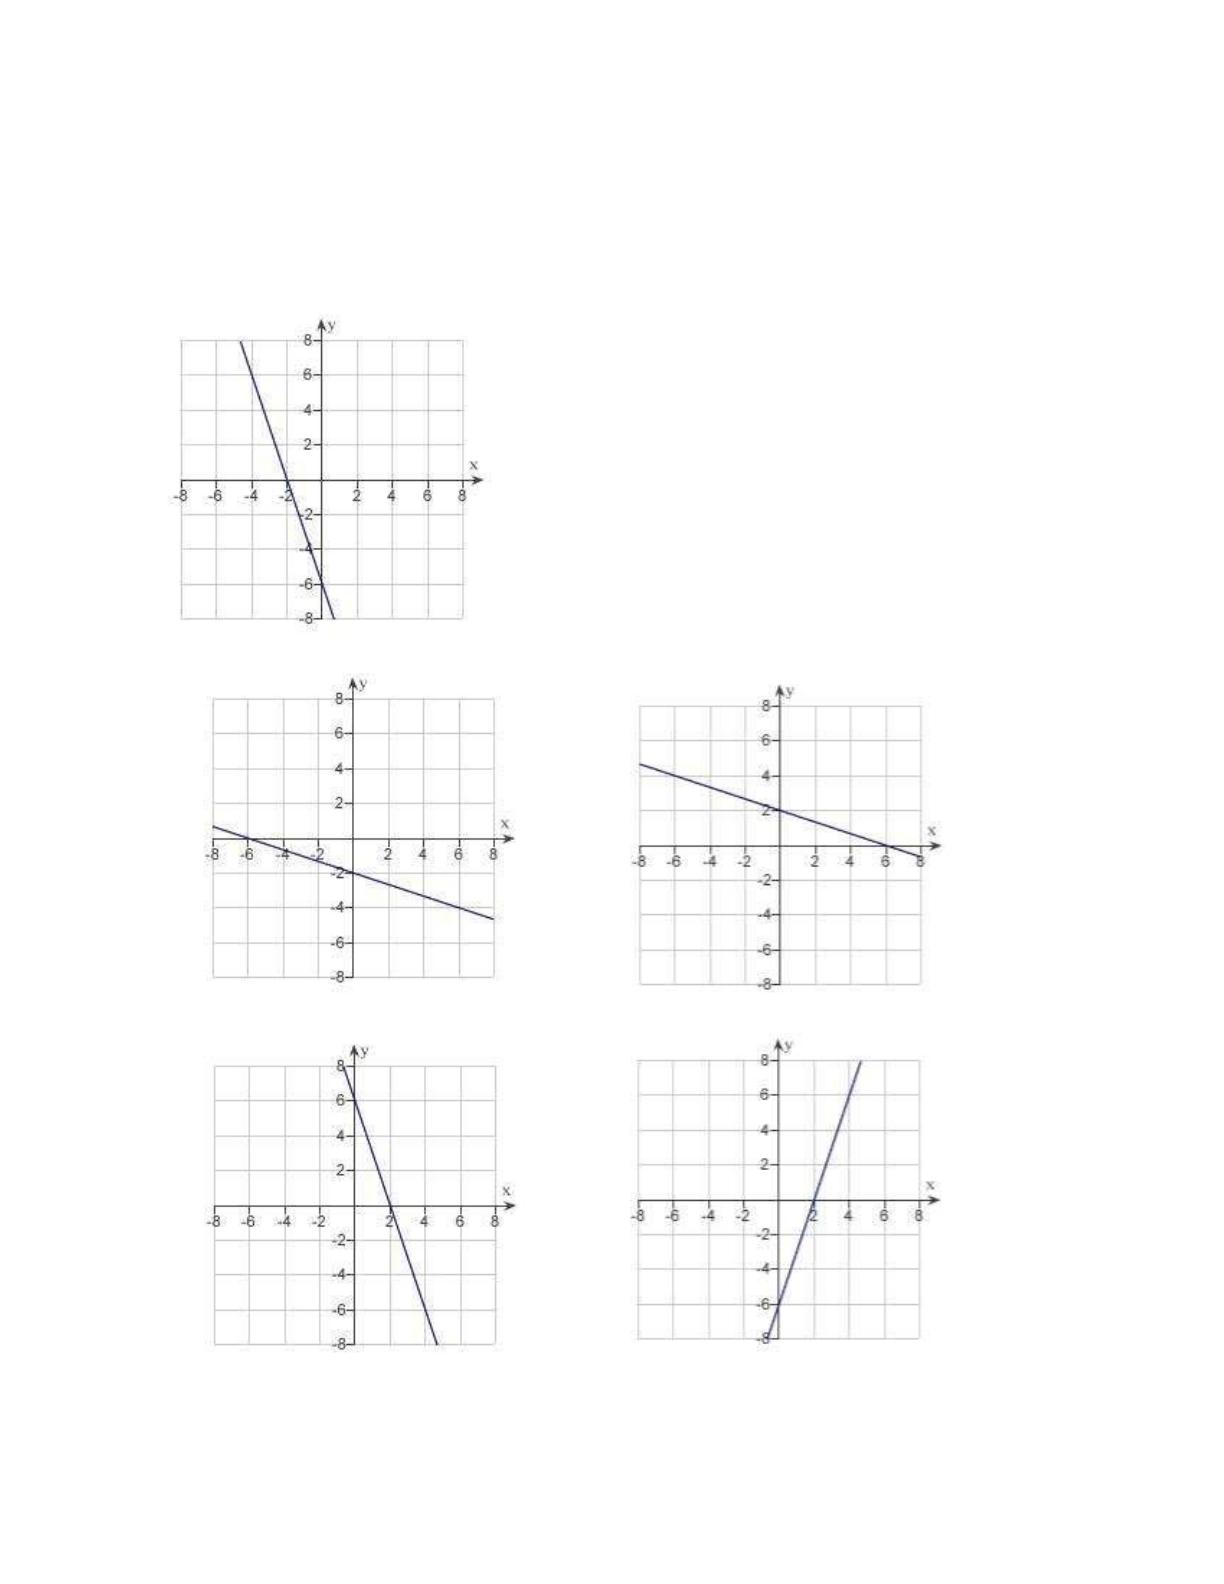
____ 1. Match the graph of the function given below with the graph of its inverse function.
a. d.
b. e.
50 Chapter 1: Preparation for Calculus c.
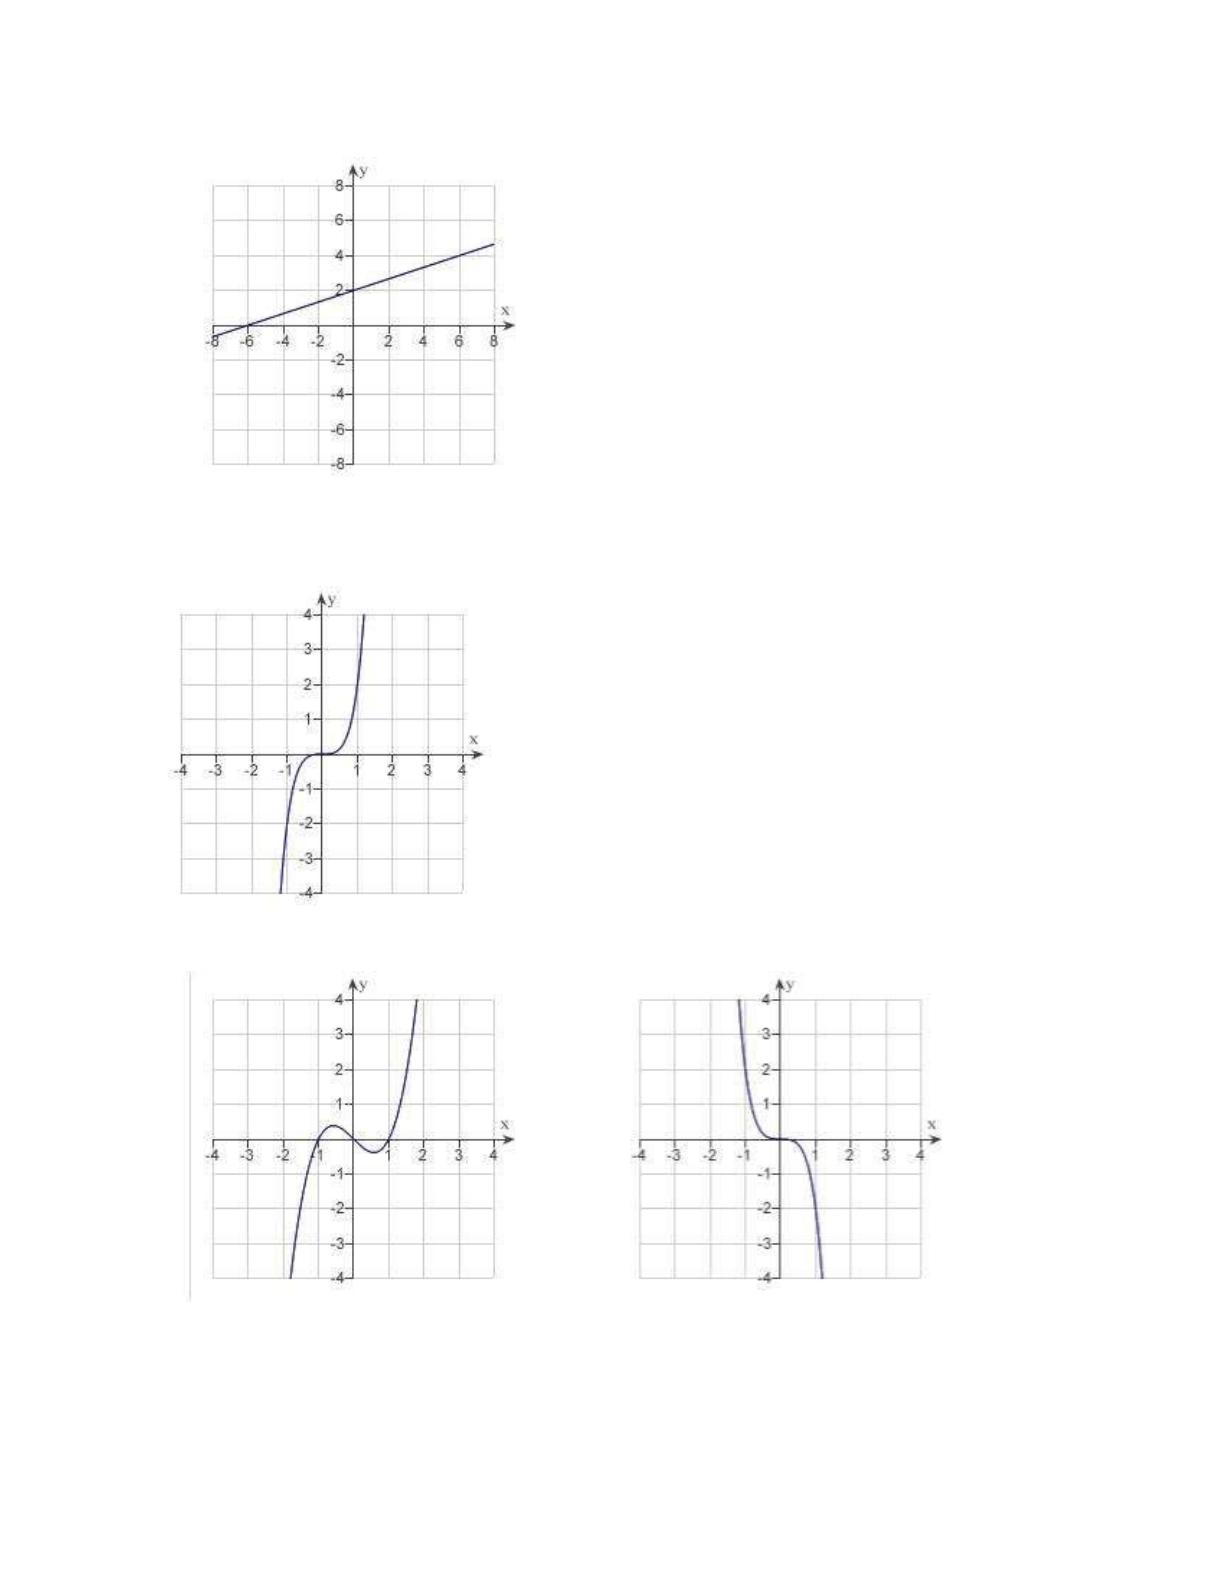
____ 2. Match the graph of the function given below with the graph of its inverse function.
a. d.
1.5 Inverse Functions
51
b. e.
c.
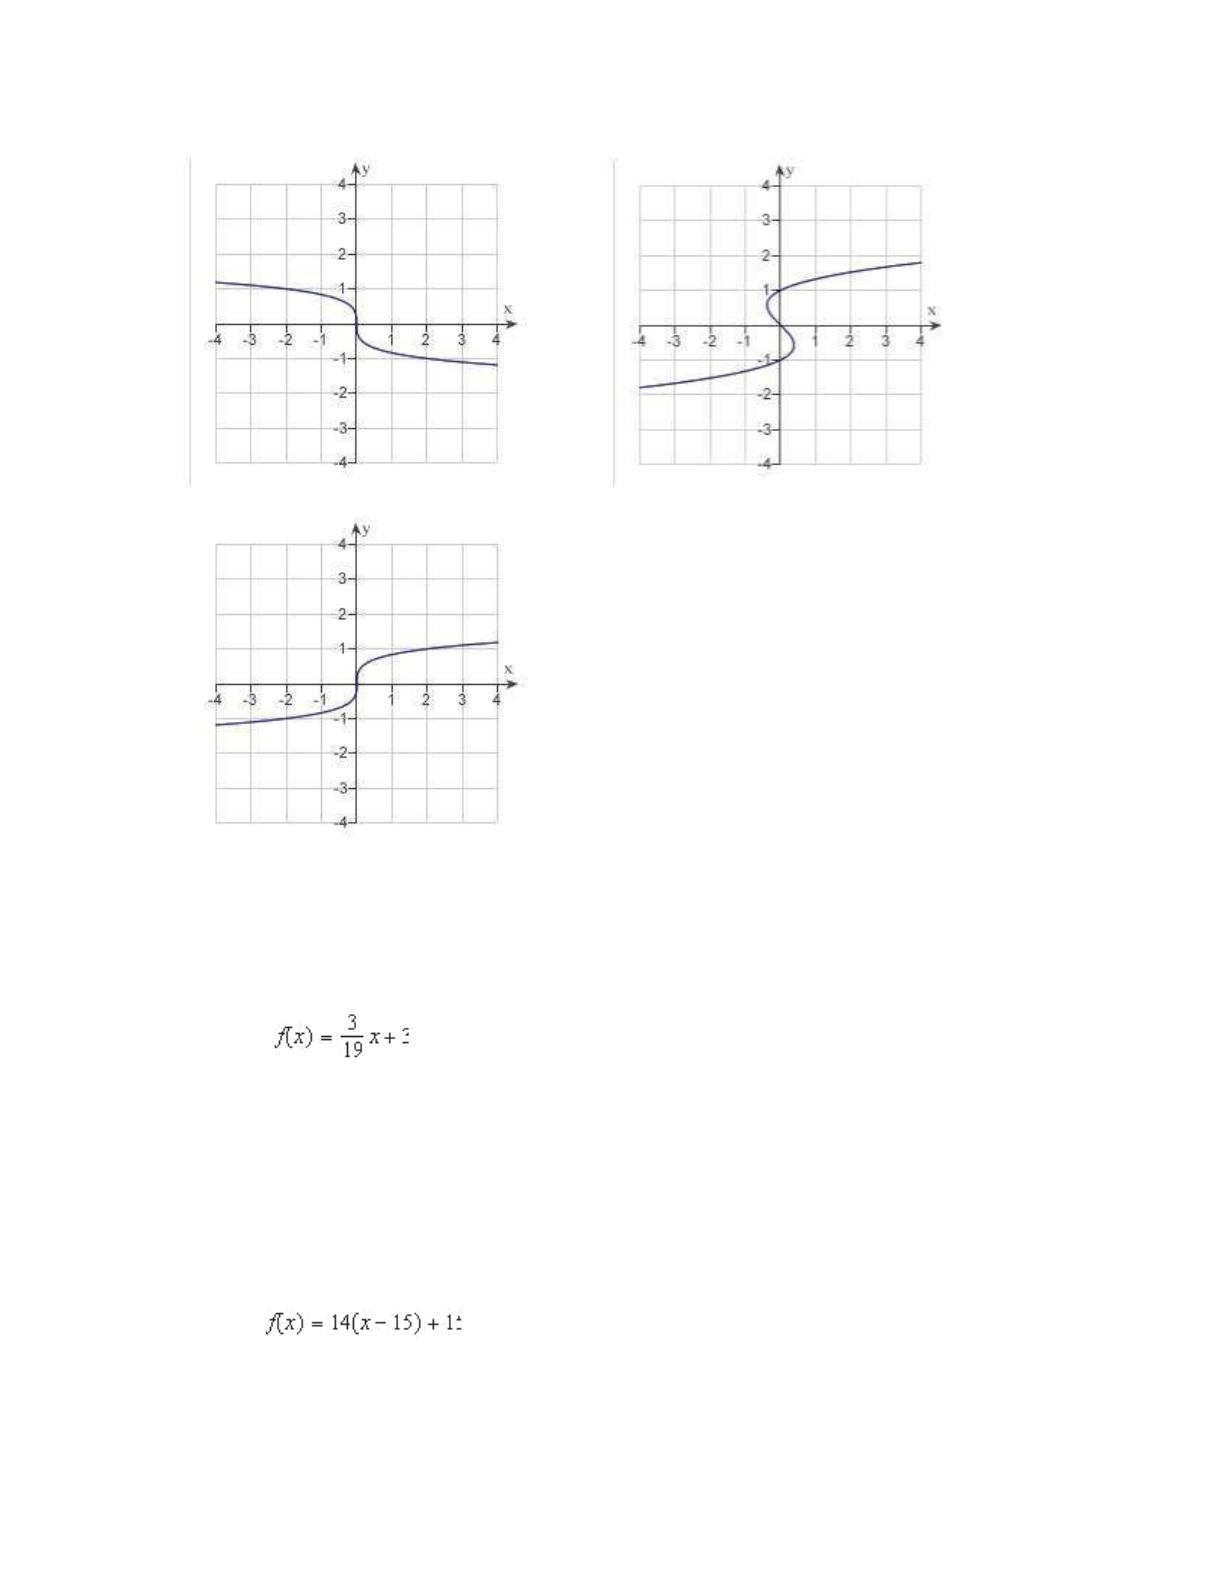
____
3.
Use the Horizontal Line Test to determine whether the following statement is true or
false.
The function
is one-to-one on its entire domain and therefore has an inverse
function.
a.
false
b.
true
____
4.
Use the Horizontal Line Test to determine whether the following statement is true or
false.
The function
is one-to-one on its entire domain and therefore has an inverse
function.
true
false
52 Chapter 1: Preparation for Calculus
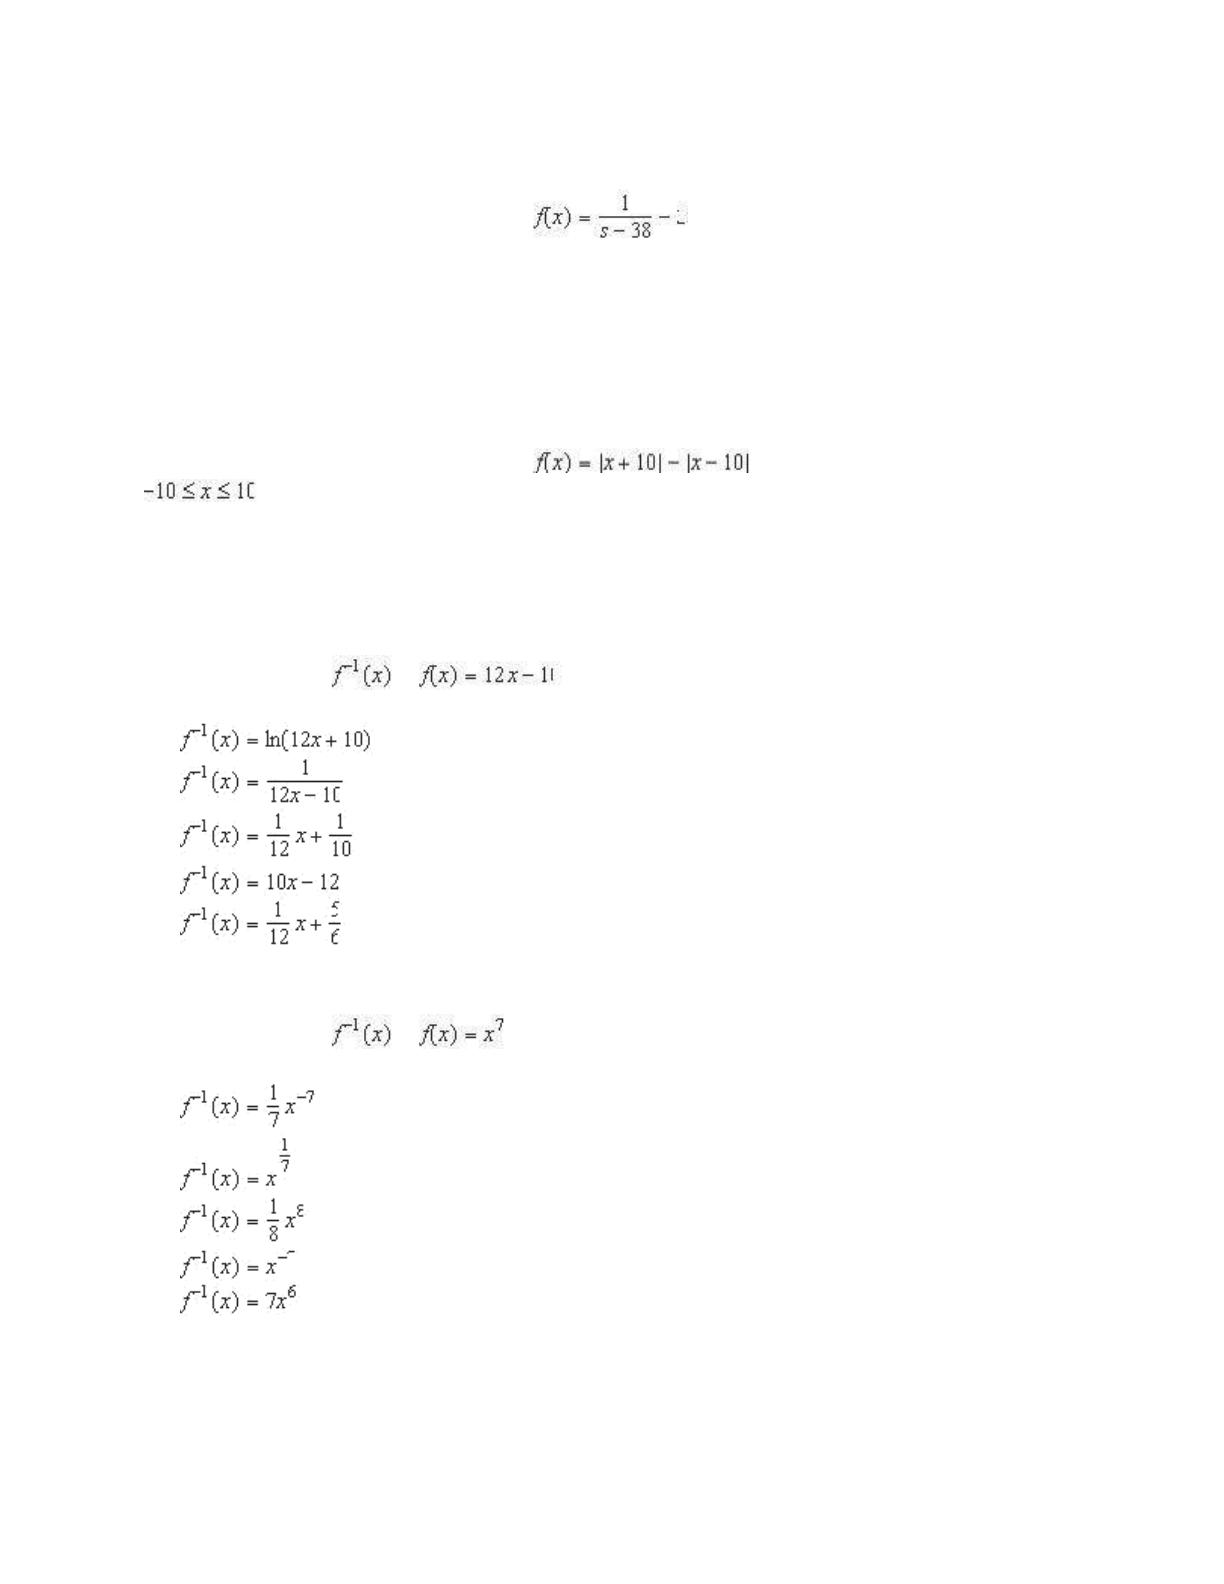
____ 5. True or False: The function is one-to-one on its entire domain.
ЀĀ Ȁ ⸀Ā Ā Ā Ā
alse
ЀĀ Ȁ ⸀Ā Ā Ā Ā
rue
____ 6. True or False: The function is one-to-one on the domain
.
false
true
____ 7. Find if .
a.
b.
c.
d.
e.
____ 8. Find if .
a.
b.
c.
d.
e.