Unlock document.
This document is partially blurred.
Unlock all pages and 1 million more documents.
Get Access
88.
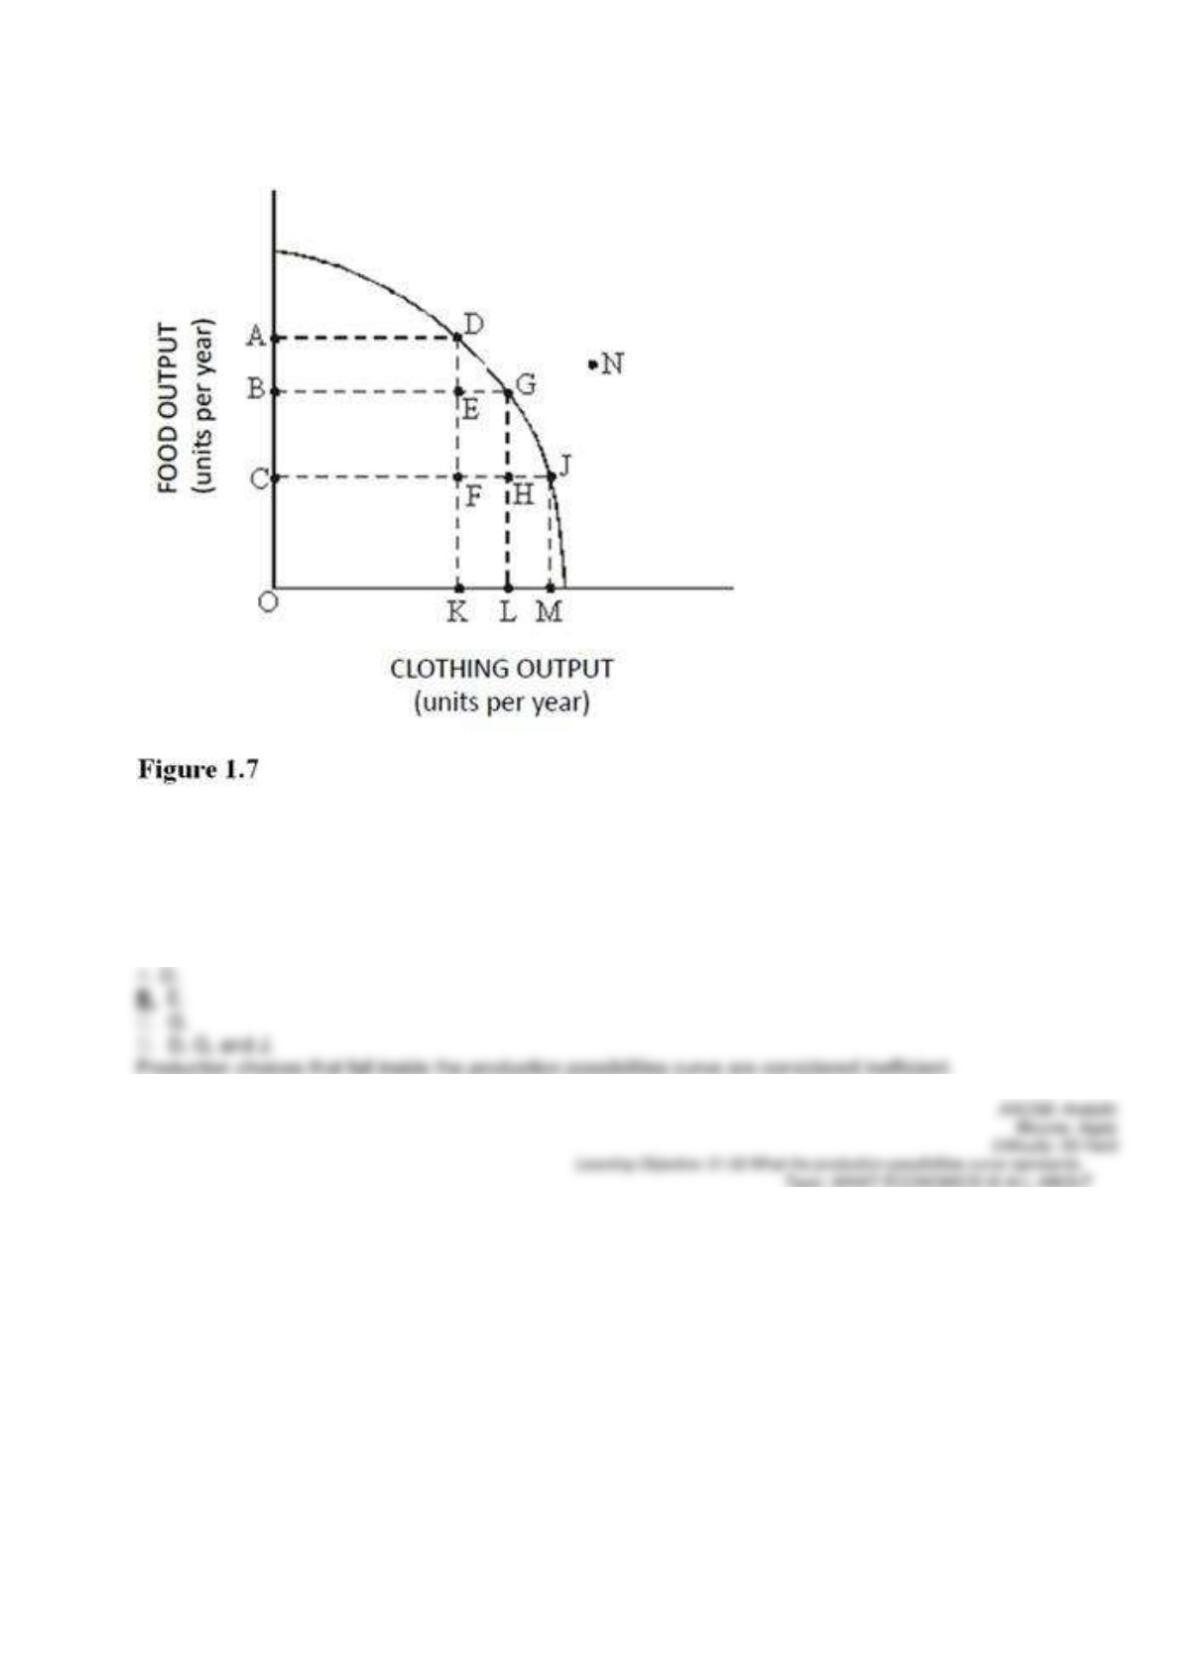
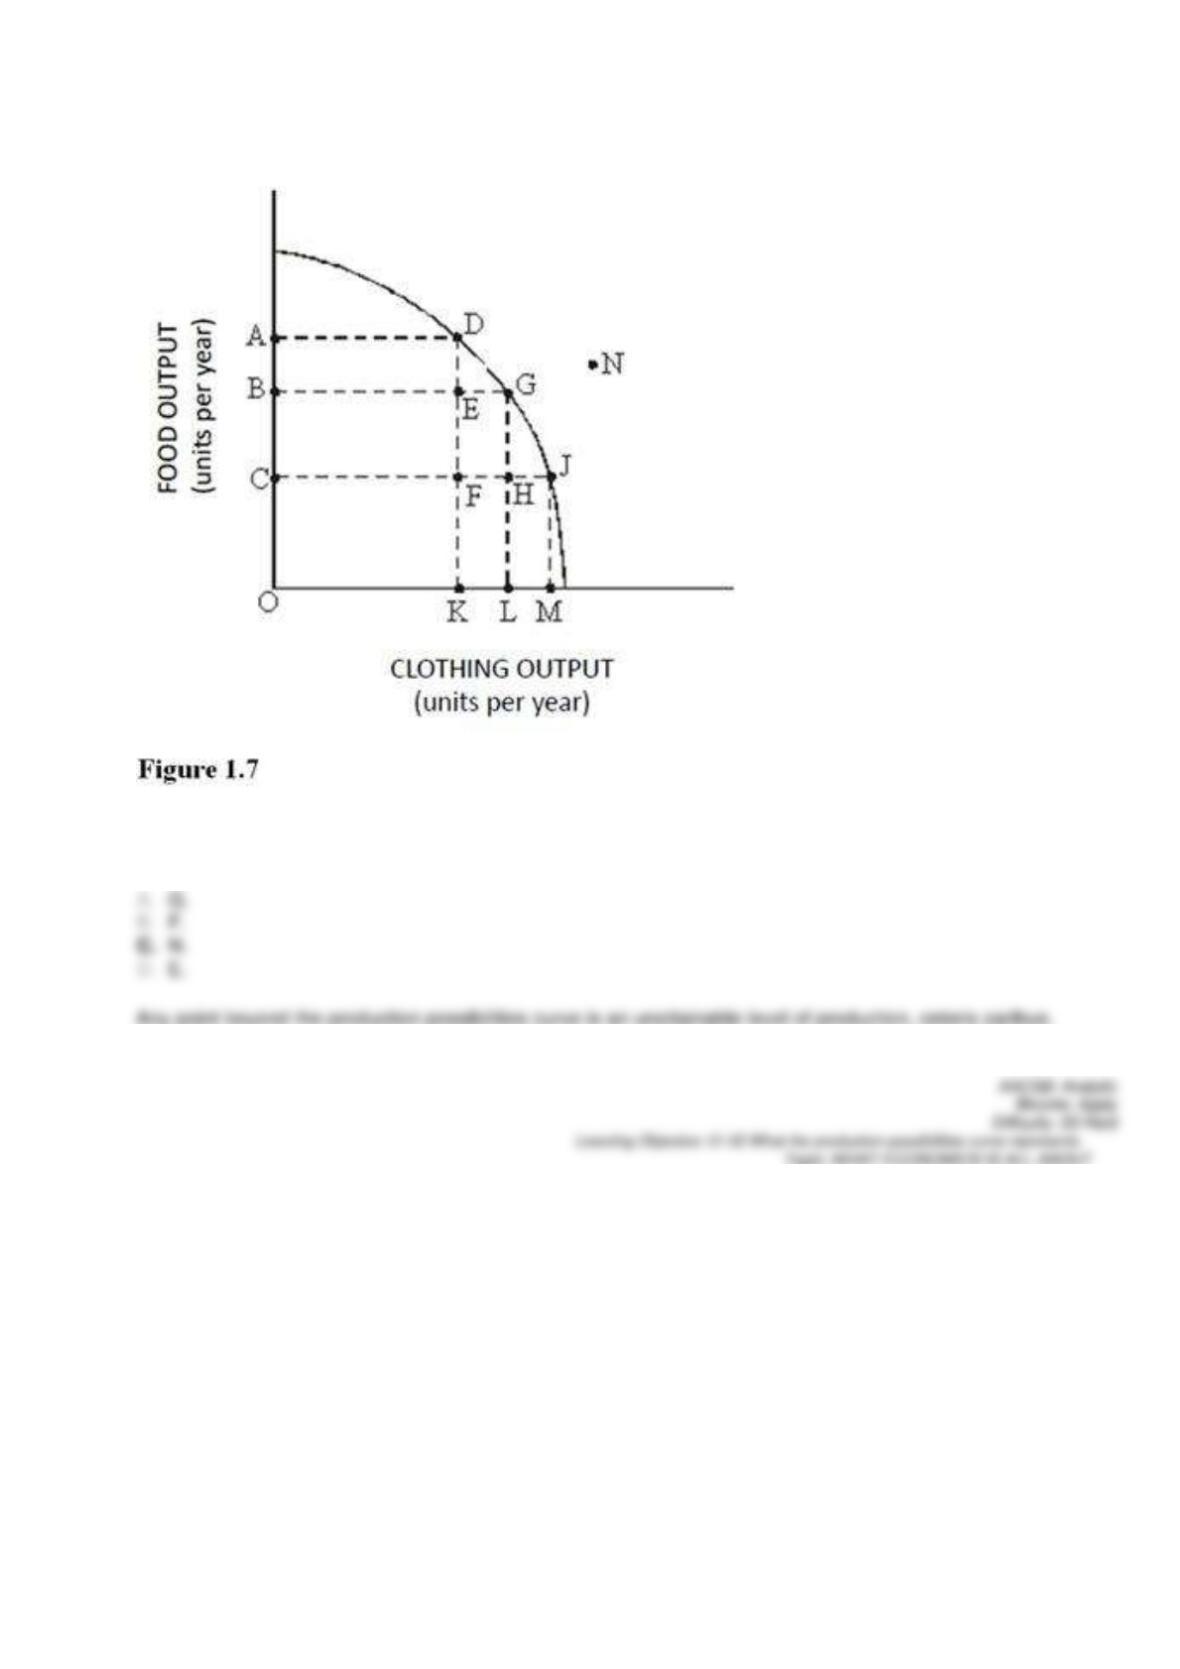
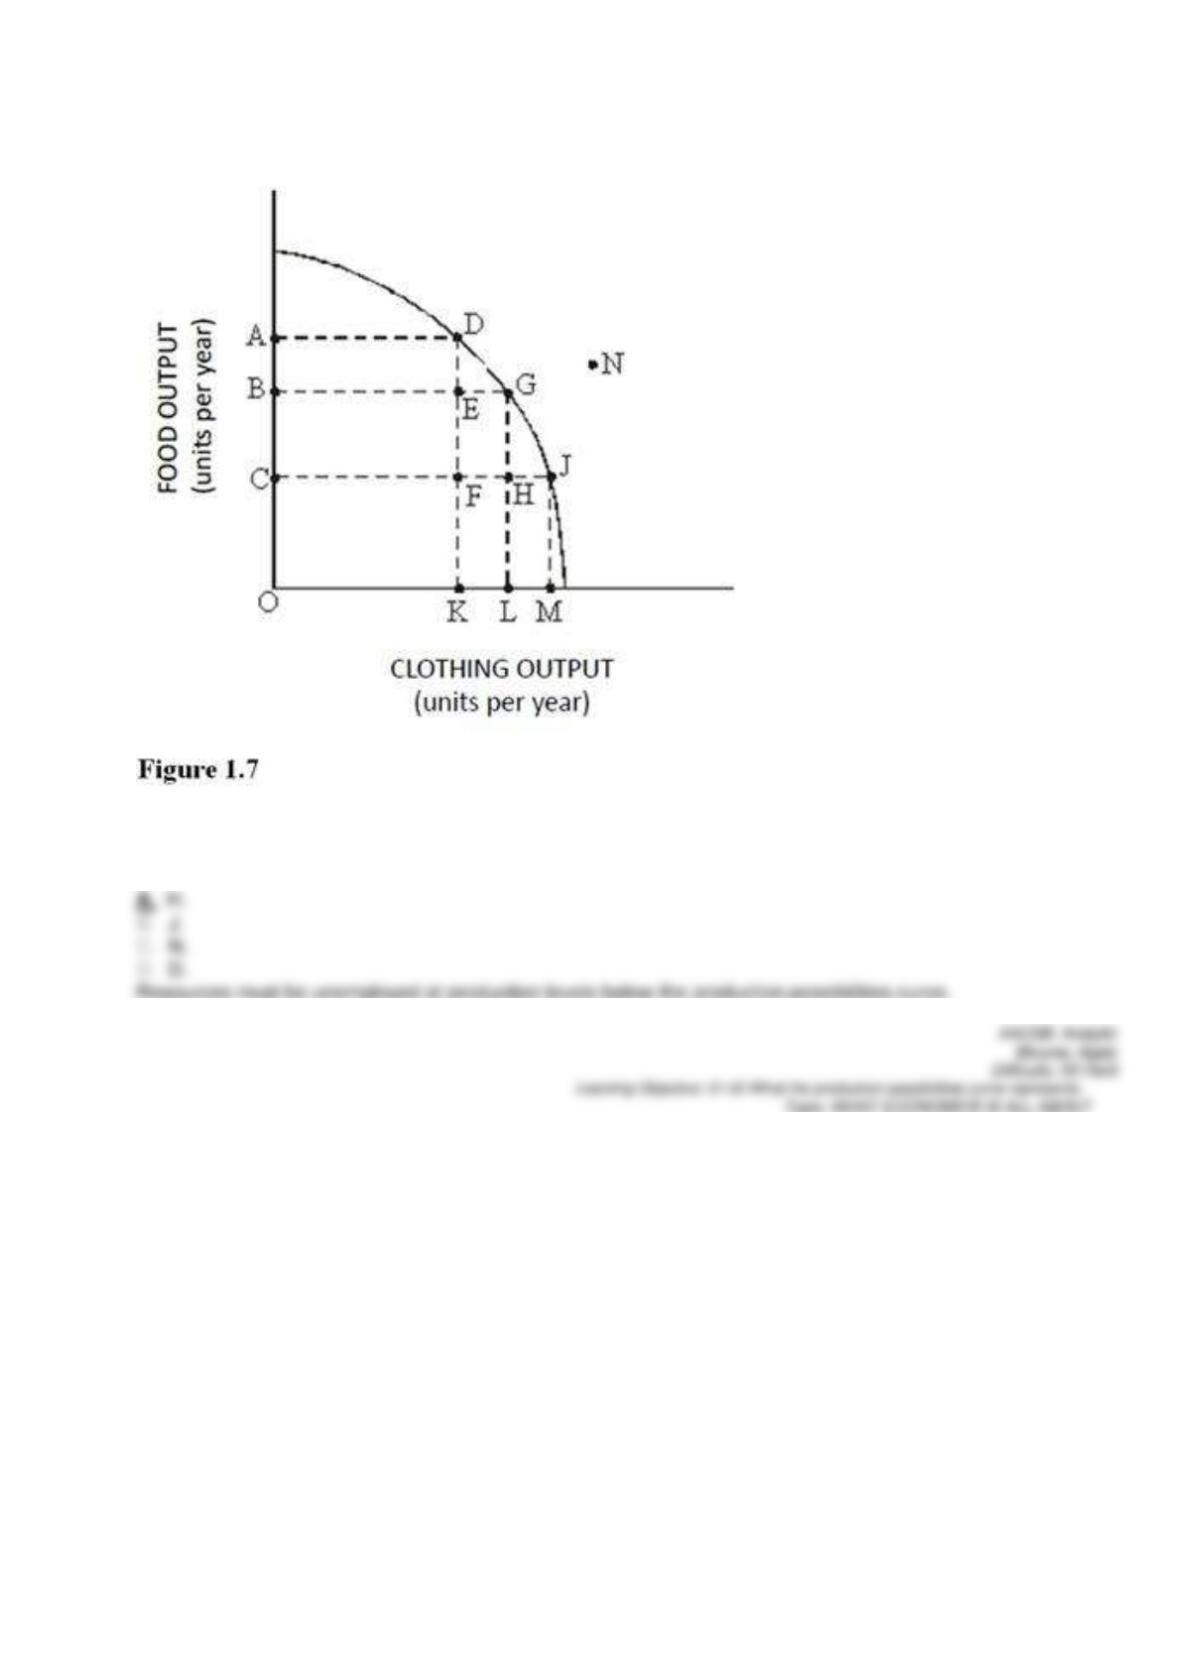
Refer to Figure 1.7. Which of the following points are considered to be inefficient?
89.
Refer to Figure 1.7. Which of the following points are unattainable, ceteris paribus?
90.
Refer to Figure 1.7. Which of the following points show unemployment of resources above the normal rate?
91.
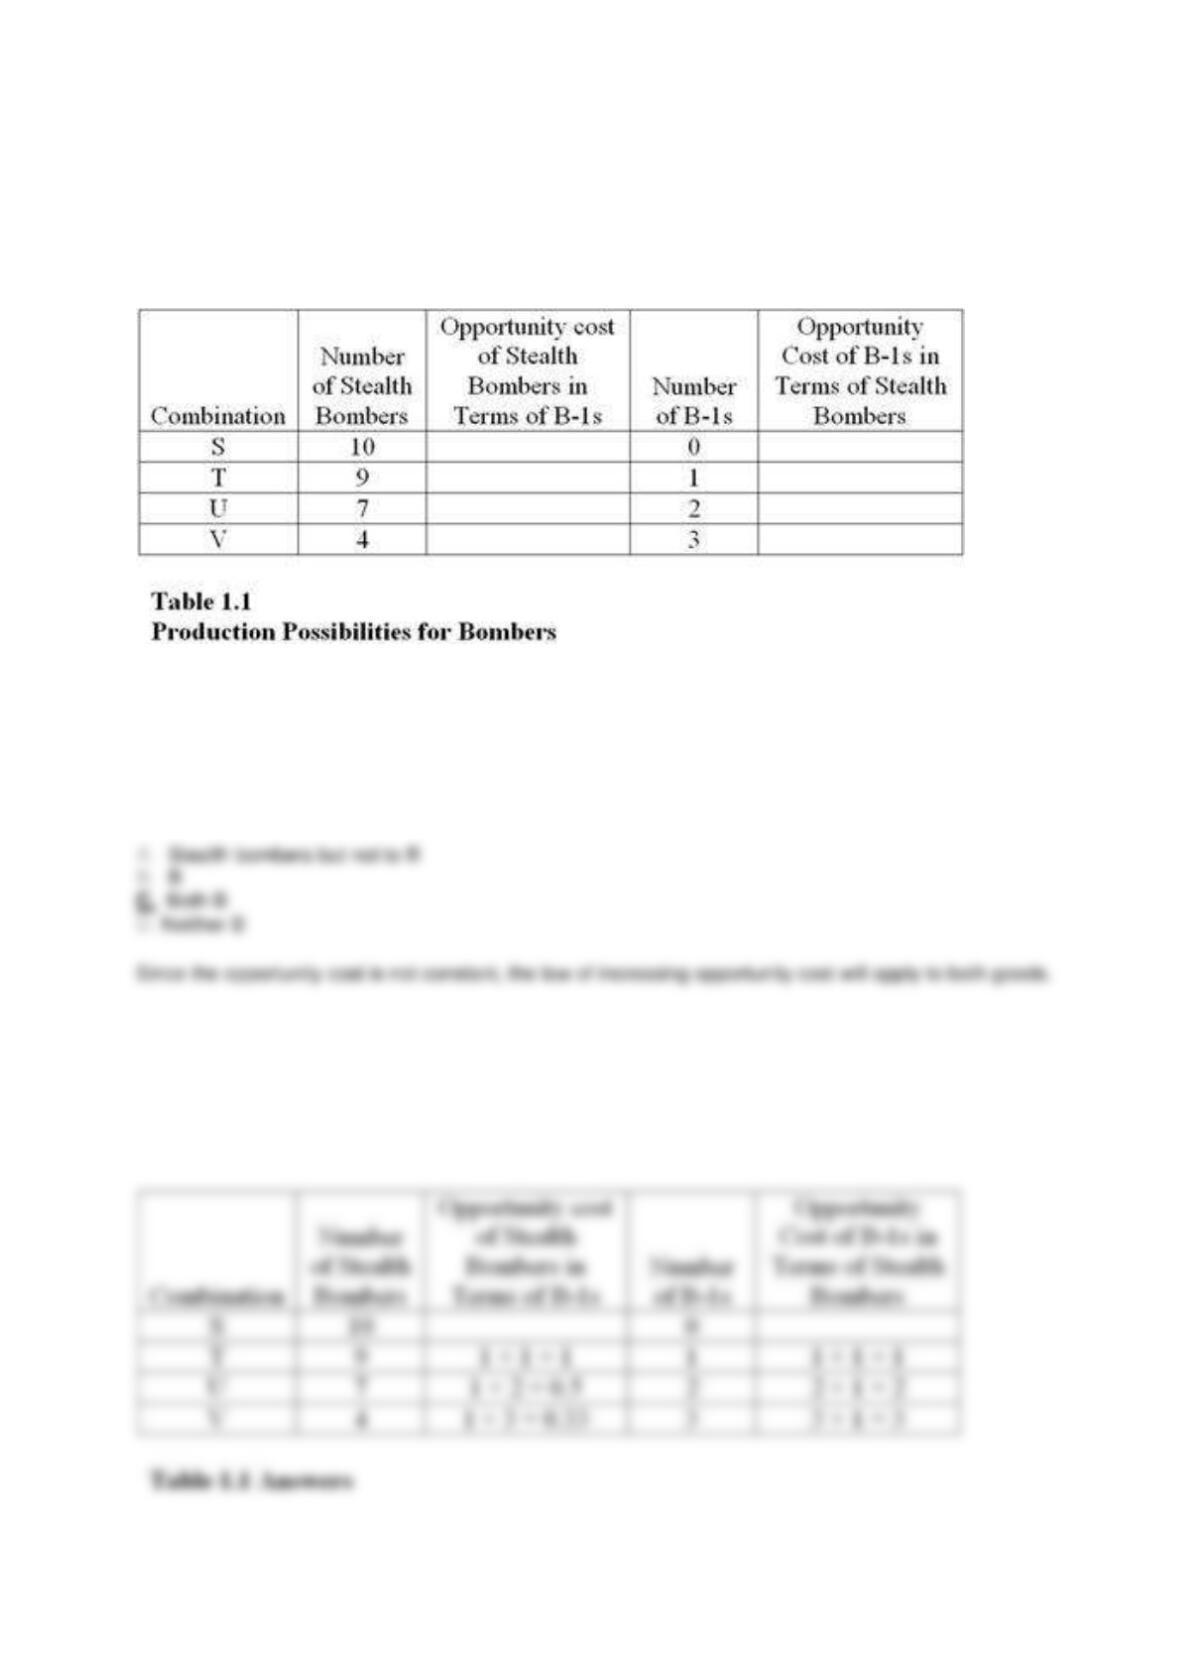
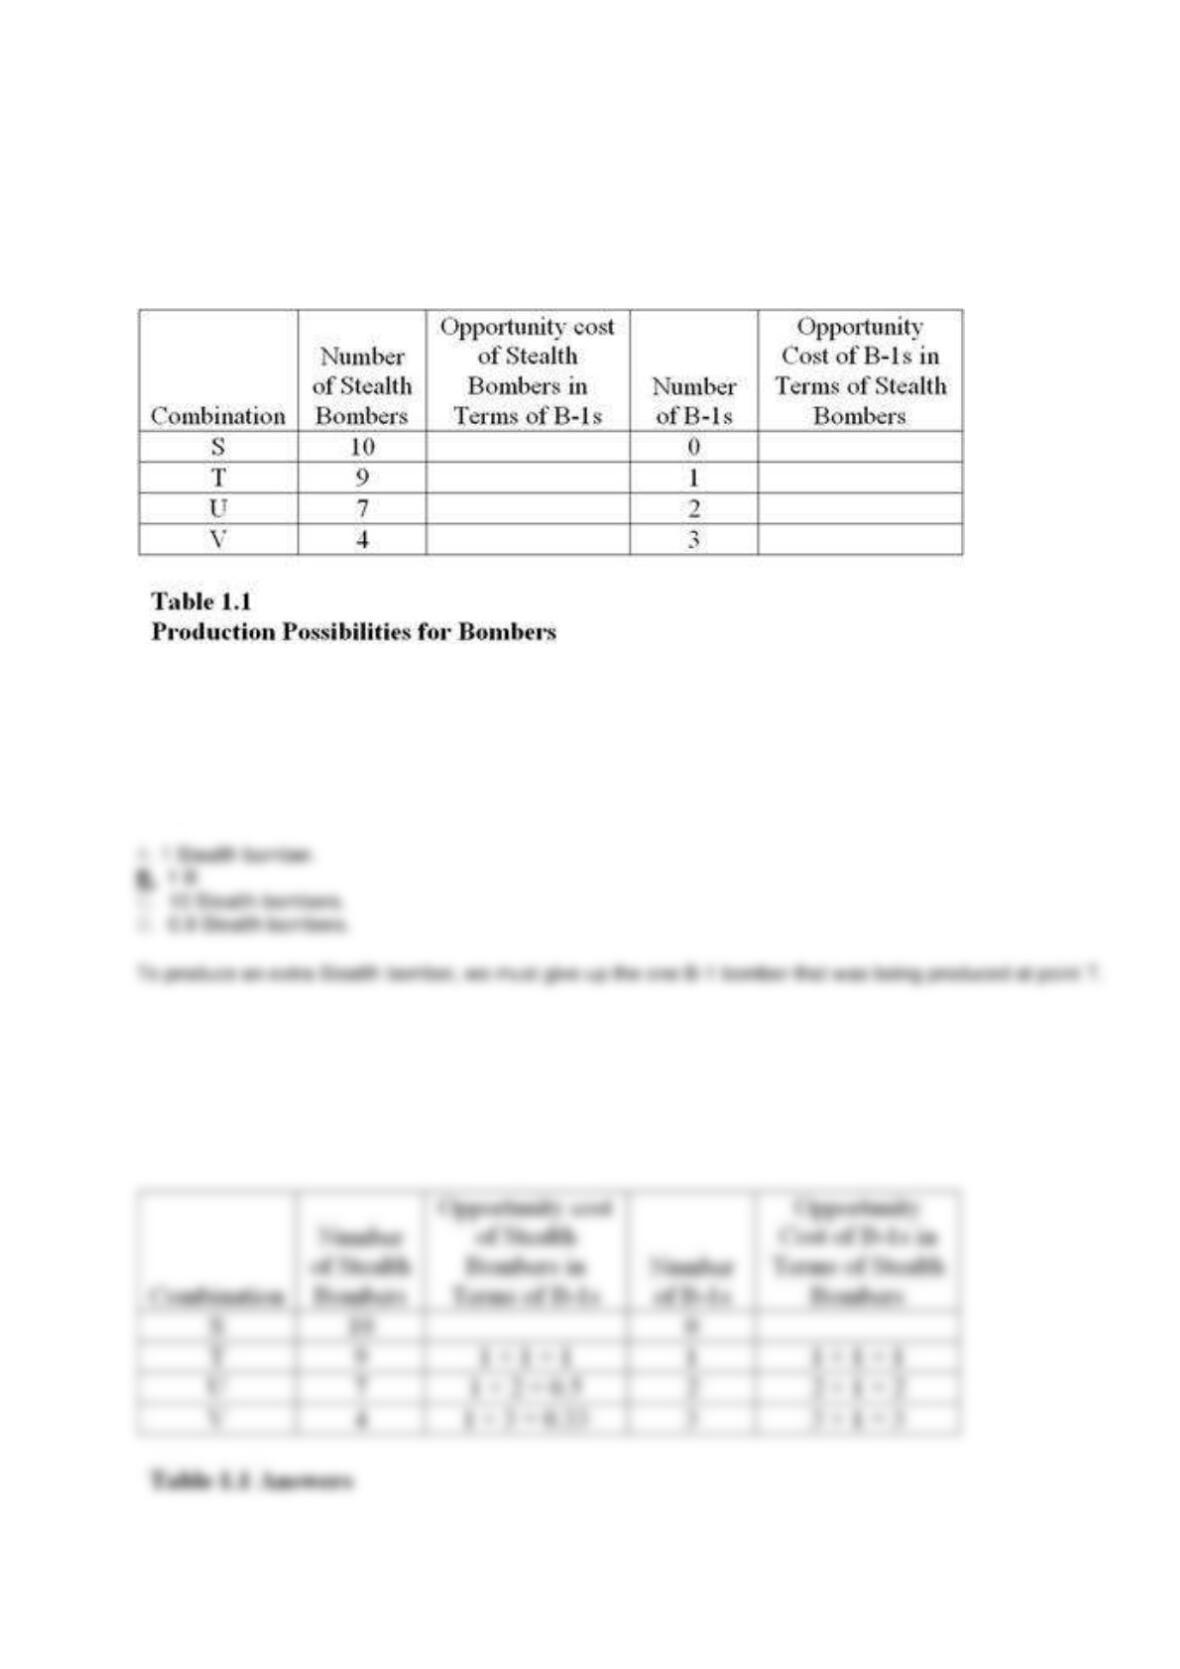
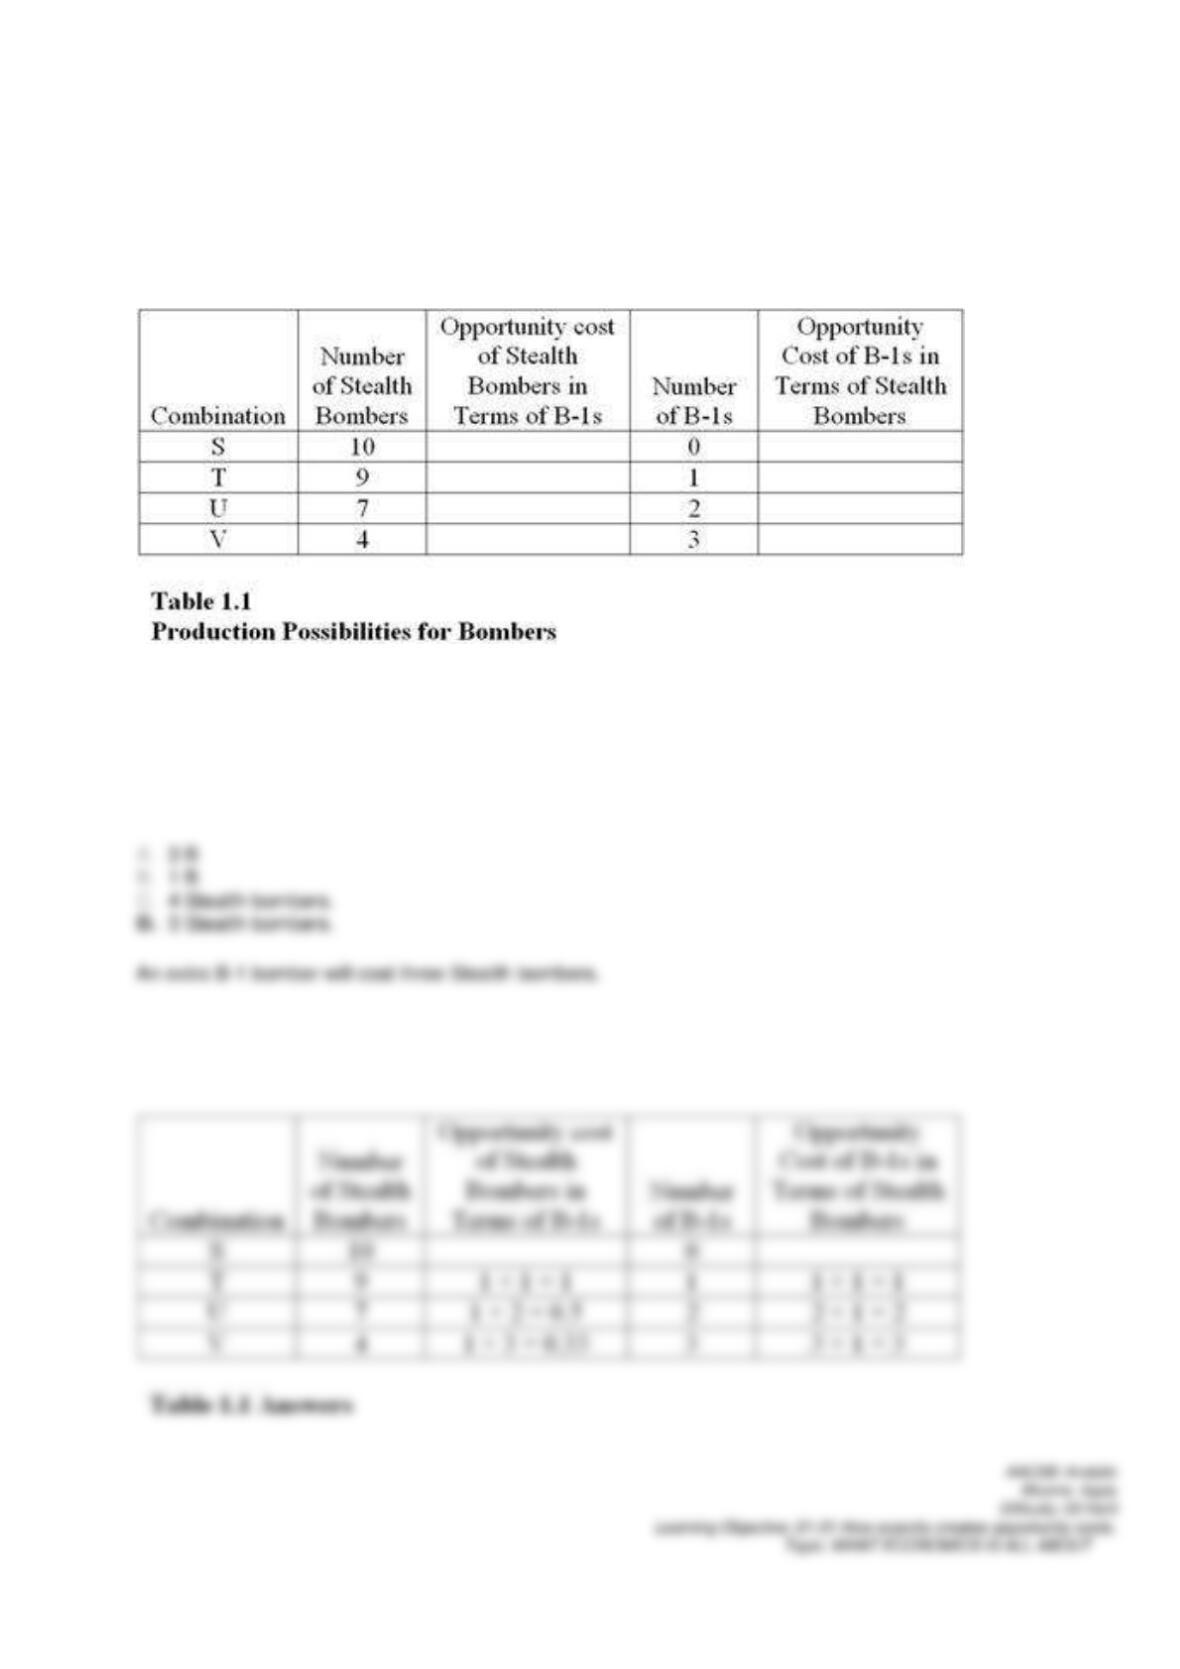
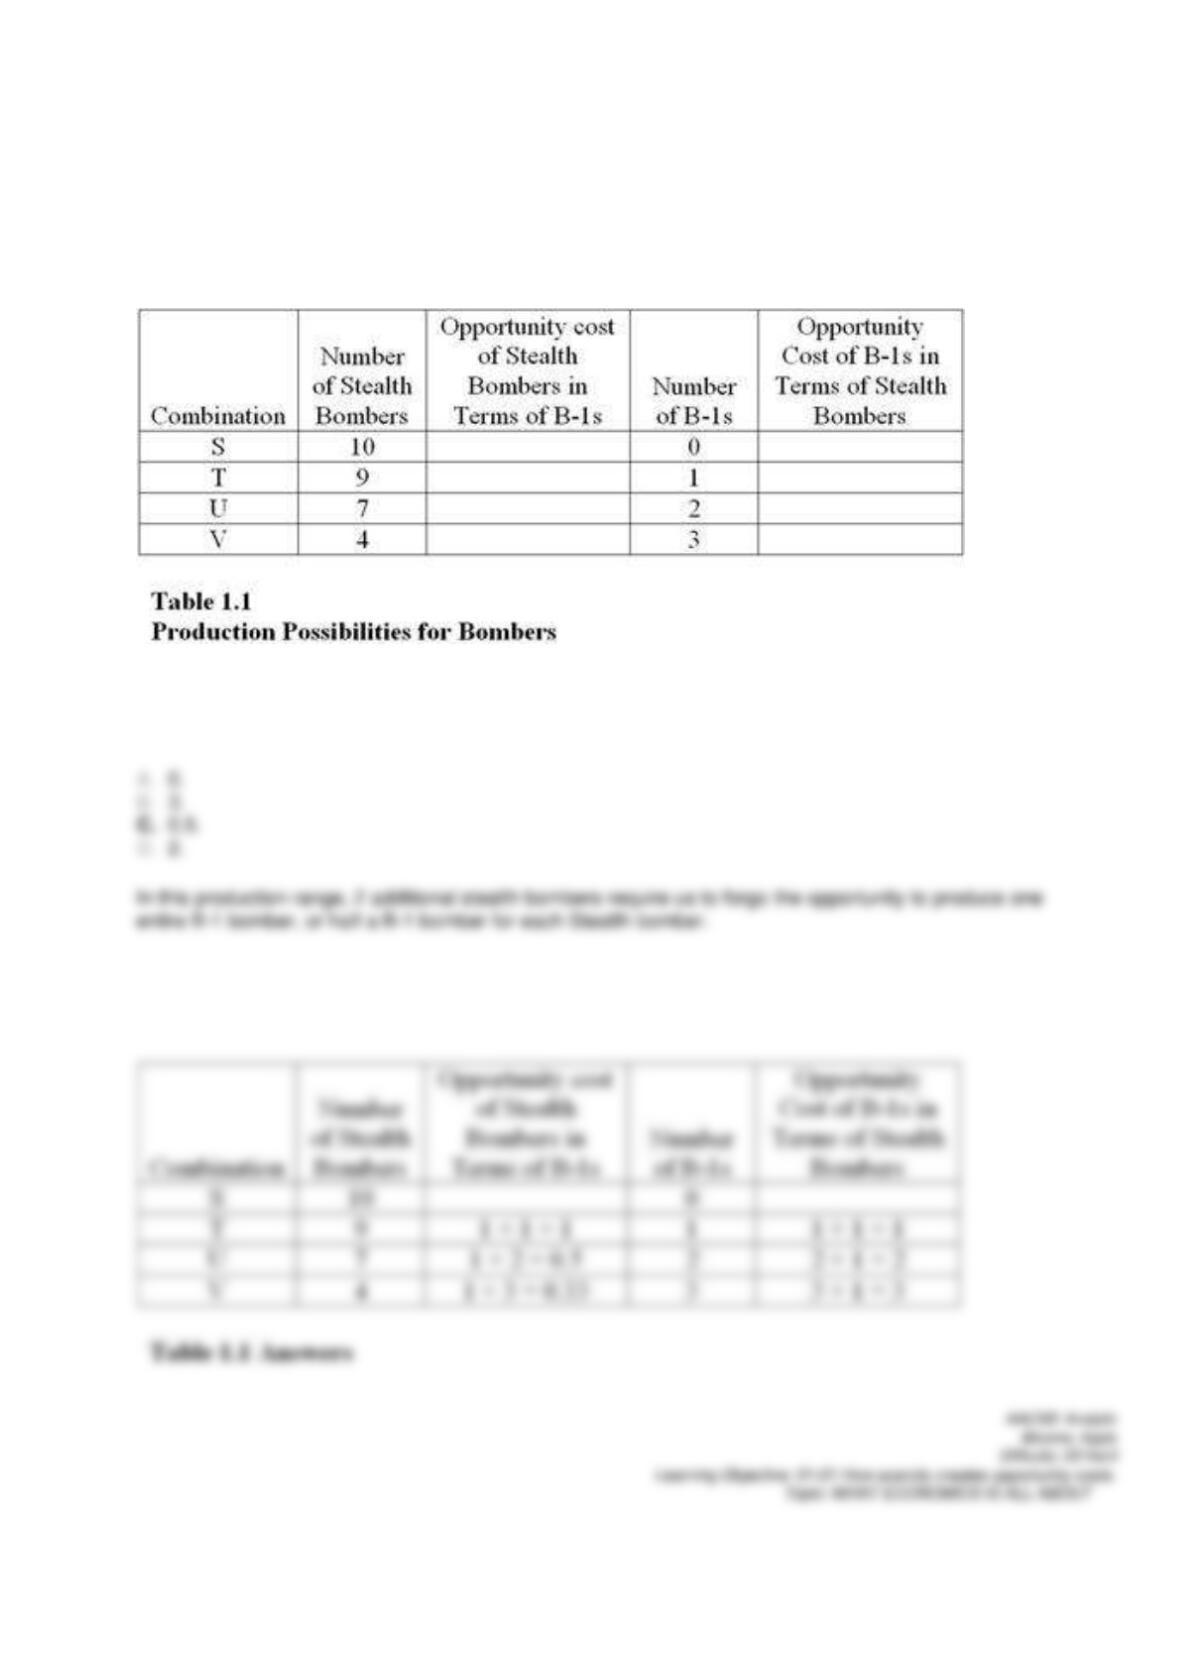
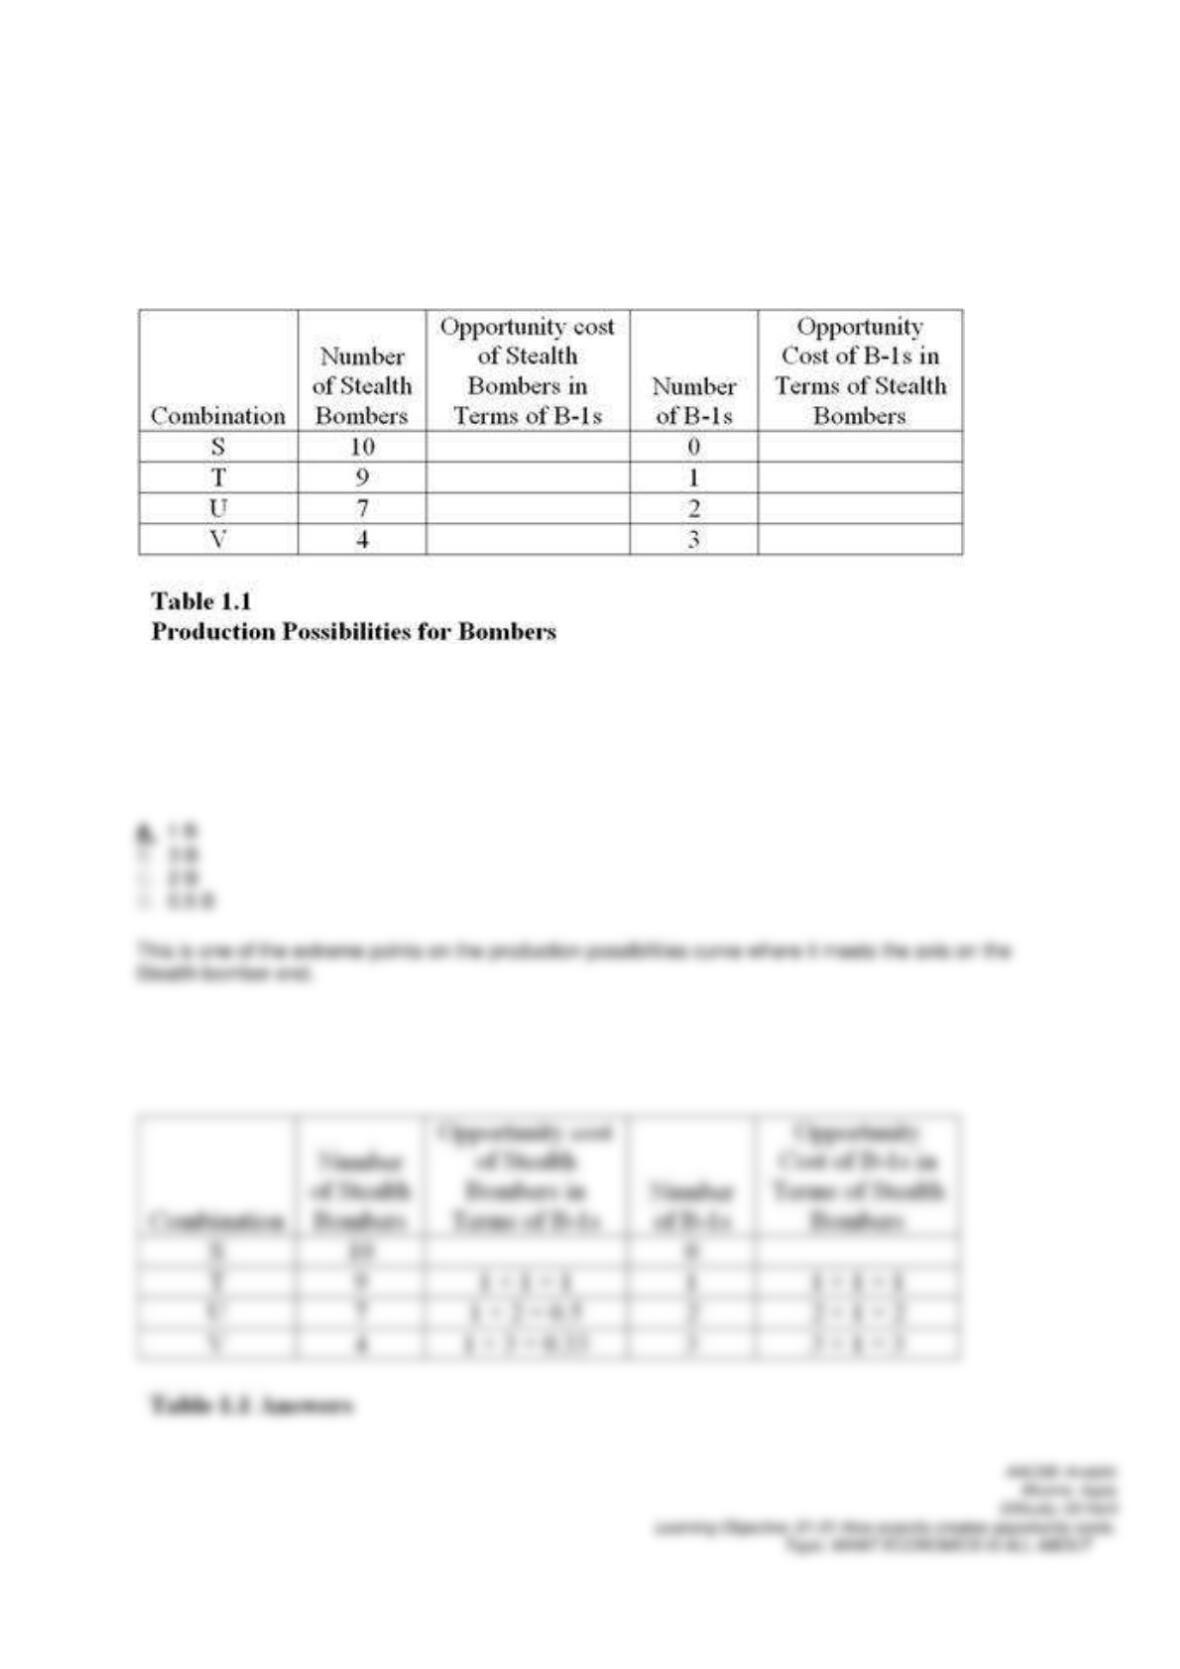
Table 1.1 shows the hypothetical trade-off between different combinations of Stealth bombers and B-1
bombers that might be produced in a year with the limited U.S. capacity, ceteris paribus. Complete the table
by calculating the required opportunity costs for both the B-1 and Stealth bombers.
On the basis of your calculations in Table 1.1, you may infer that the law of increasing opportunity costs applies
to

92.
Table 1.1 shows the hypothetical trade-off between different combinations of Stealth bombers and B-1
bombers that might be produced in a year with the limited U.S. capacity, ceteris paribus. Complete the table
by calculating the required opportunity costs for both the B-1 and Stealth bombers.
On the basis of your calculations in Table 1.1, what is the opportunity cost of producing at point S rather
than point T?

93.
Table 1.1 shows the hypothetical trade-off between different combinations of Stealth bombers and B-1
bombers that might be produced in a year with the limited U.S. capacity, ceteris paribus. Complete the table
by calculating the required opportunity costs for both the B-1 and Stealth bombers.
On the basis of your calculations in Table 1.1, what is the opportunity cost of producing at point V rather
than point U?
94.
Table 1.1 shows the hypothetical trade-off between different combinations of Stealth bombers and B-1
bombers that might be produced in a year with the limited U.S. capacity, ceteris paribus. Complete the table
by calculating the required opportunity costs for both the B-1 and Stealth bombers.
In the production range of 7 to 9 Stealth bombers, the opportunity cost of producing 1 more Stealth bomber
in terms of B-1s is
95.
Table 1.1 shows the hypothetical trade-off between different combinations of Stealth bombers and B-1
bombers that might be produced in a year with the limited U.S. capacity, ceteris paribus. Complete the table
by calculating the required opportunity costs for both the B-1 and Stealth bombers.
The highest opportunity cost anywhere in Table 1.1 for Stealth bombers in terms of B-1 bombers is
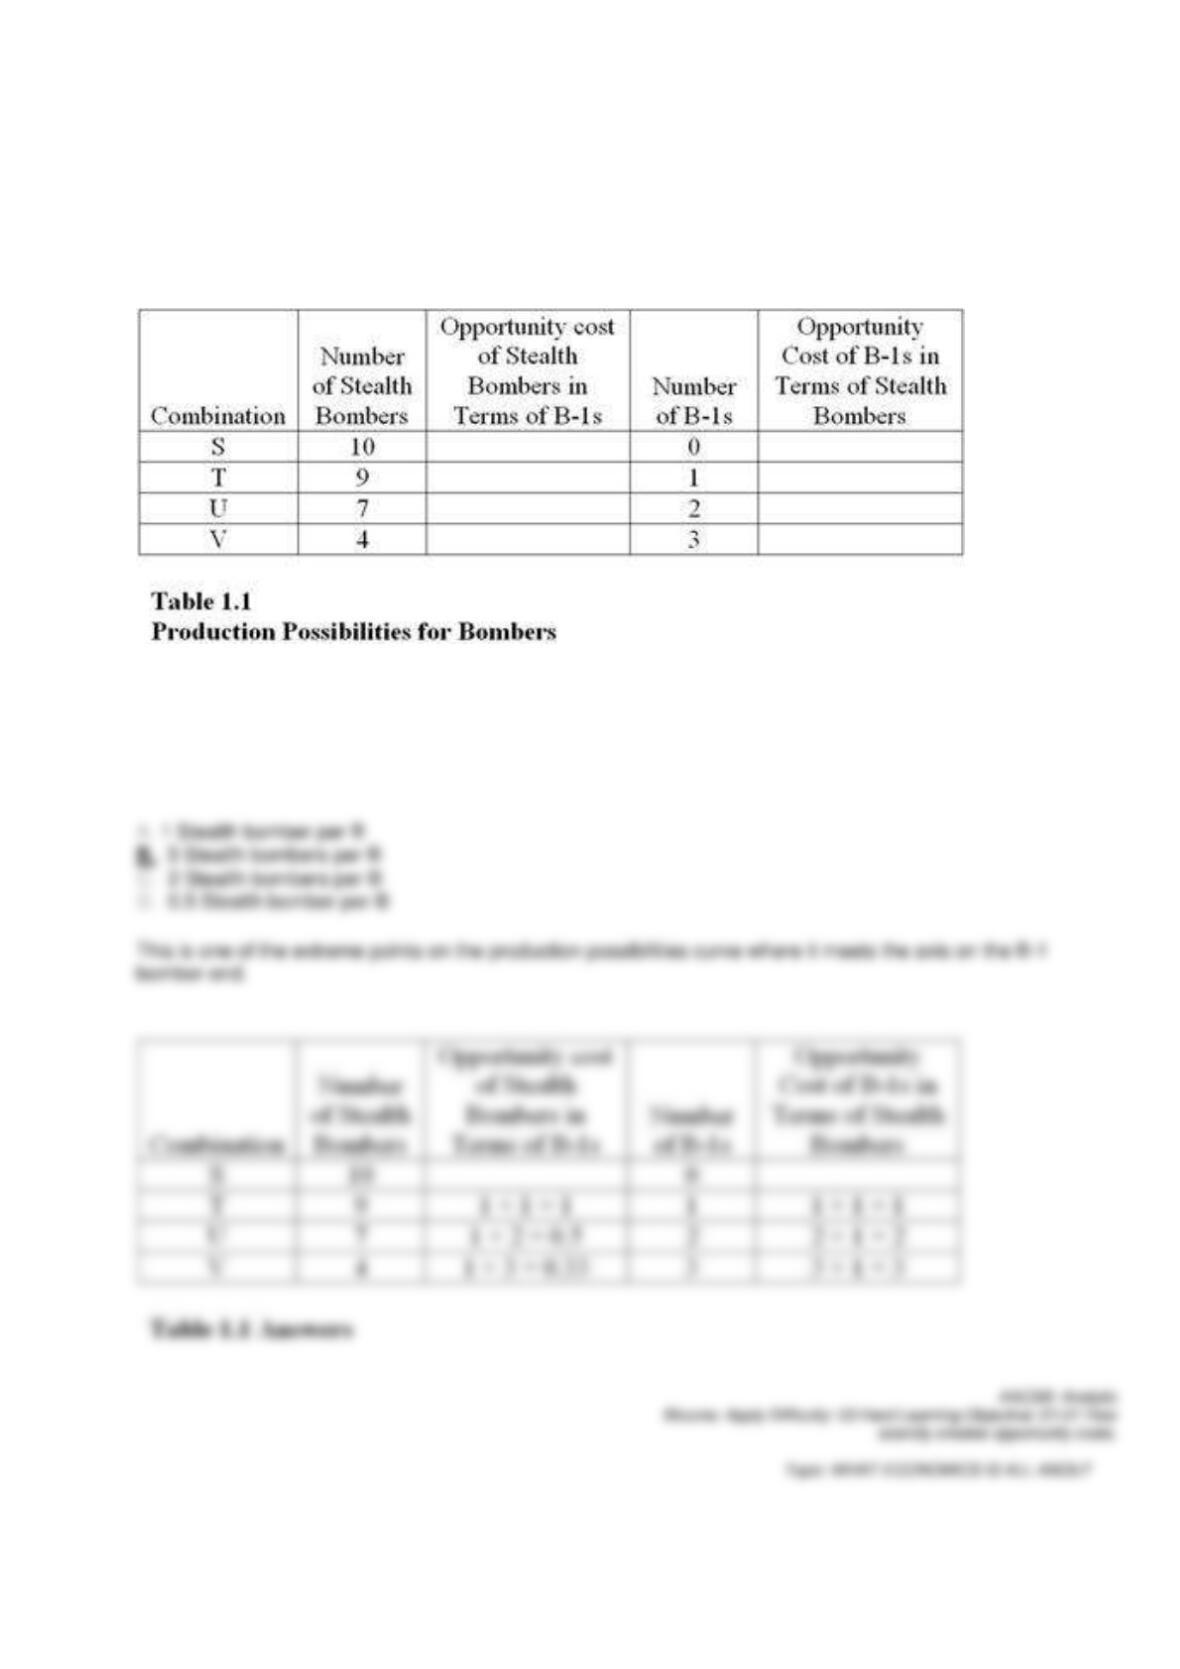
96.
Table 1.1 shows the hypothetical trade-off between different combinations of Stealth bombers and B-1
bombers that might be produced in a year with the limited U.S. capacity, ceteris paribus. Complete the table
by calculating the required opportunity costs for both the B-1 and Stealth bombers.
The highest opportunity cost anywhere in Table 1.1 for B-1 bombers in terms of Stealth bombers is
97.
Table 1.1 shows the hypothetical trade-off between different combinations of Stealth bombers and B-1
bombers that might be produced in a year with the limited U.S. capacity, ceteris paribus. Complete the table
by calculating the required opportunity costs for both the B-1 and Stealth bombers.
The lowest opportunity cost anywhere in Table 1.1 for B-1 bombers in terms of Stealth bombers is
98.
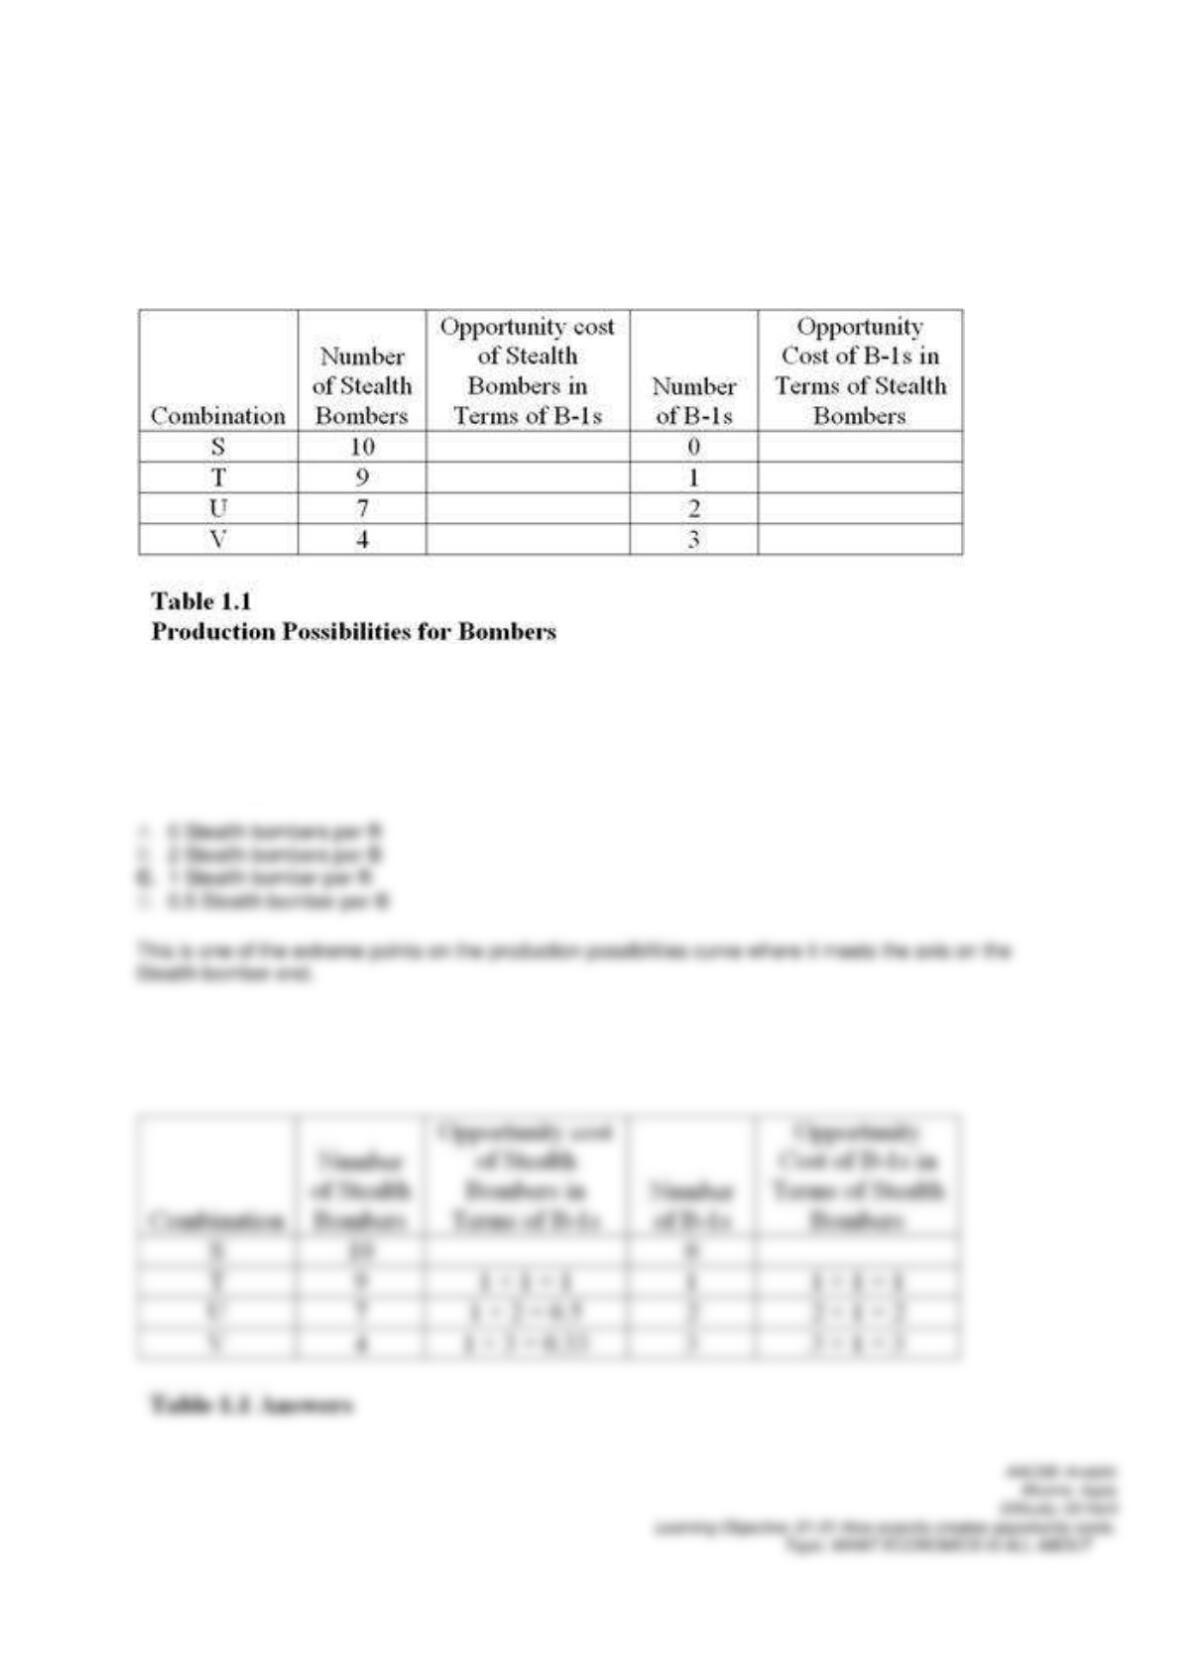
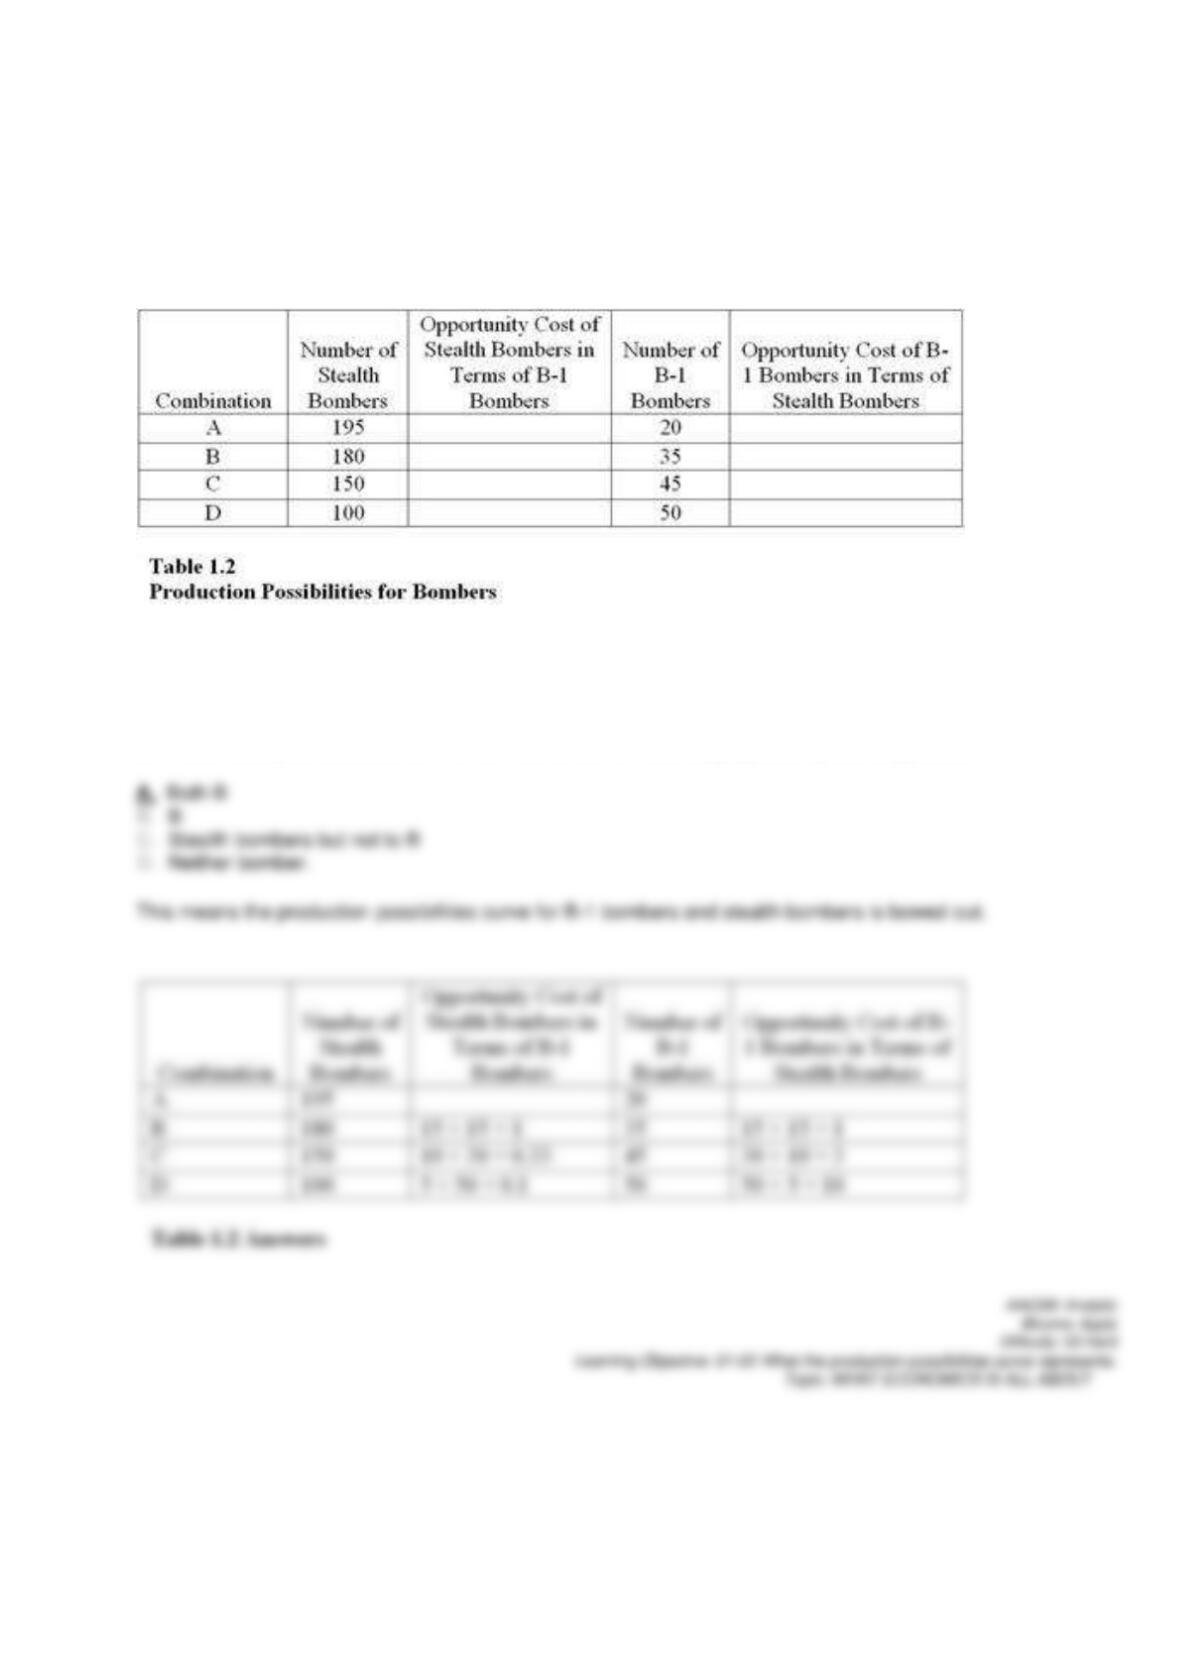
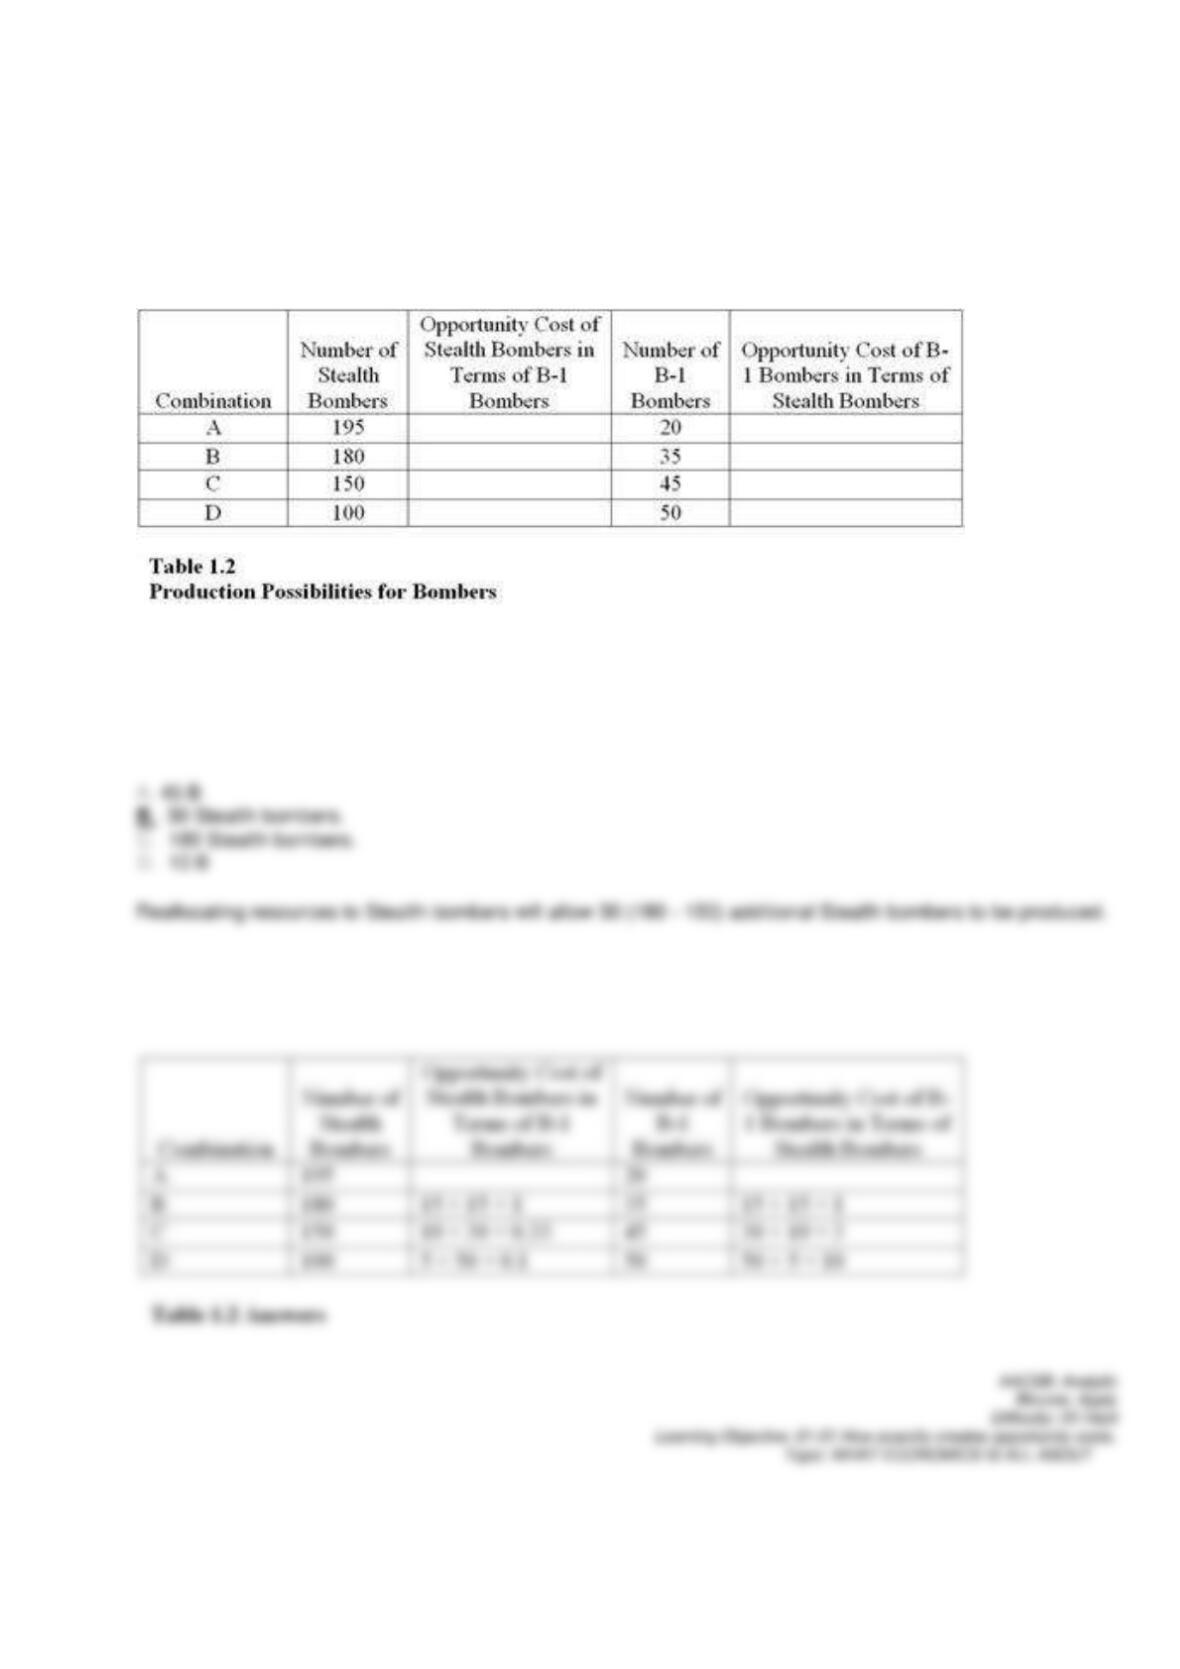
Table 1.2 shows the hypothetical trade-off between different combinations of Stealth bombers and B-1
bombers that might be produced in a year with the limited U.S. capacity, ceteris paribus. Complete the table
by calculating the required opportunity costs for both the B-1 and Stealth bombers.
On the basis of your calculations in Table 1.2, the law of increasing opportunity costs applies to
99.
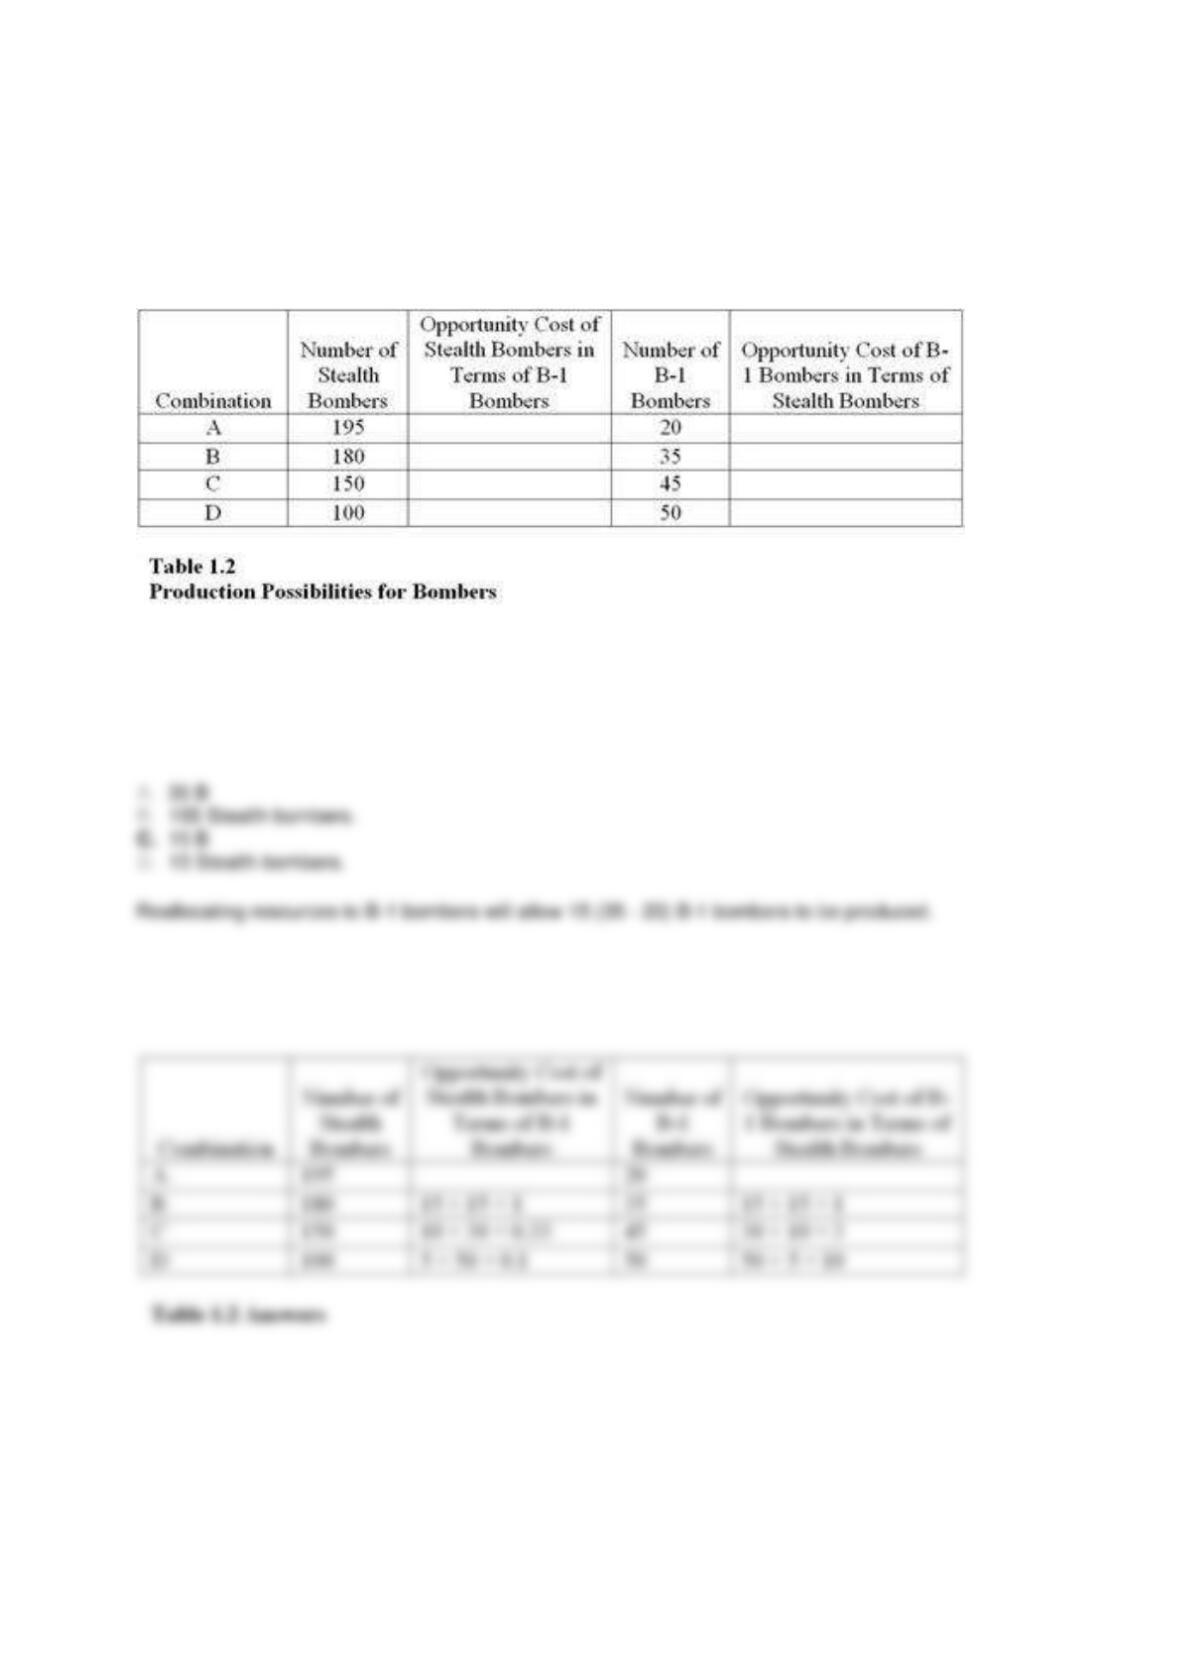
Table 1.2 shows the hypothetical trade-off between different combinations of Stealth bombers and B-1
bombers that might be produced in a year with the limited U.S. capacity, ceteris paribus. Complete the table
by calculating the required opportunity costs for both the B-1 and Stealth bombers.
On the basis of your calculations in Table 1.2, if the economy is currently producing at point C, what is the
opportunity cost of producing at point B?
100.
Table 1.2 shows the hypothetical trade-off between different combinations of Stealth bombers and B-1
bombers that might be produced in a year with the limited U.S. capacity, ceteris paribus. Complete the table
by calculating the required opportunity costs for both the B-1 and Stealth bombers.
On the basis of your calculations in Table 1.2, what is gained by producing at point B rather than point C?
101.
Table 1.2 shows the hypothetical trade-off between different combinations of Stealth bombers and B-1
bombers that might be produced in a year with the limited U.S. capacity, ceteris paribus. Complete the table
by calculating the required opportunity costs for both the B-1 and Stealth bombers.
On the basis of your calculations in Table 1.2, what is gained by producing at point B rather than point A?
102.
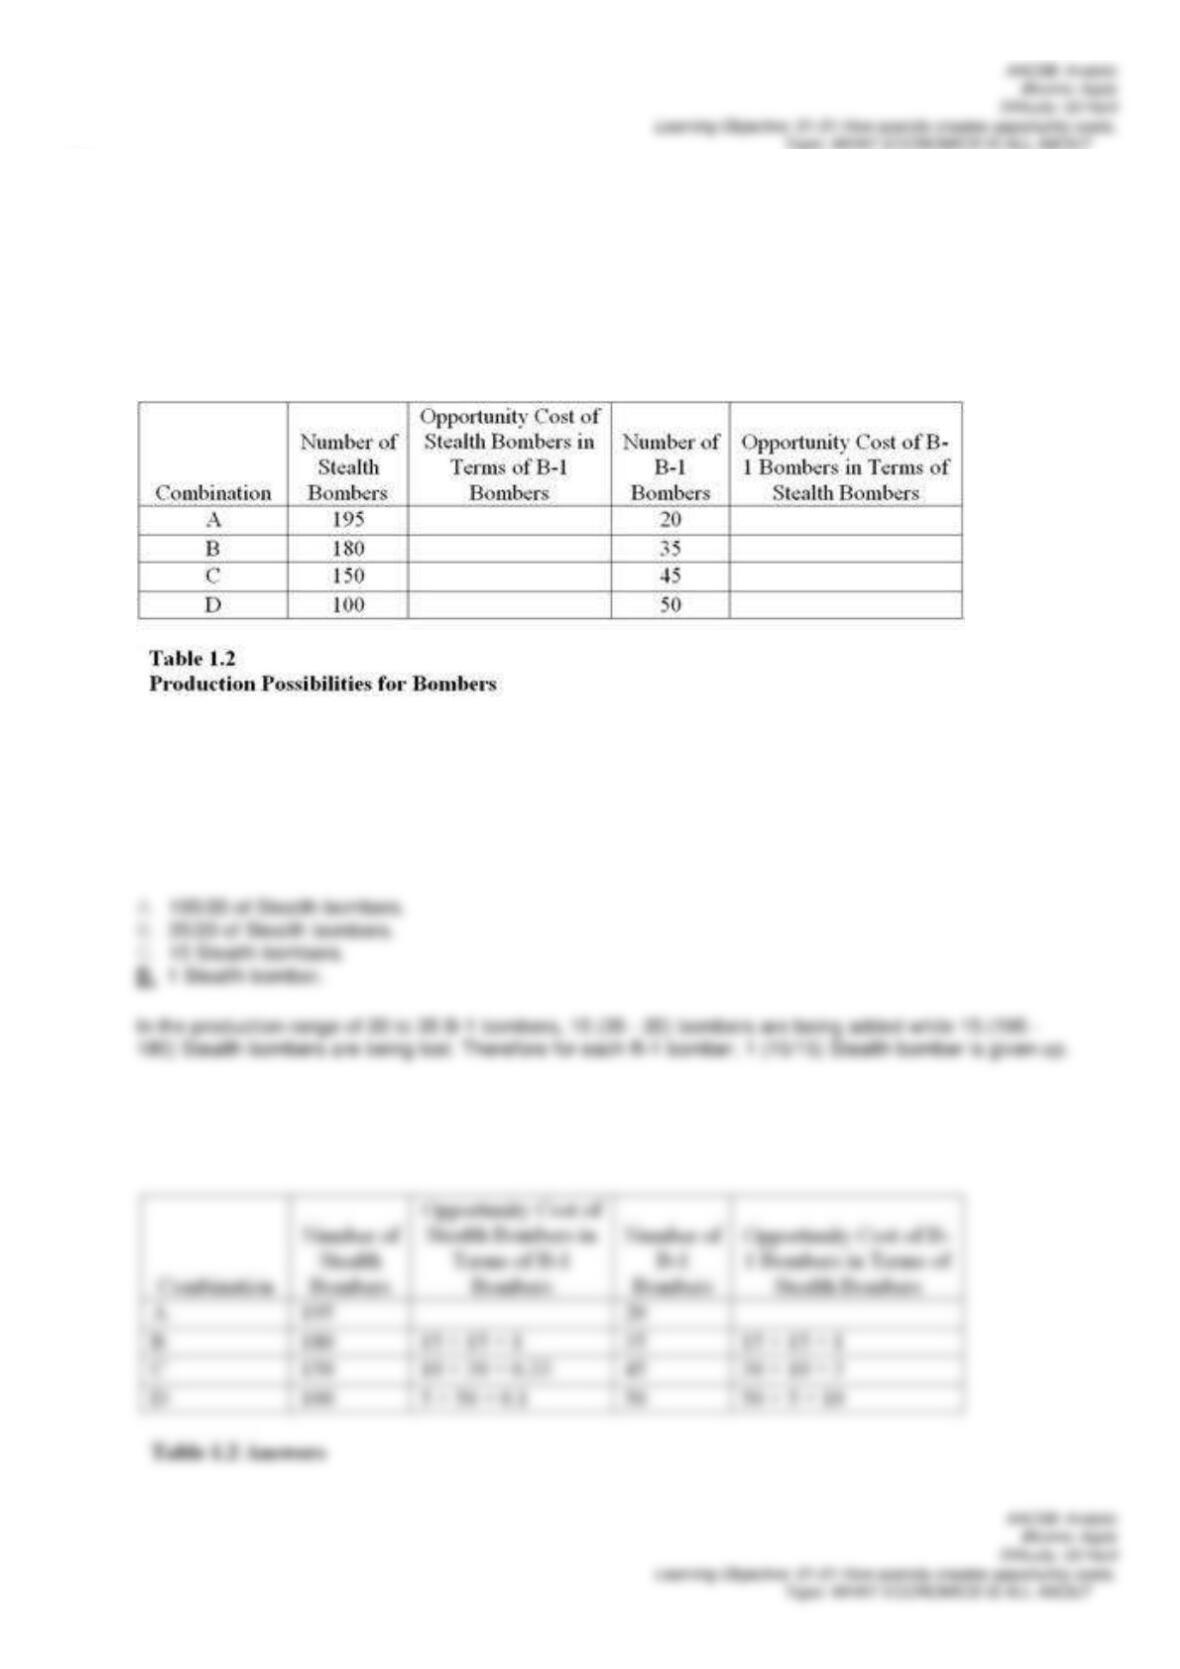
Table 1.2 shows the hypothetical trade-off between different combinations of Stealth bombers and B-1
bombers that might be produced in a year with the limited U.S. capacity, ceteris paribus. Complete the table
by calculating the required opportunity costs for both the B-1 and Stealth bombers.
Refer to Table 1.2. In the production range of 20 to 35 B-1 bombers, the opportunity cost of producing 1
more B-1 bomber is
103.
Table 1.2 shows the hypothetical trade-off between different combinations of Stealth bombers and B-1
bombers that might be produced in a year with the limited U.S. capacity, ceteris paribus. Complete the table
by calculating the required opportunity costs for both the B-1 and Stealth bombers.
The highest opportunity cost anywhere in Table 1.2 for B-1 bombers in terms of Stealth bombers is
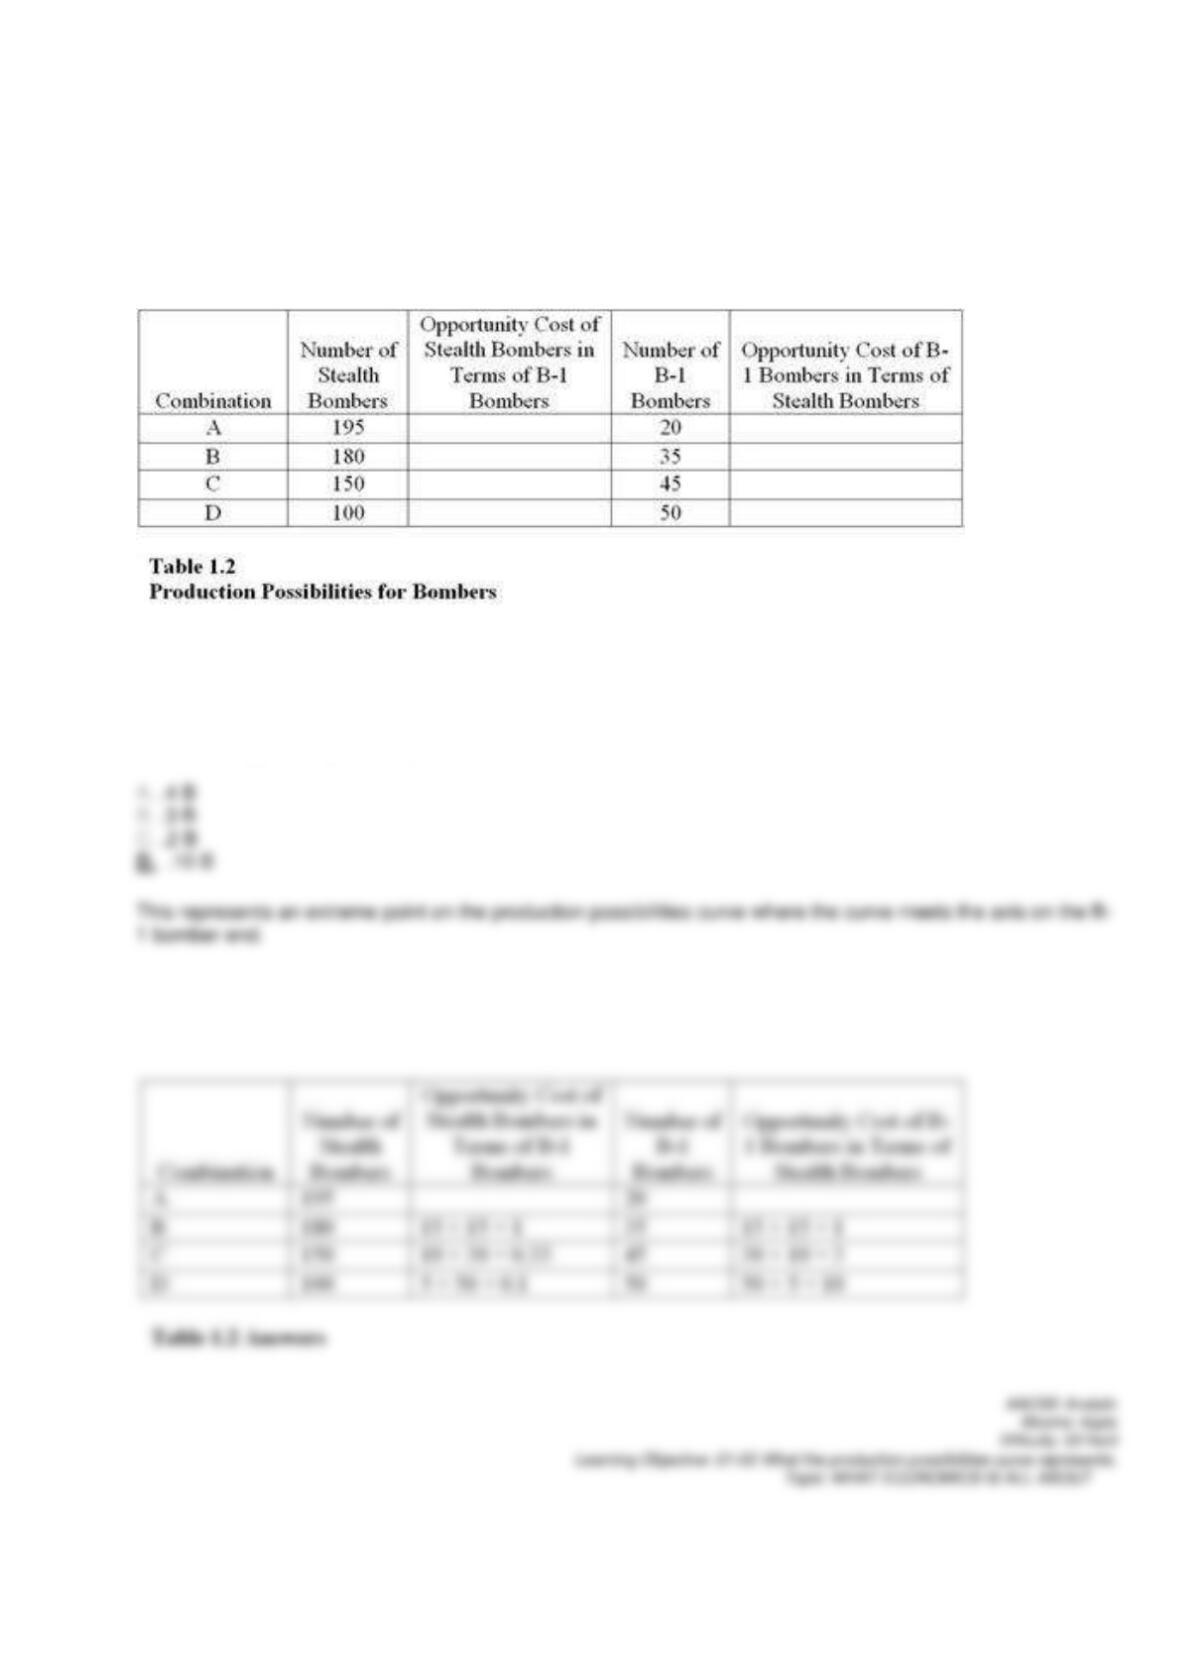
104.
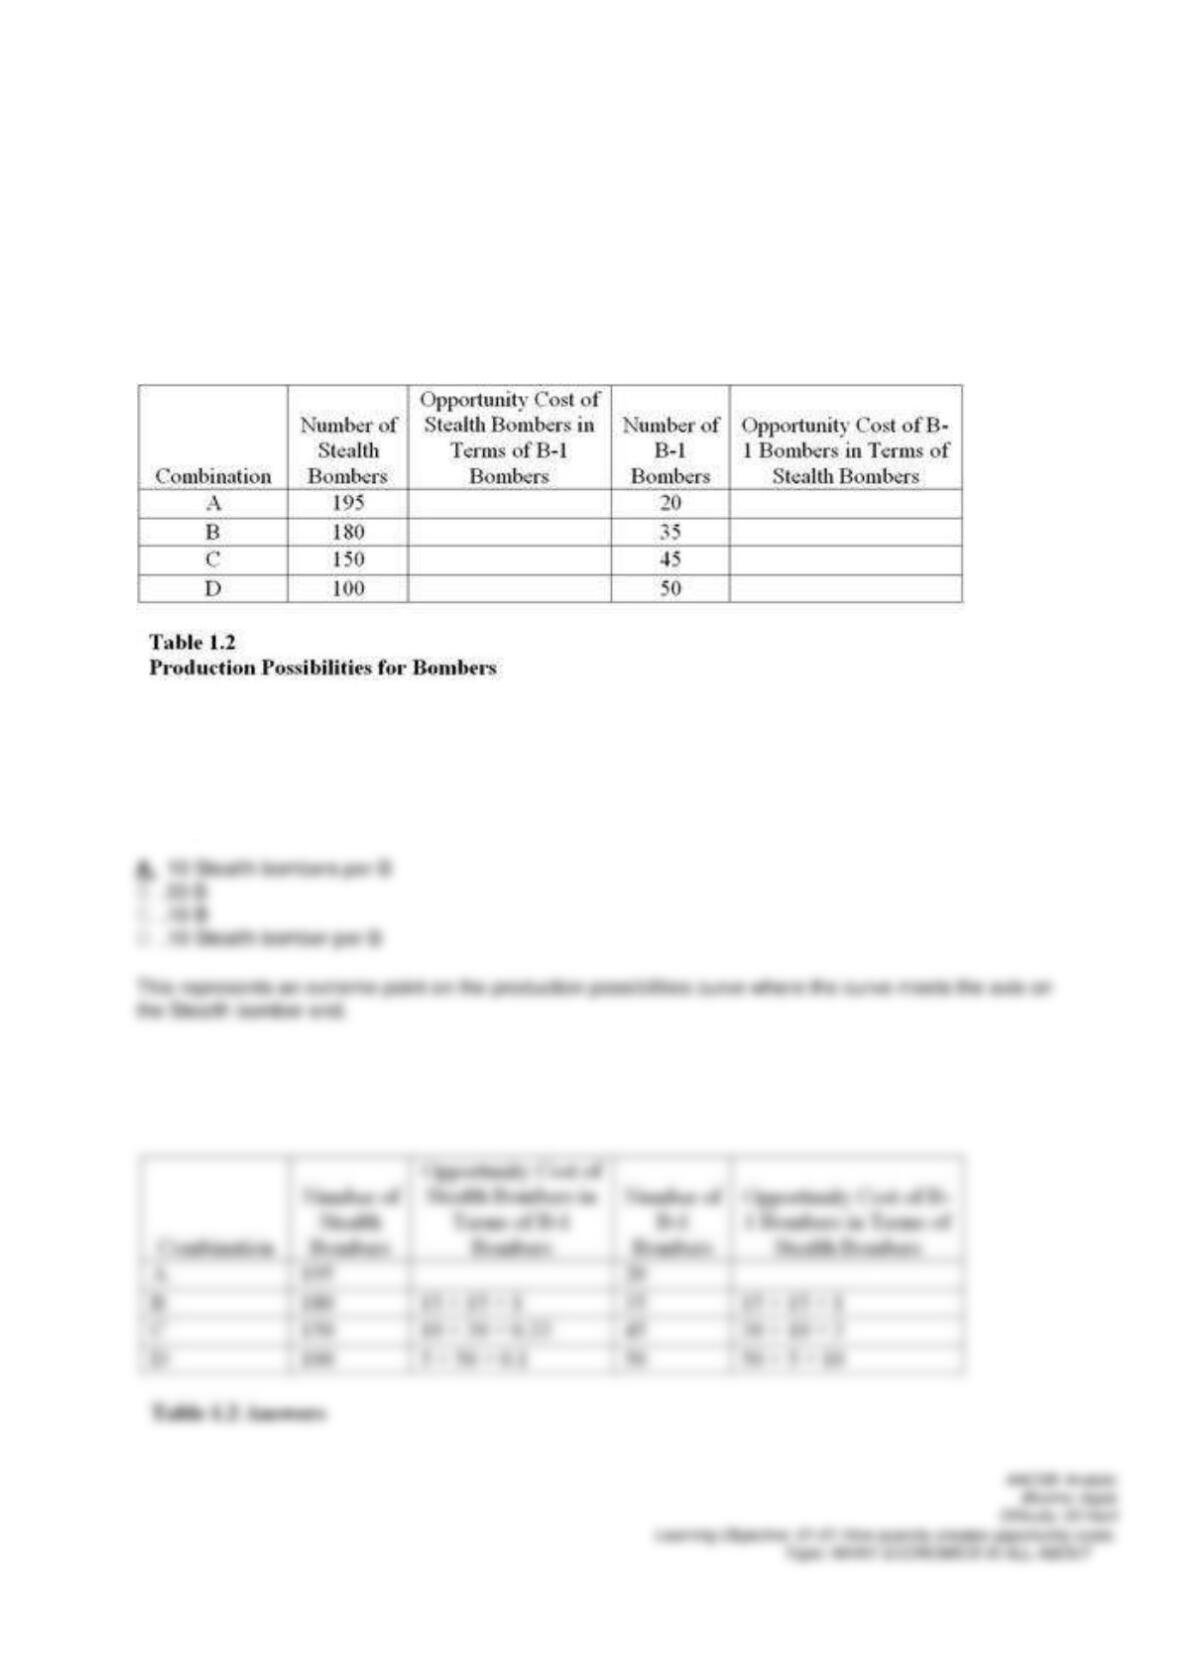
Table 1.2 shows the hypothetical trade-off between different combinations of Stealth bombers and B-1
bombers that might be produced in a year with the limited U.S. capacity, ceteris paribus. Complete the table
by calculating the required opportunity costs for both the B-1 and Stealth bombers.
The lowest opportunity cost anywhere in Table 1.2 for Stealth Bombers is
105.
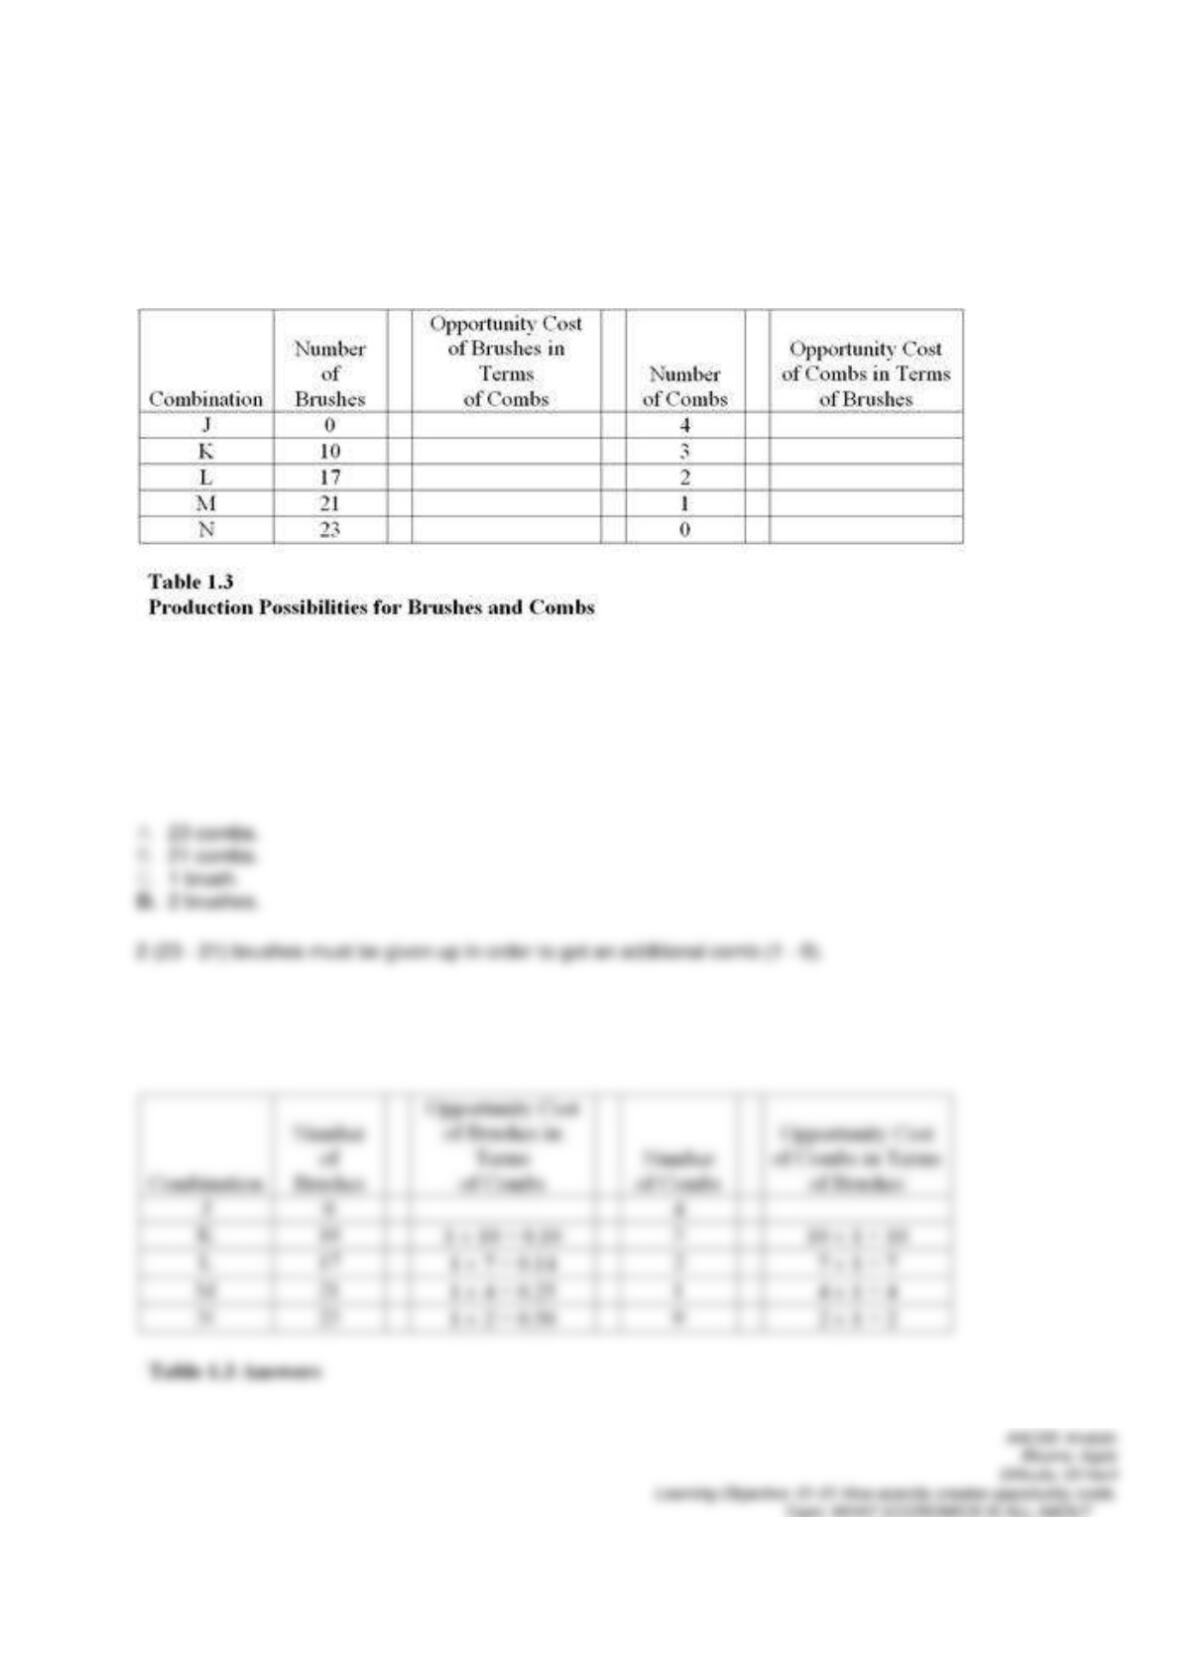
Table 1.3 shows the hypothetical trade-off between different combinations of brushes and combs that might be
produced in a year with the limited capacity for Country X, ceteris paribus. Complete the table by calculating
the required opportunity costs for brushes and combs.
On the basis of your calculations in Table 1.3, what is the opportunity cost of producing at point M rather than
point N?


