1.2 Linear Models and Rates of Change
21
____ 16.
Write an equation of the line that passes through the given point and is perpendicular
to the given line.
a.
b.
c.
d.
e.
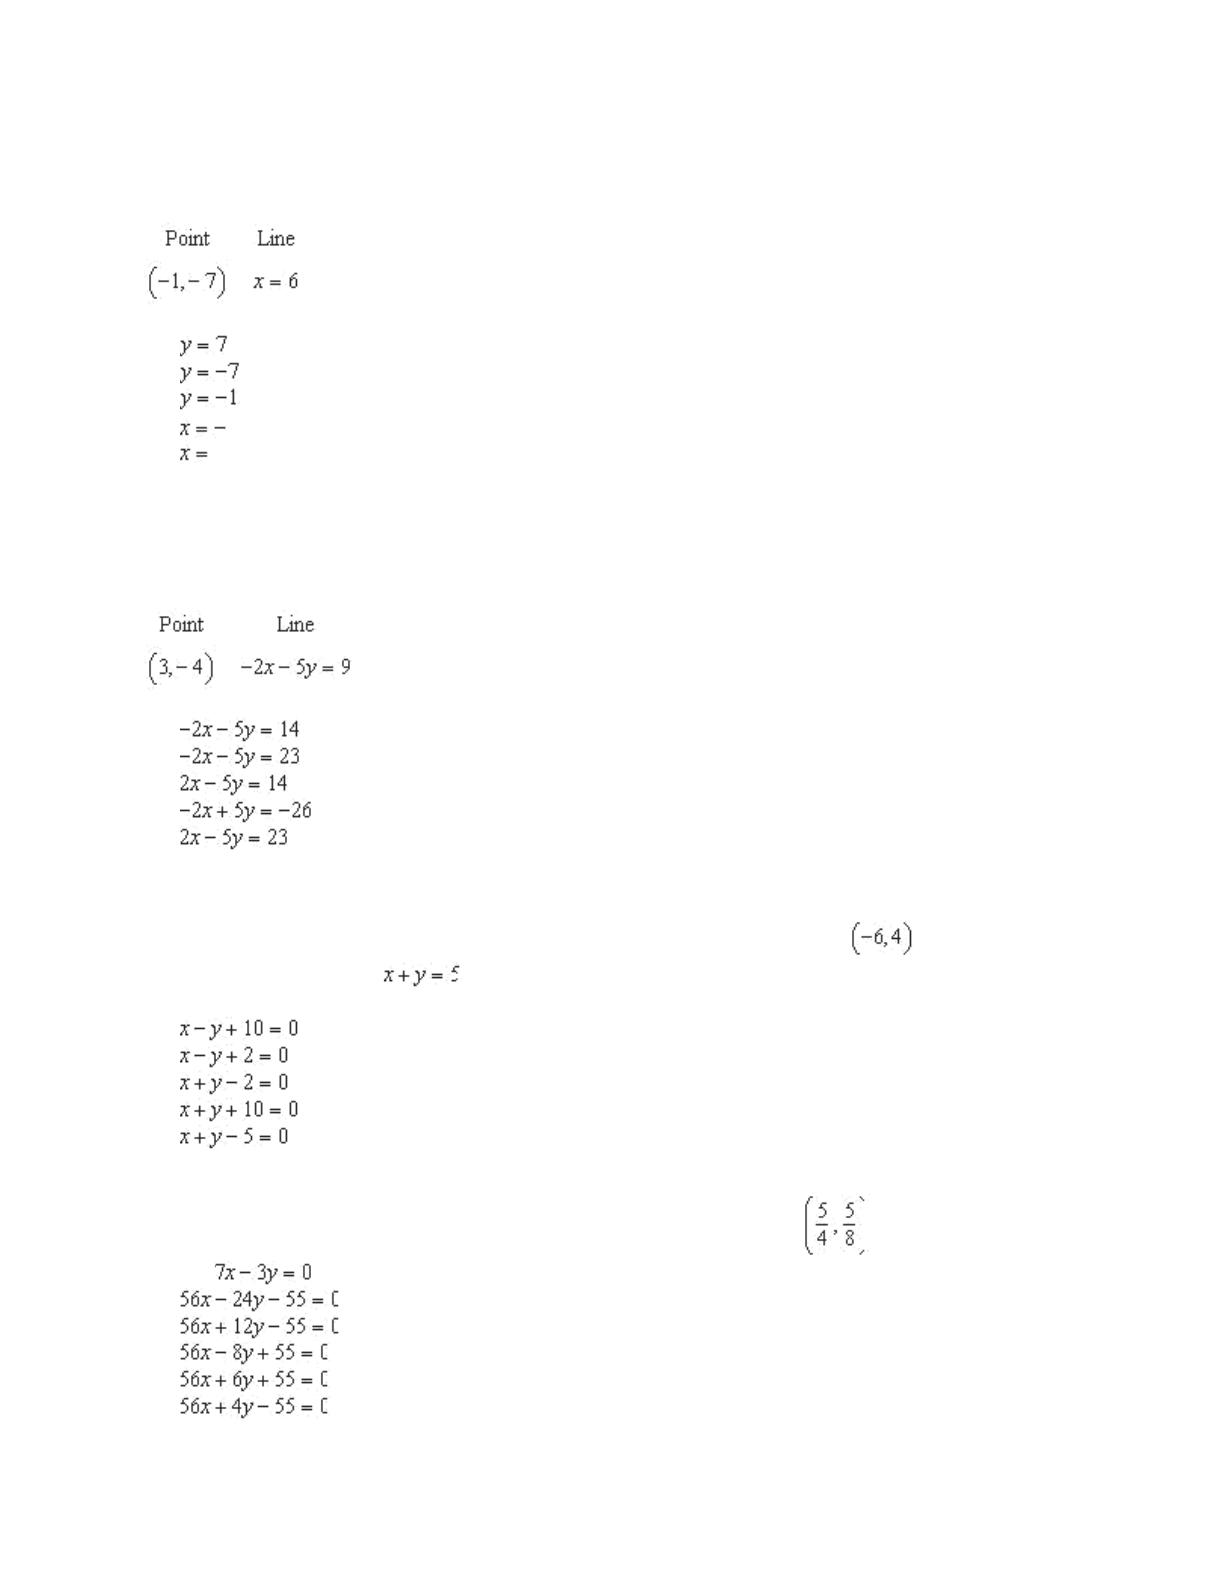
____ 17. Write an equation of the line that passes through the given point and is parallel to the
given line.
a.
b.
c.
d.
e.
____
18.
Write an equation of the line that passes through the point
and is
perpendicular to the line
.
a.
b.
c.
d.
e.
____
19.
Write an equation of the line that passes through the point
and is parallel to
the line
.
a.
b.
c.
d.
e.
22
Chapter 1: Preparation for Calculus
____
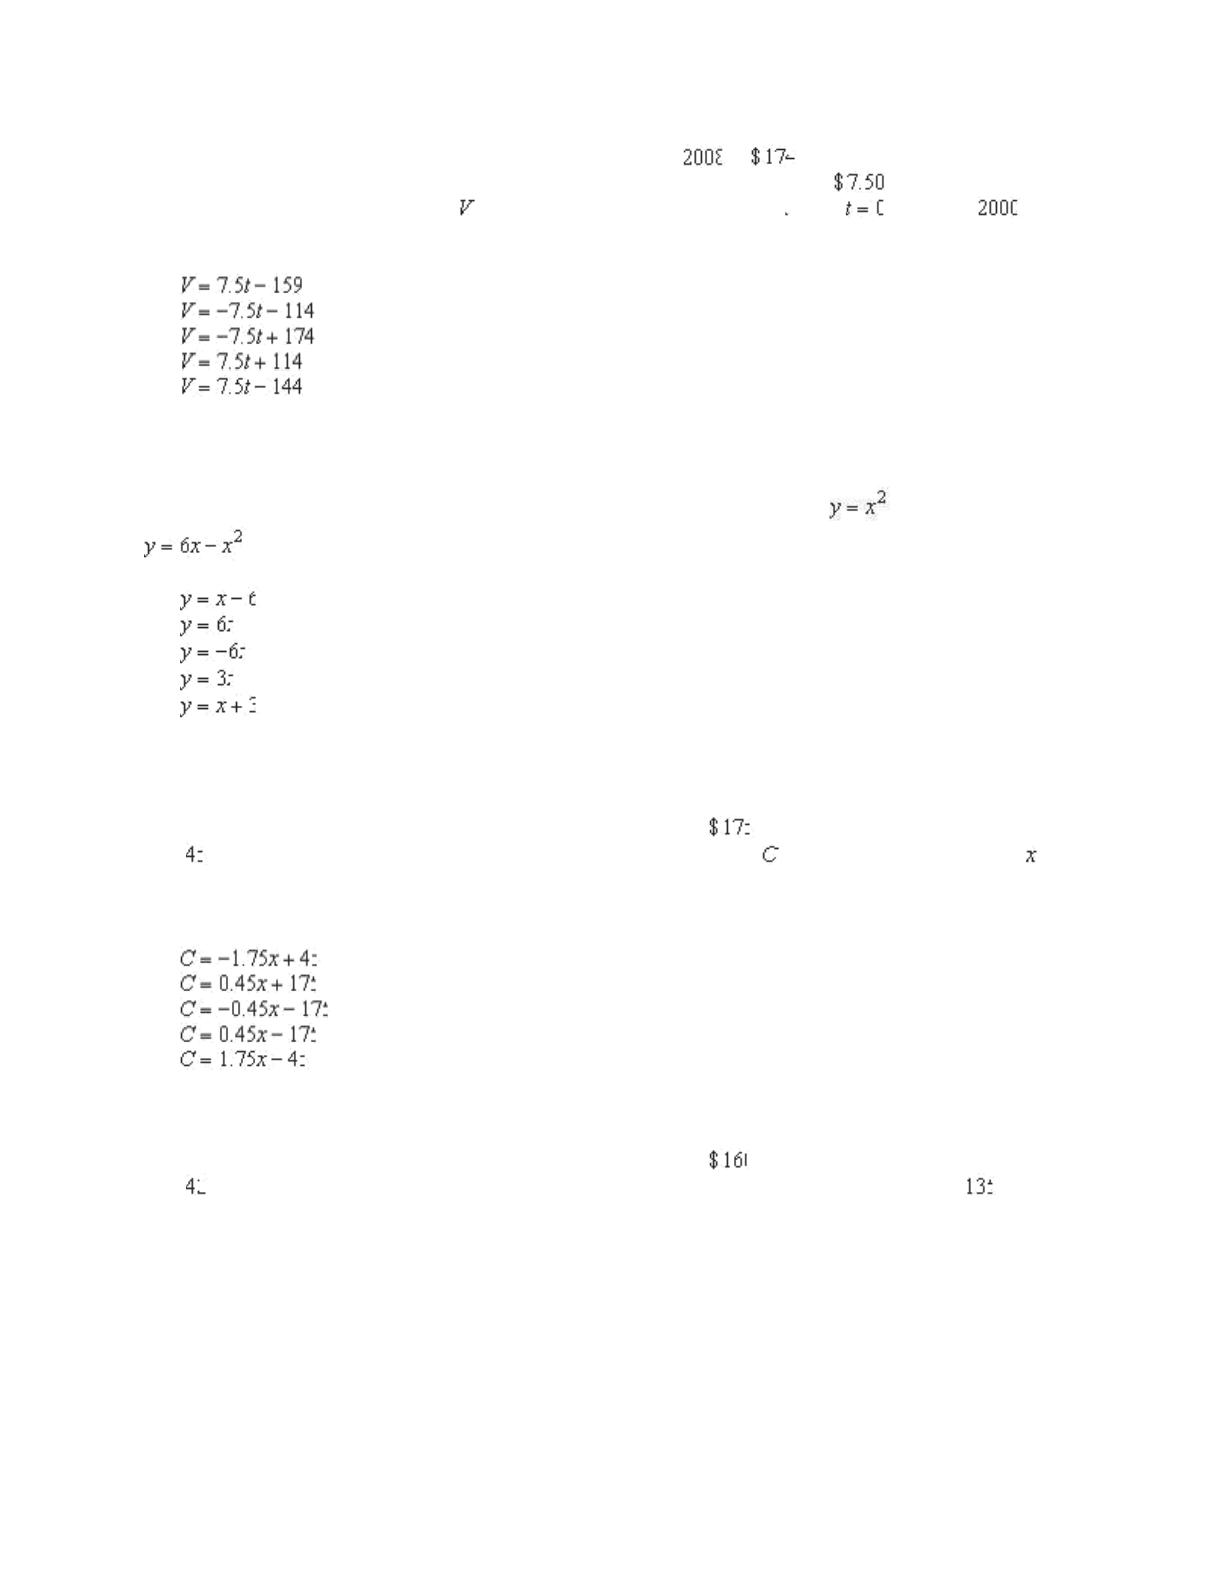
20.
Suppose that the dollar value of a product in
is
and the rate at which the
value of the product is expected to increase per year during the next
years is
. Write a linear
equation that gives the dollar value of the product in terms of the year . (Let
represent
.)
Round the numerical values in your answer to one decimal place, where applicable.
a.
b.
c.
d.
e.
____ 21. Find an equation of the line through the points of intersection of and
.
a.
b.
c.
d.
e.
____ 22.
A company reimburses its sales representatives
per day for lodging and meals
plus ¢ per mile driven. Write a linear equation giving the daily cost
to the company in terms of ,
the number of miles driven. Round the numerical values in your answer to two decimal places, where
applicable.
a.
b.
c.
d.
e.
____
23.
A company reimburses its sales representatives
per day for lodging and meals
plus
¢ per mile driven. How much does it cost the company if a sales representative drives
miles on a given day? Round your answer to the nearest cent.
227.20
216.70
136.35
161.35
191.70
1.2 Linear Models and Rates of Change
23
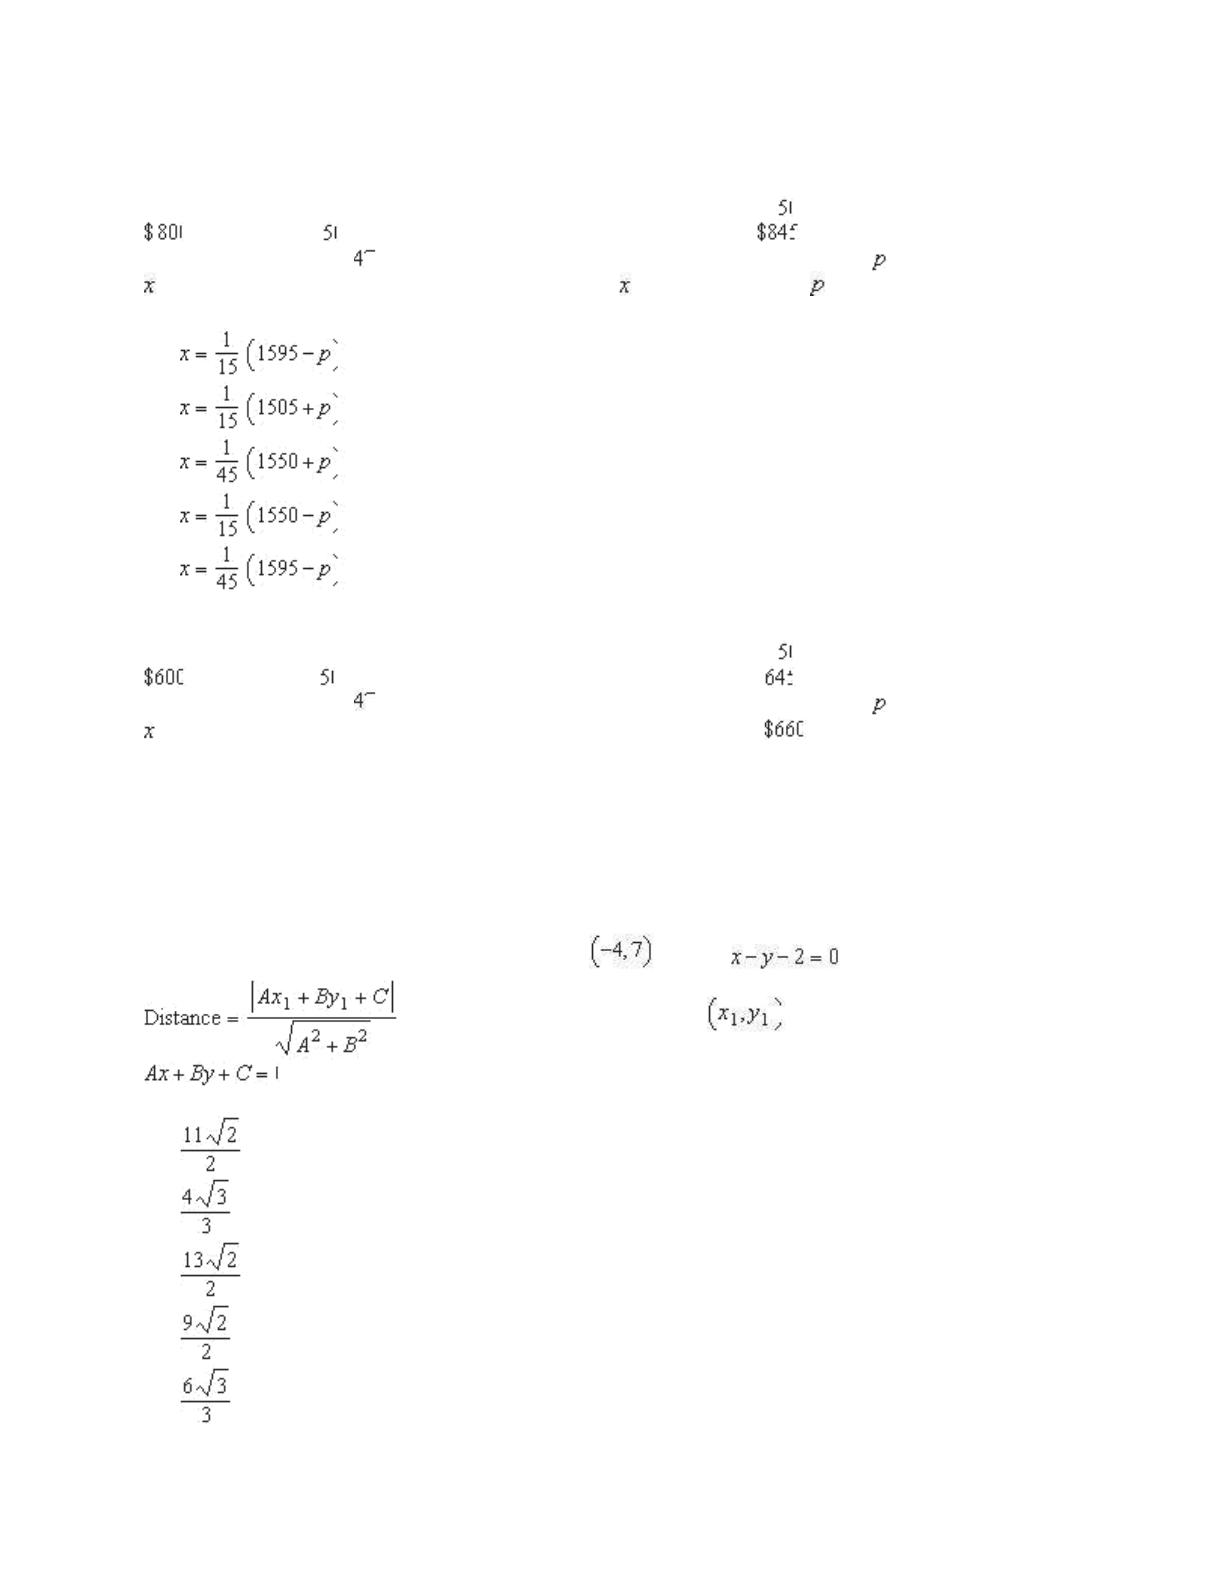
____ 24.
A real estate office handles an apartment complex with
units. When the rent is
per month, all
units are occupied. However, when the rent is
, the average number of
occupied units drops to
. Assume that the relationship between the monthly rent and the demand
is linear. Write a linear equation giving the demand in terms of the rent .
a.
b.
c.
d.
e.
____ 25.
A real estate office handles an apartment complex with
units. When the rent is
per month, all units are occupied. However, when the rent is $
, the average number of
occupied units drops to . Assume that the relationship between the monthly rent and the demand
is linear. Predict the number of units occupied if the rent is raised to
.
a.
43 units
b.
54 units
c.
57 units
d.
49 units
e.
46 units
____ 26. Find the distance between the point and line using the formula,
for the distance between the point and the line
.
a.
b.
c.
d.
e.
24 Chapter 1: Preparation for Calculus
1.2 Linear Models and Rates of Change
Answer Section
1.2 Linear Models and Rates of Change
25
26 Chapter 1: Preparation for Calculus
1.3 Functions and Their Graphs
Multiple Choice
Identify the choice that best completes the statement or answers the question.
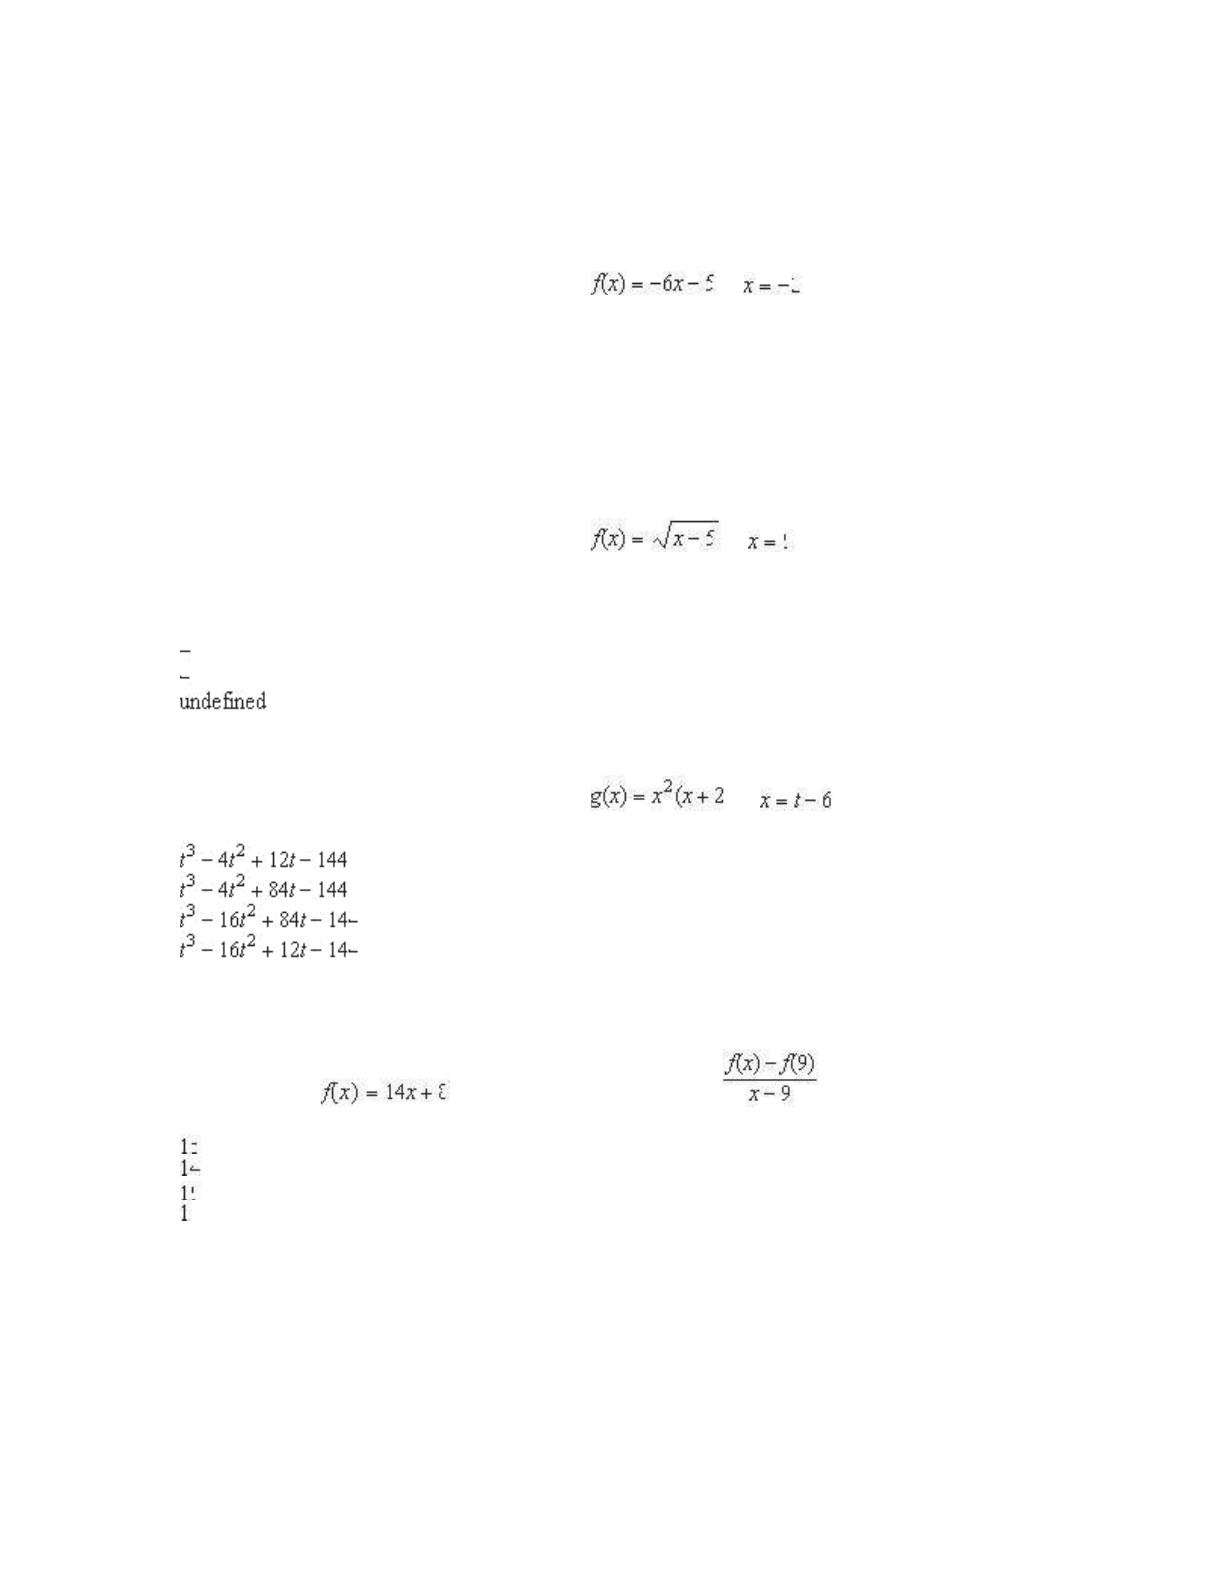
____ 1. Evaluate (if possible) the function at . Simplify the result.
–7
17
3
7
undefined
____ 2. Evaluate (if possible) the function at . Simplify the result.
a.
b.
c.
d.
e.
____ 3. Evaluate (if possible) the function at . Simplify the result.
a.
b.
c.
d.
e. none of the above
____ 4. Let . Then simplify the expression .
undefined
1.3 Functions and Their Graphs
27
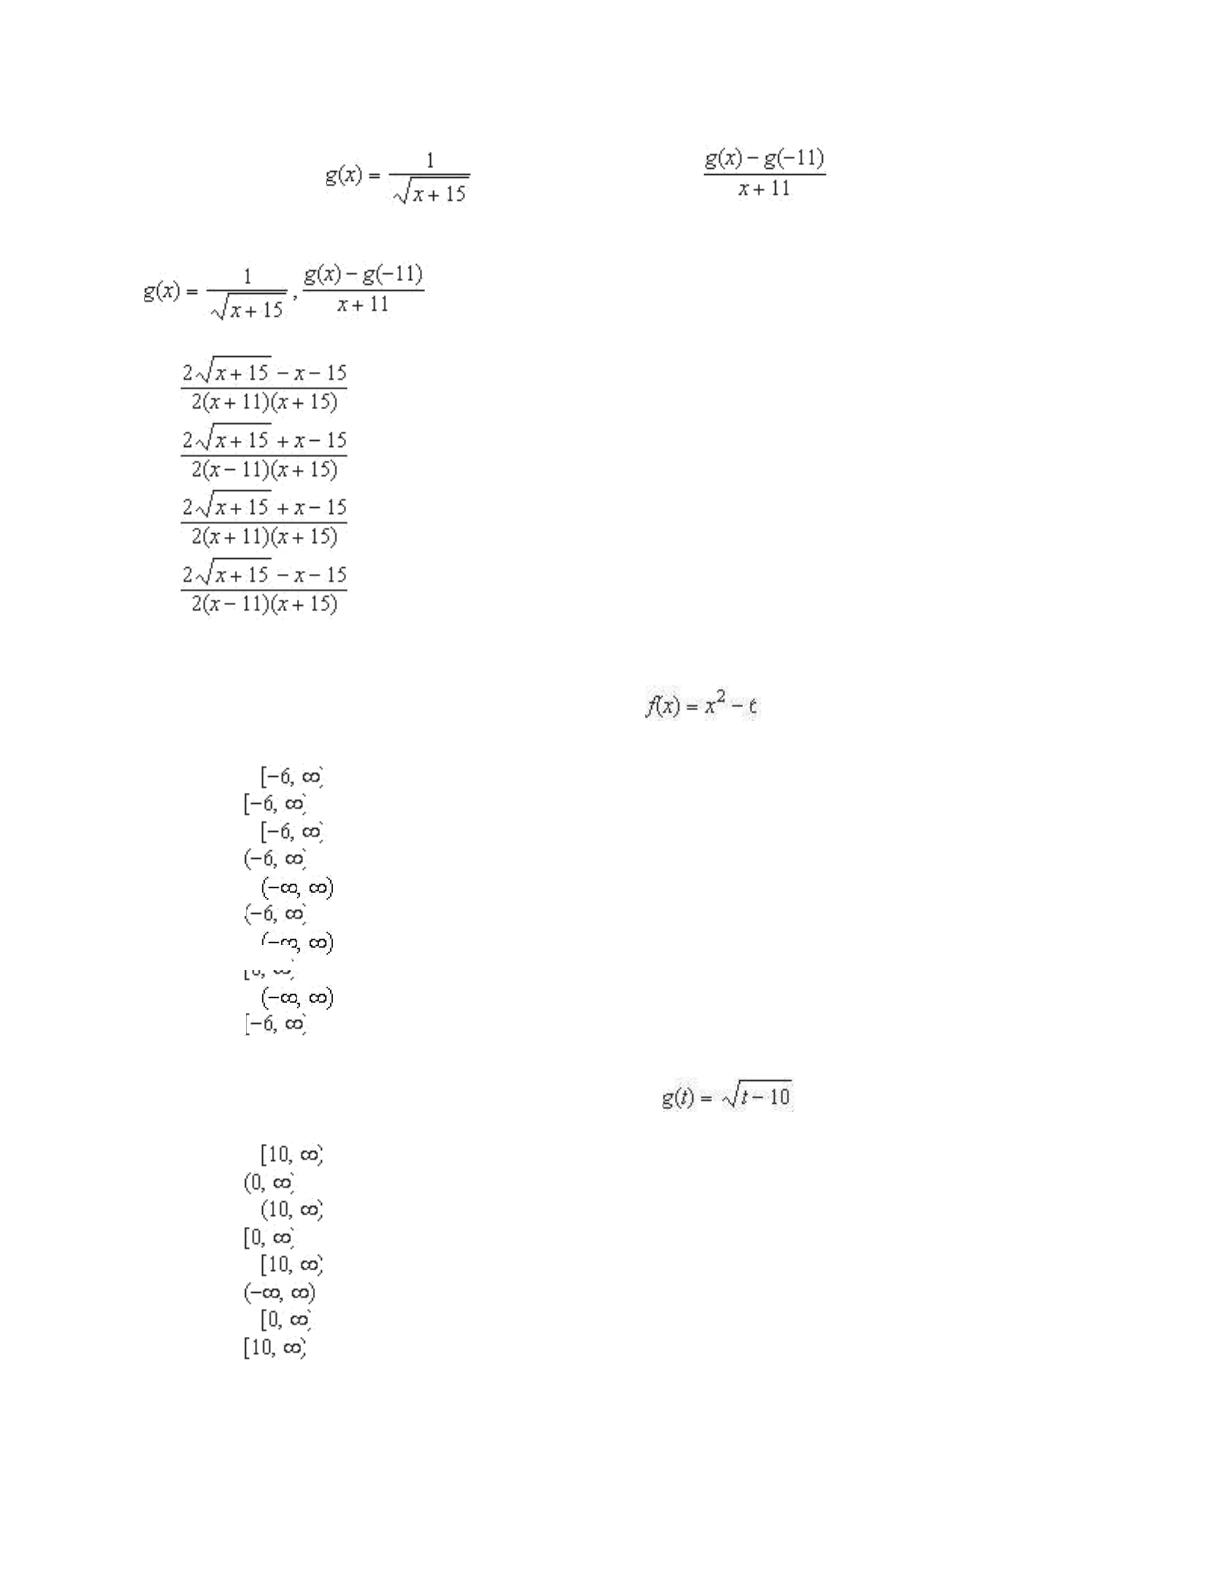
____ 5.
Let
. Evaluate the expression
and then simplify the
result.
a.
b.
c.
d.
e. undefined
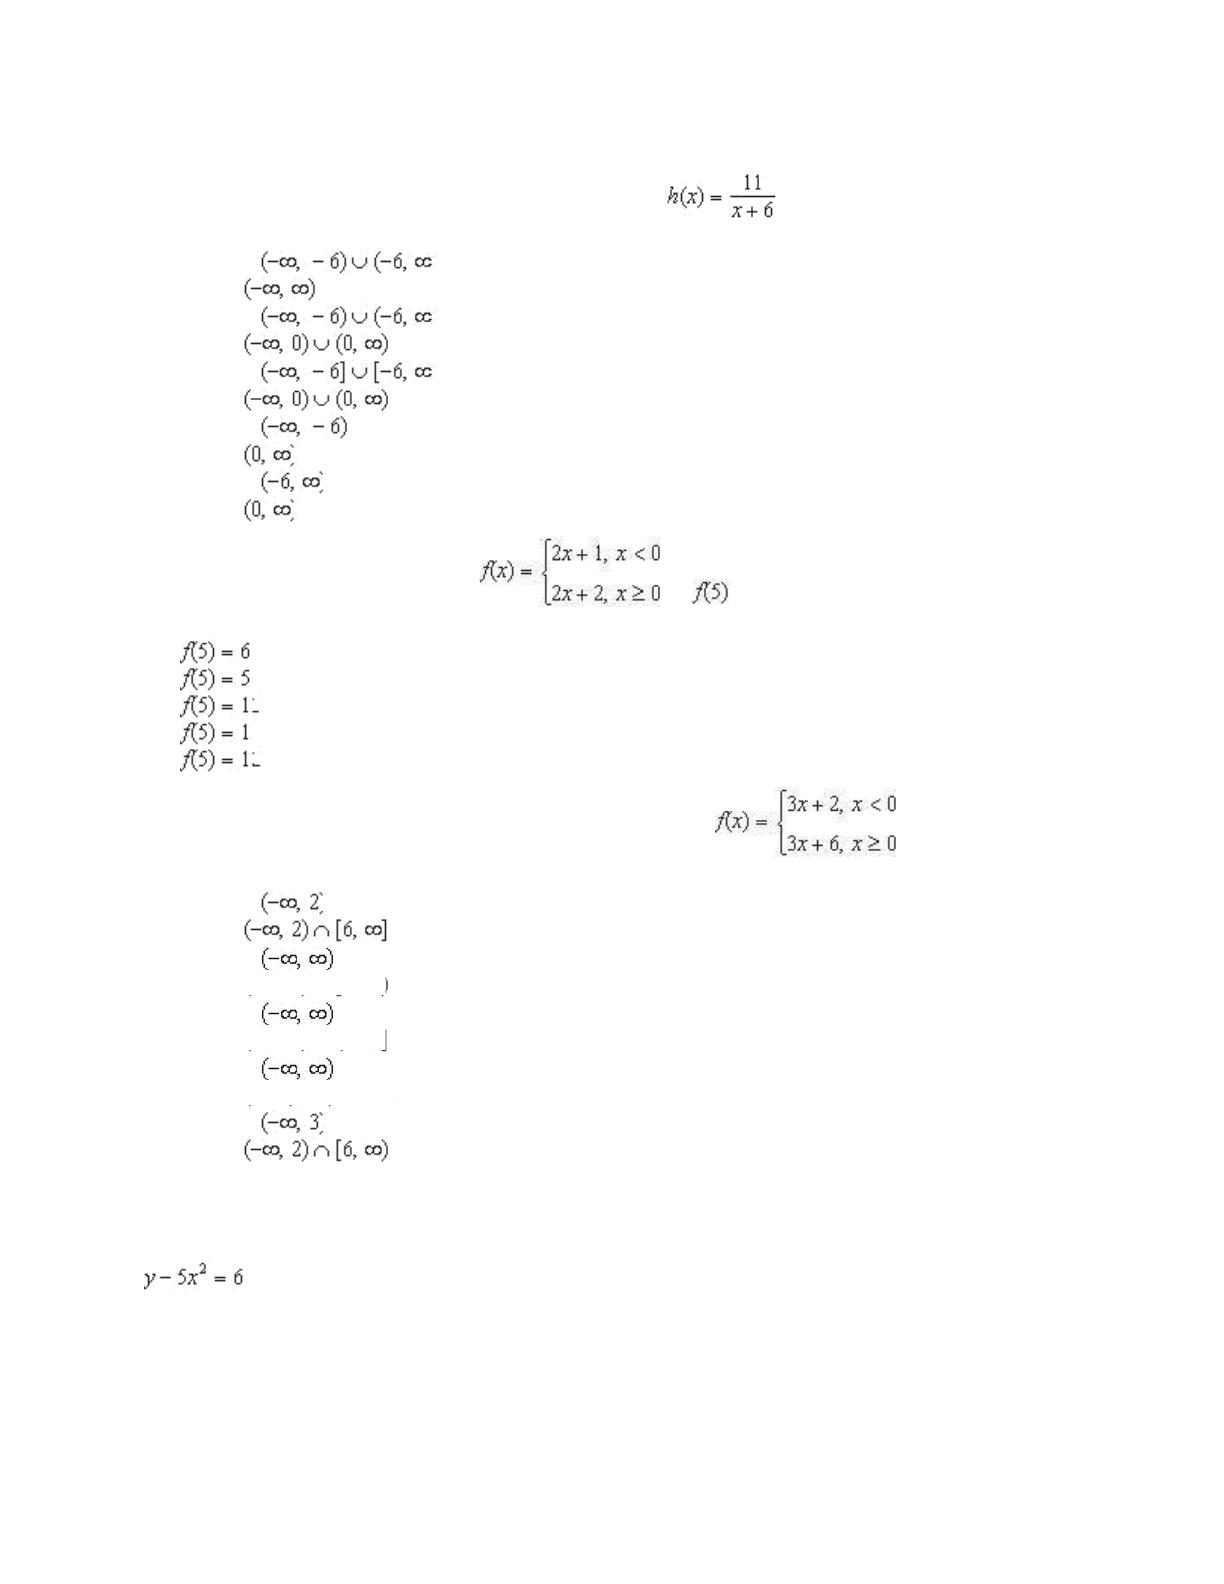
____ 6. Find the domain and range of the function .
domain:
range:
domain:
range:
domain: range:
domain:
range:
domain: range:
____ 7. Find the domain and range of the function .
domain:
range:
domain:
range:
domain:
range:
domain:
range:
none of the above
28
Chapter 1: Preparation for Calculus
____
8.
Find the domain and range of the function
.
domain:
range:
domain:
range:
domain:
range:
domain:
range:
domain:
range:
____ 9. Evaluate the function at .
a.
b.
c.
d.
e.
____ 10. Determine the domain and range of the function .
domain:
range:
domain:
range:
domain:
range:
domain:
range:
domain:
range:
____ 11. Determine whether y is a function of x.
no
yes
1.3 Functions and Their Graphs
29
____ 12. Determine whether y is a function of x.
no
Yes
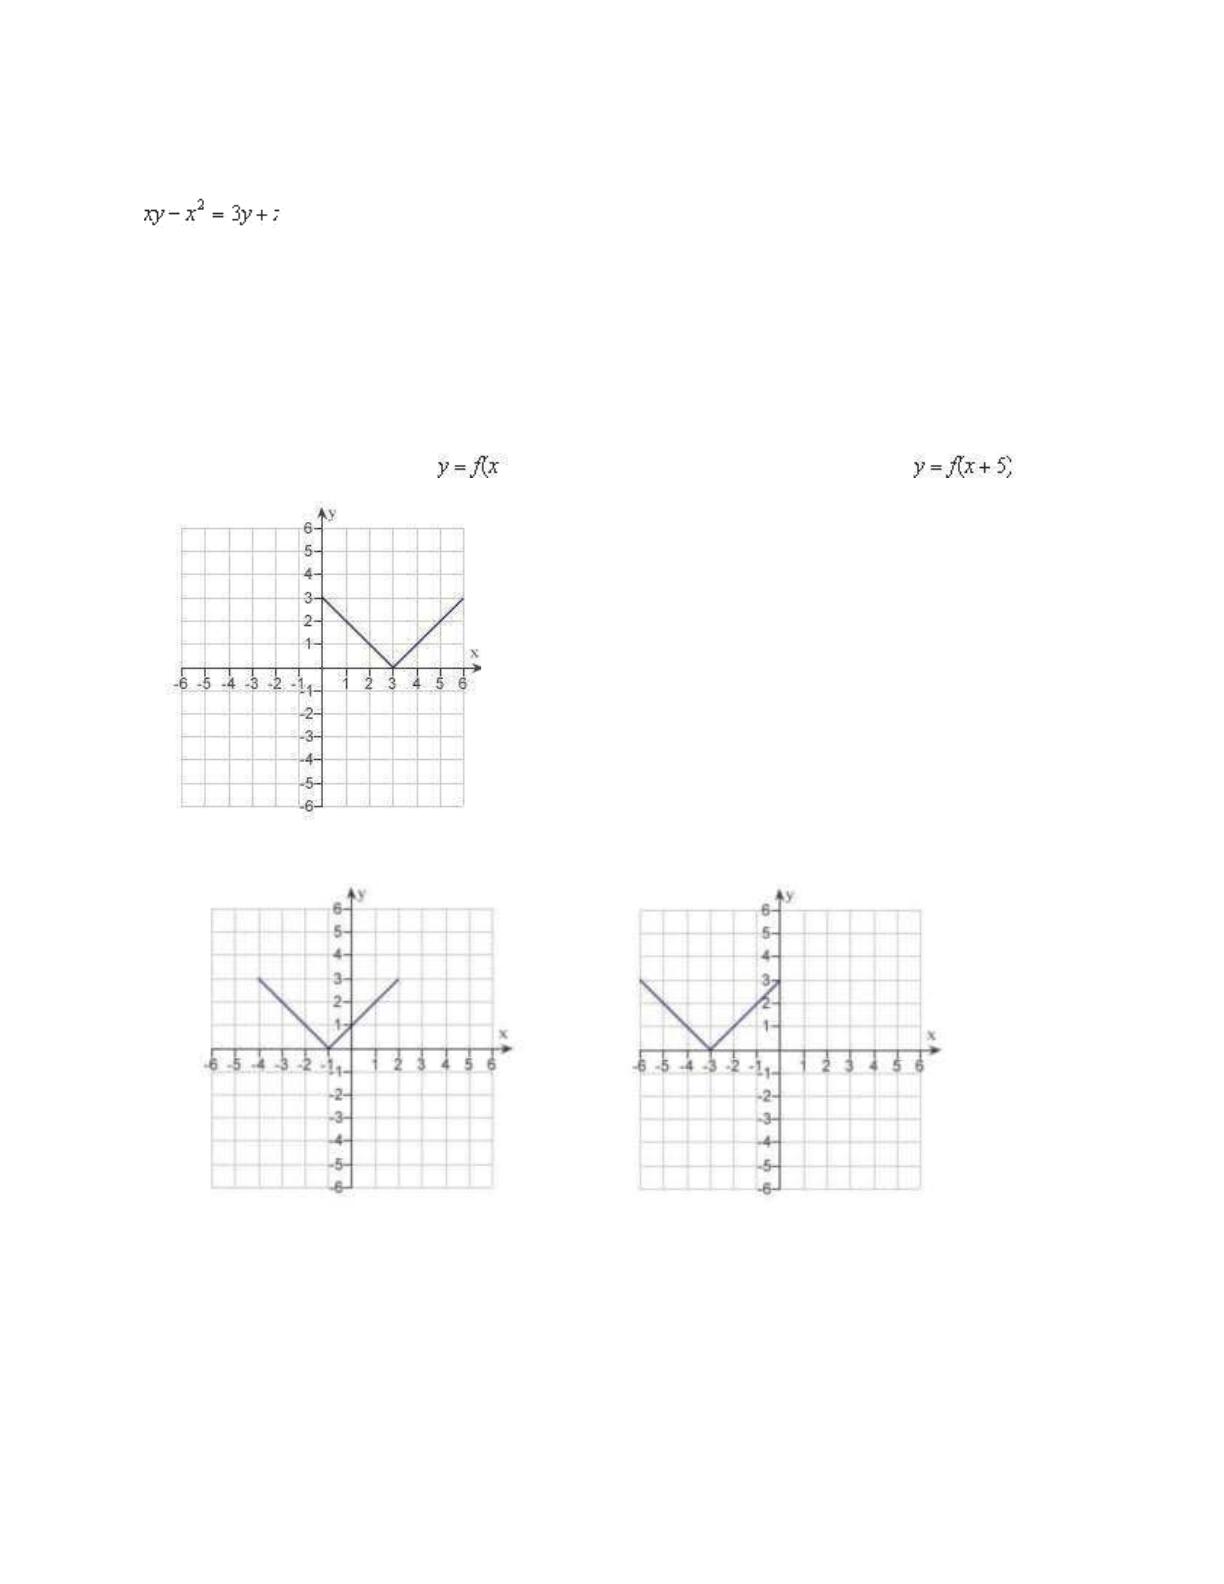
____ 13. Use the graph of given below to find the graph of the function .
a. d.
30 Chapter 1: Preparation for Calculus
b. e.
c.
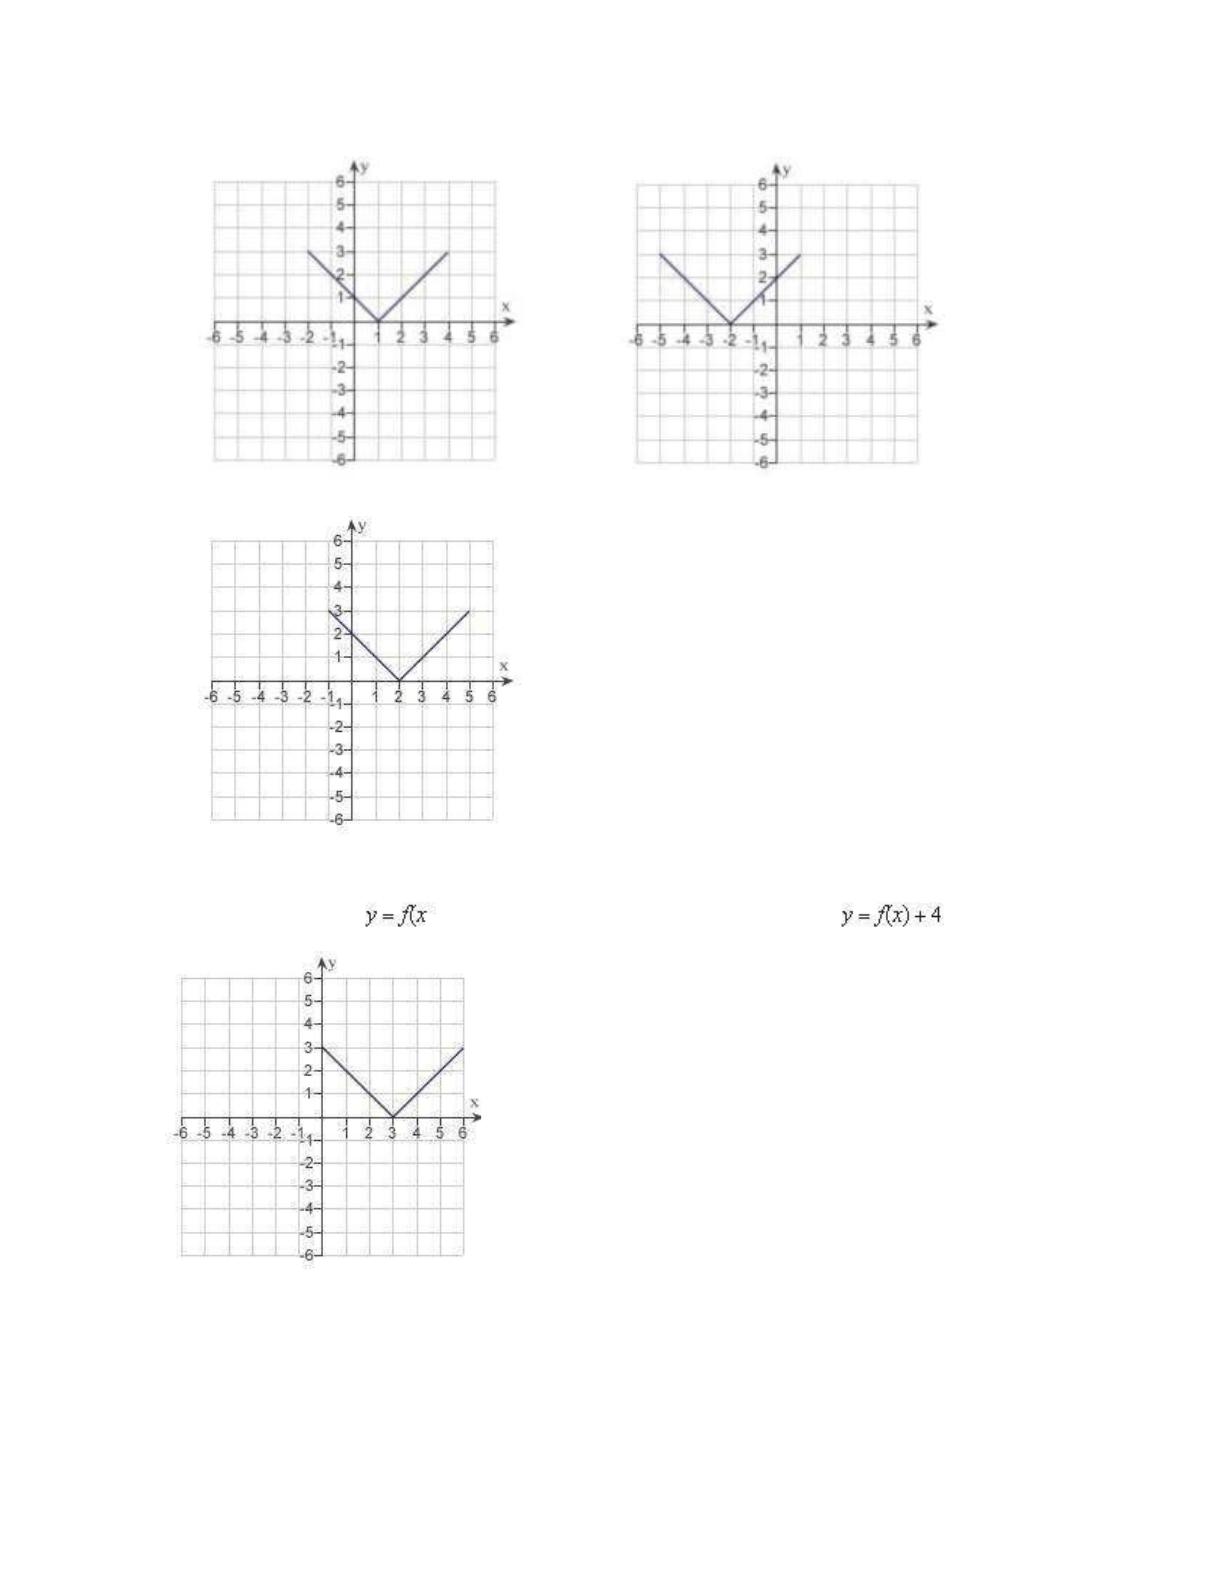
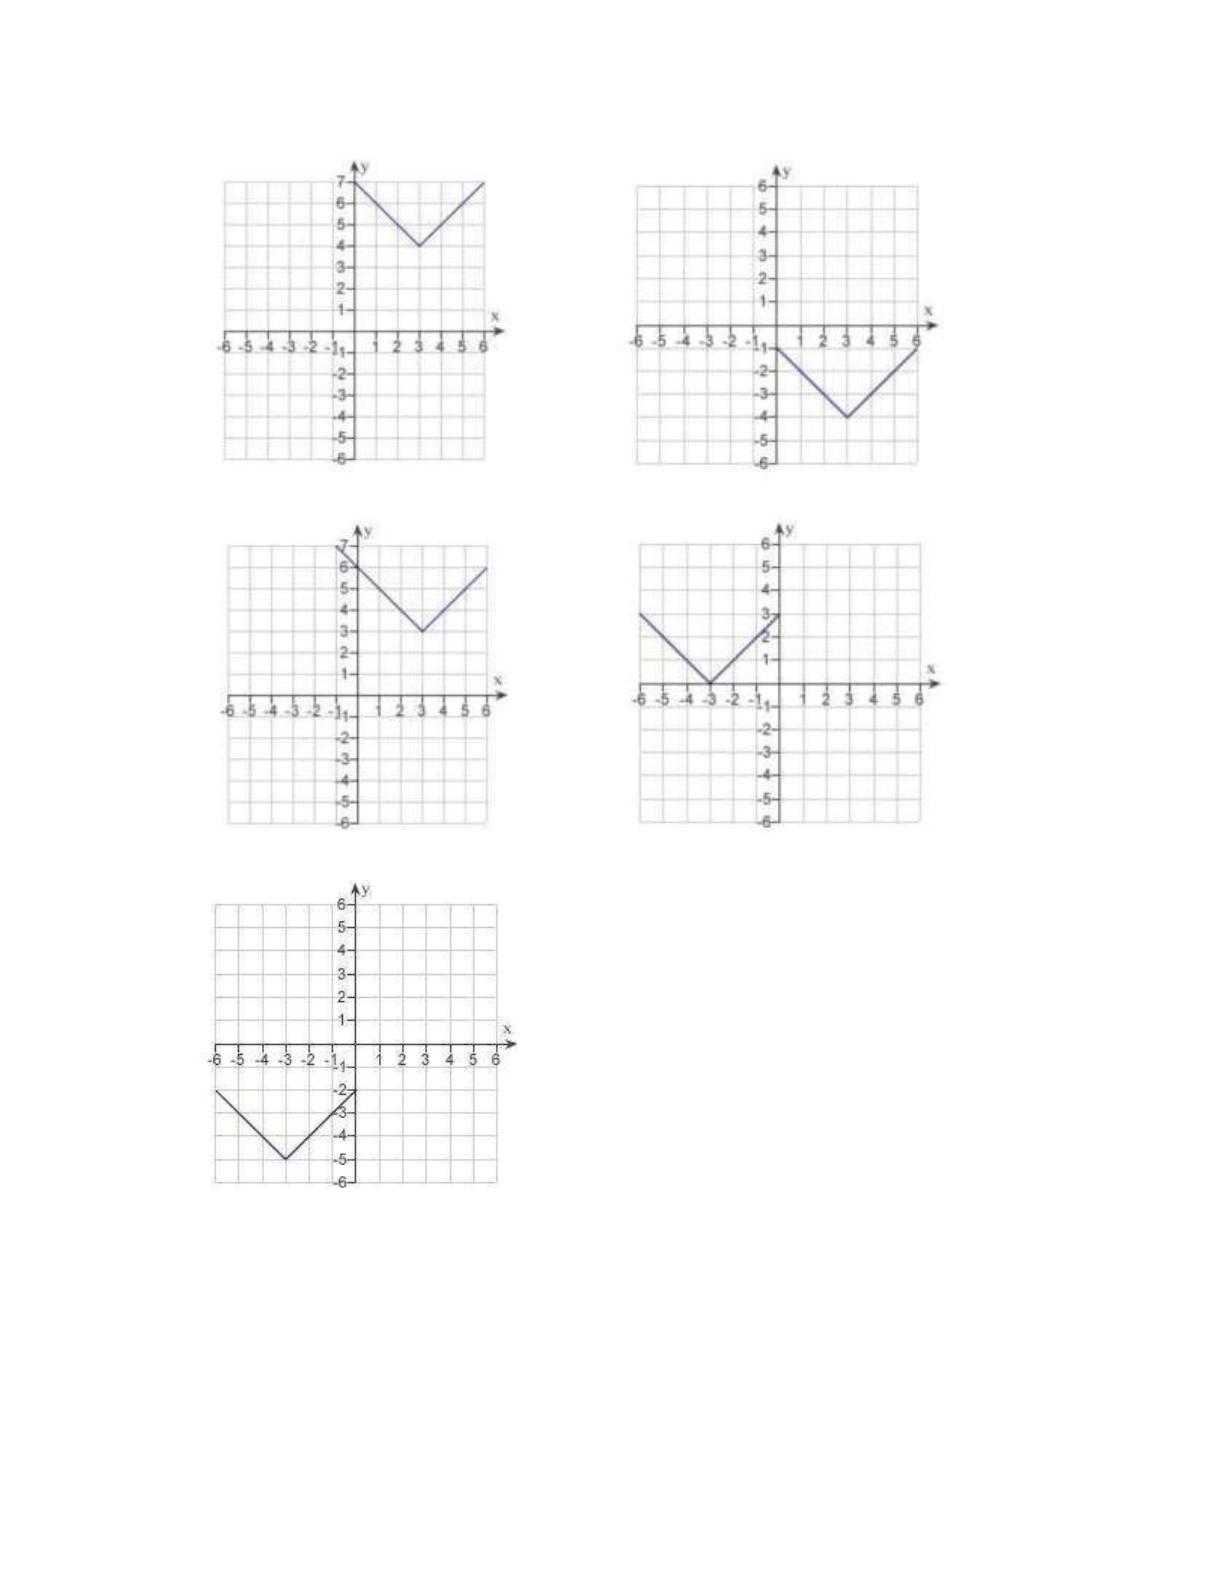
____ 14. Use the graph of given below to find the graph of the function .
1.3 Functions and Their Graphs
31
a. d.
b. e.
c.
32
Chapter 1: Preparation for Calculus
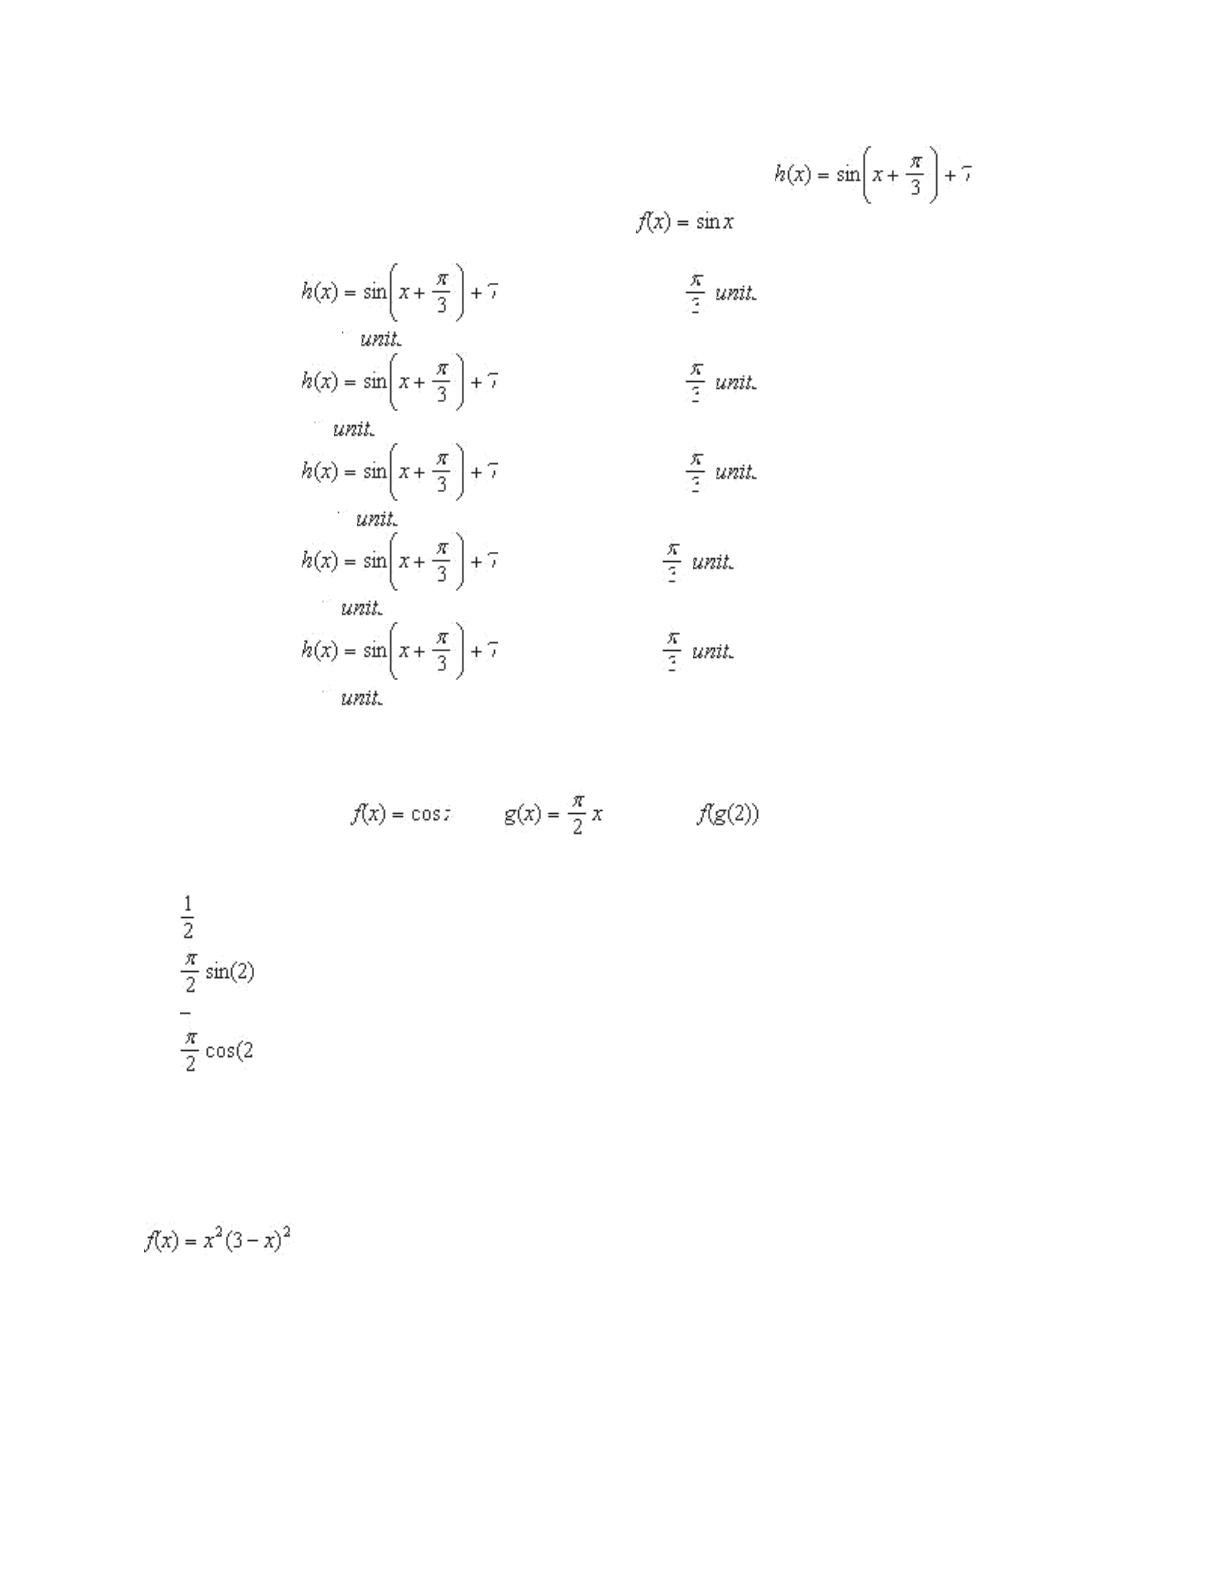
____
15.
Specify a sequence of transformations for the function
that
will yield the graph of h from the graph of the function
.
a.
The function
is a horizontal shift
to the right, followed
b.
by a vertical shift
downwards.
The function
is a horizontal shift
to the left, followed by
c.
a vertical shift
upwards.
The function
is a horizontal shift
to the left, followed by
d.
a horizontal shift
to the right.
The function
is a vertical shift
downwards, followed by a
e.
horizontal shift
to the right.
The function
is a vertical shift
upwards, followed by a
horizontal shift
to the left.
____
16.
Given
and
, evaluate
.
a.
b.
c.
d.
e.
____ 17. Determine whether the function is even, odd, or neither.
odd
even
neither
1.3 Functions and Their Graphs
33
____ 18. Determine whether the function is even, odd, or neither.
even
odd
neither
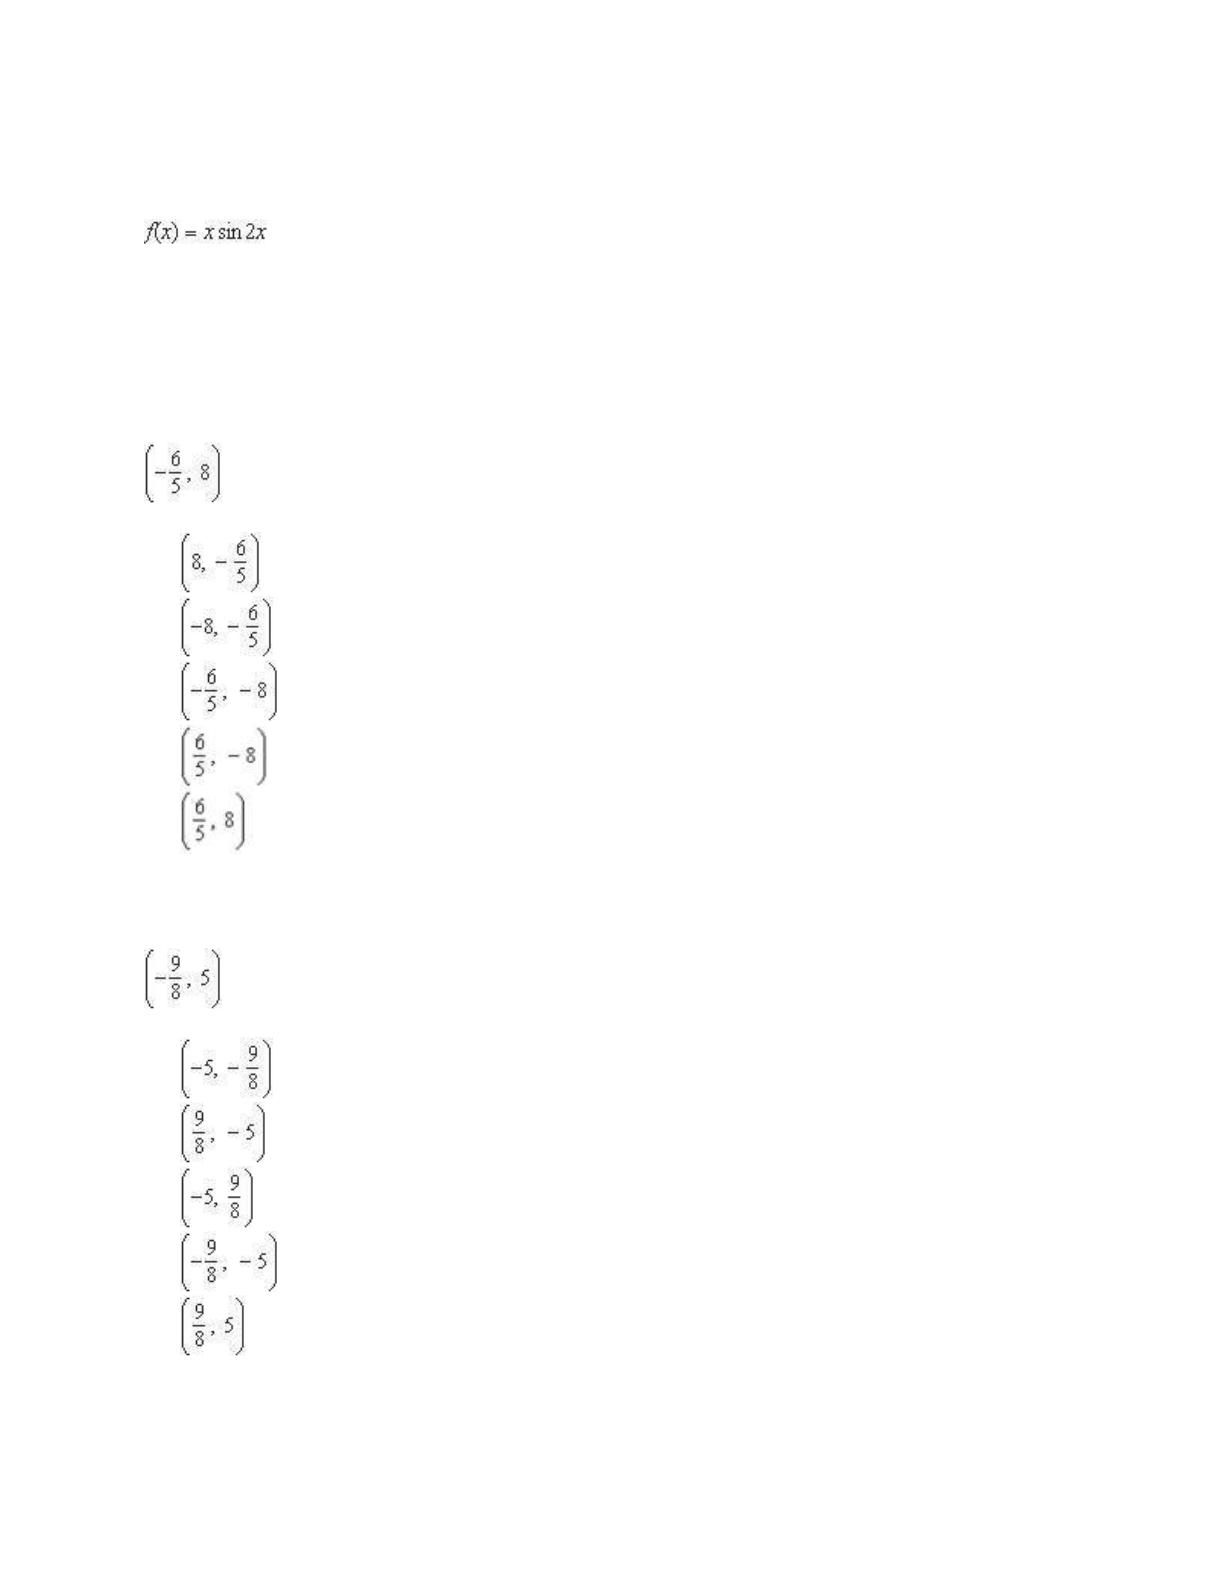
____ 19. Find the coordinates of a second point on the graph of a function f if the given point
is on the graph and the function is even.
a.
b.
c.
d.
e.
____ 20. Find the coordinates of a second point on the graph of a function f if the given point
is on the graph and the function is odd.
a.
b.
c.
d.
e.
34
Chapter 1: Preparation for Calculus
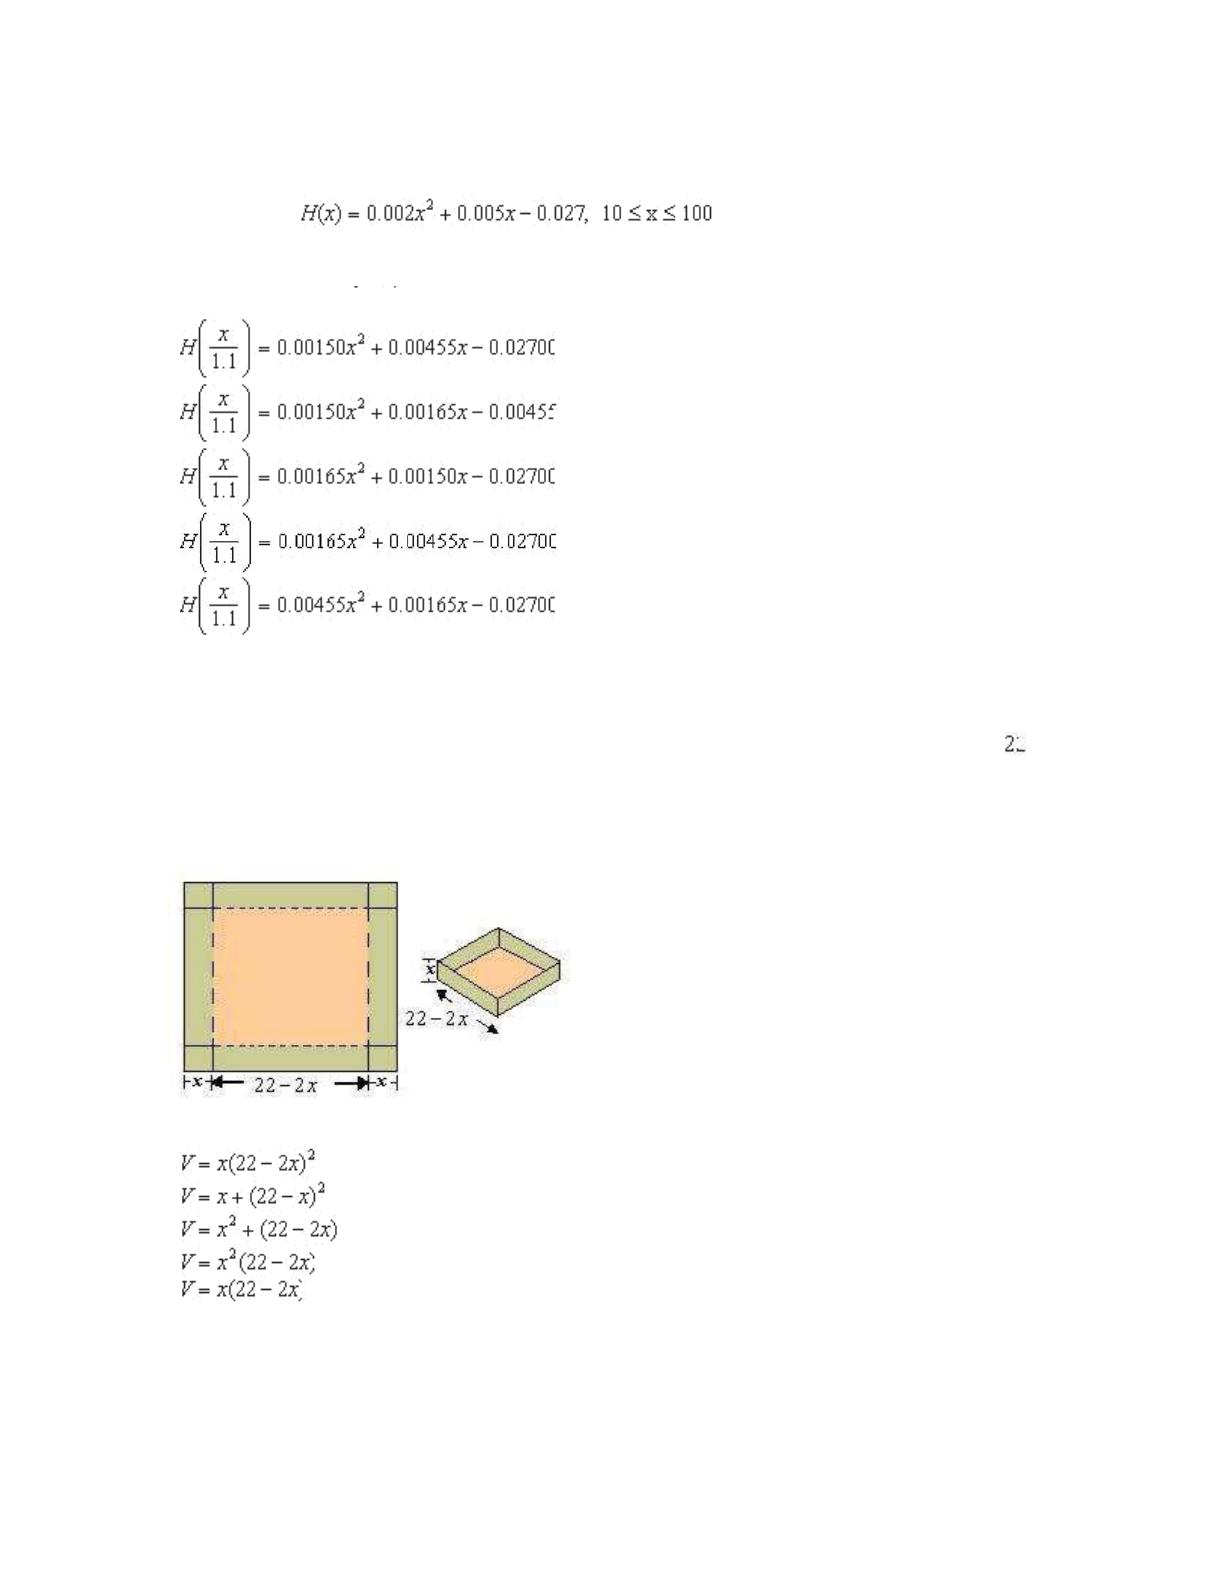
____
21.
The horsepower H required to overcome wind drag on a certain automobile is
approximated by
where x is the speed of the car in
miles per hour. Find . Round the numerical values in your answer to five decimal places.
a.
b.
c.
d.
e.
____ 22. An open box of maximum volume is to be made from a square piece of material
centimeters on a side by cutting equal squares from the corners and turning up the sides (see
figure). Write the volume V as a function of x, the length of the corner squares.
a.
b.
c.
d.
e.
1.3 Functions and Their Graphs
35
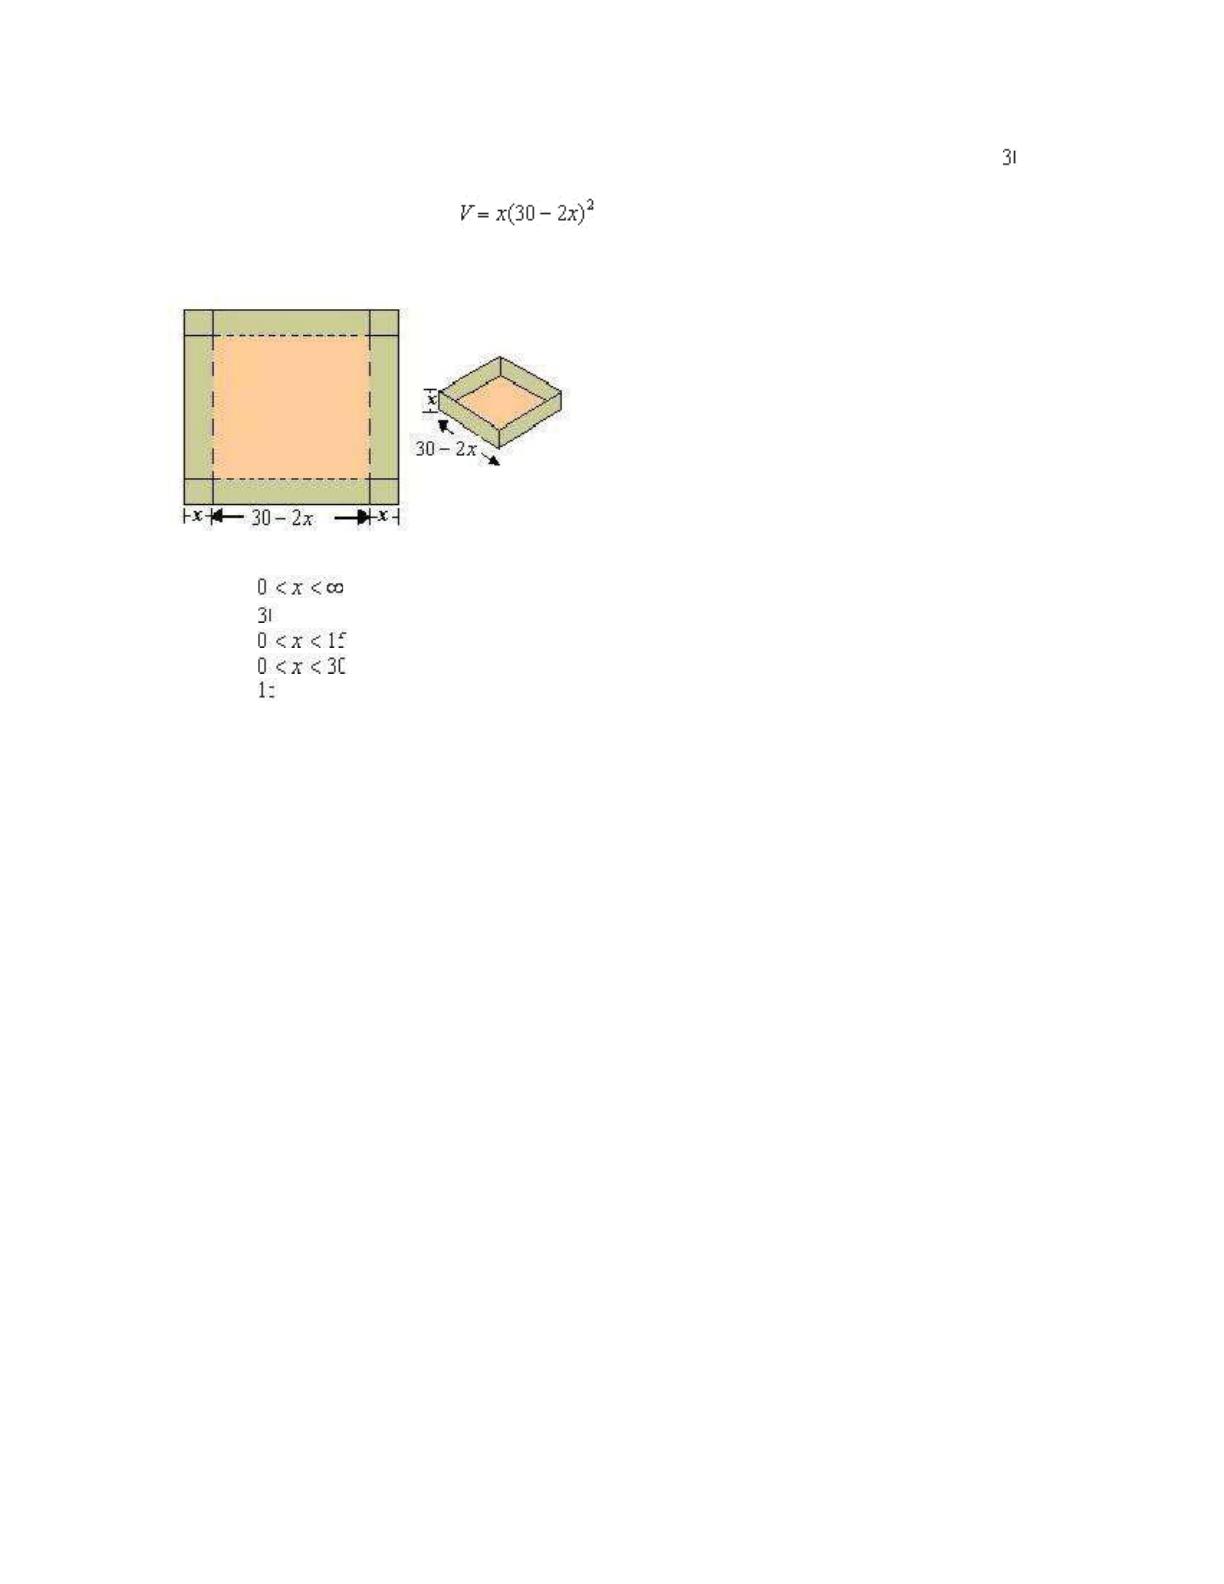
____ 23.
An open box of maximum volume is to be made from a square piece of material
centimeters on a side by cutting equal squares from the corners and turning up the sides(see figure).
What is the domain of the function
.
domain:
domain:
domain:
domain:
domain:
36 Chapter 1: Preparation for Calculus
1.3 Functions and Their Graphs
Answer Section

1.3 Functions and Their Graphs
37
38 Chapter 1: Preparation for Calculus
1.4 Fitting Models to Data
Multiple Choice
Identify the choice that best completes the statement or answers the question.
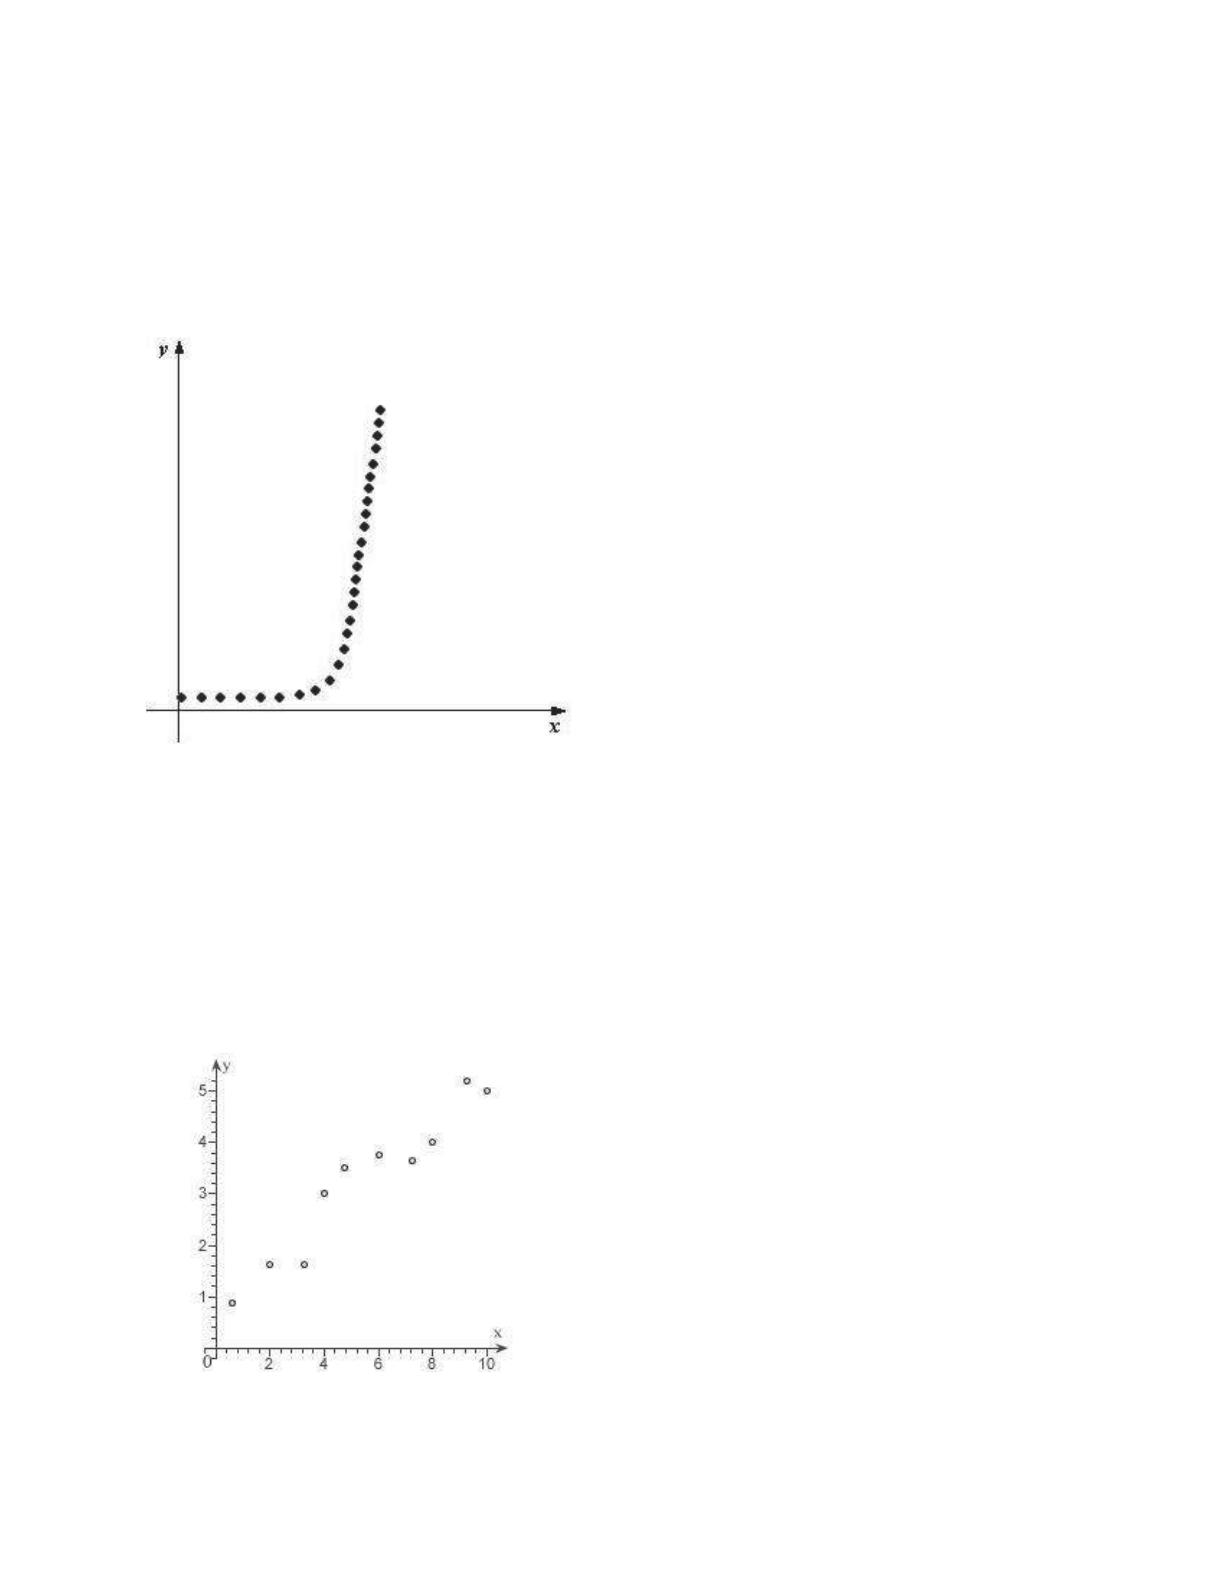
____ 1. Determine which type of function would be most appropriate to fit the given data.
exponential
linear
quadratic
no relationship
trigonometric
____ 2. Which function below would be most appropriate model for the given data?
1.4 Fitting Models to Data
39
no apparent relationship between x and y
trigonometric
quadratic
linear
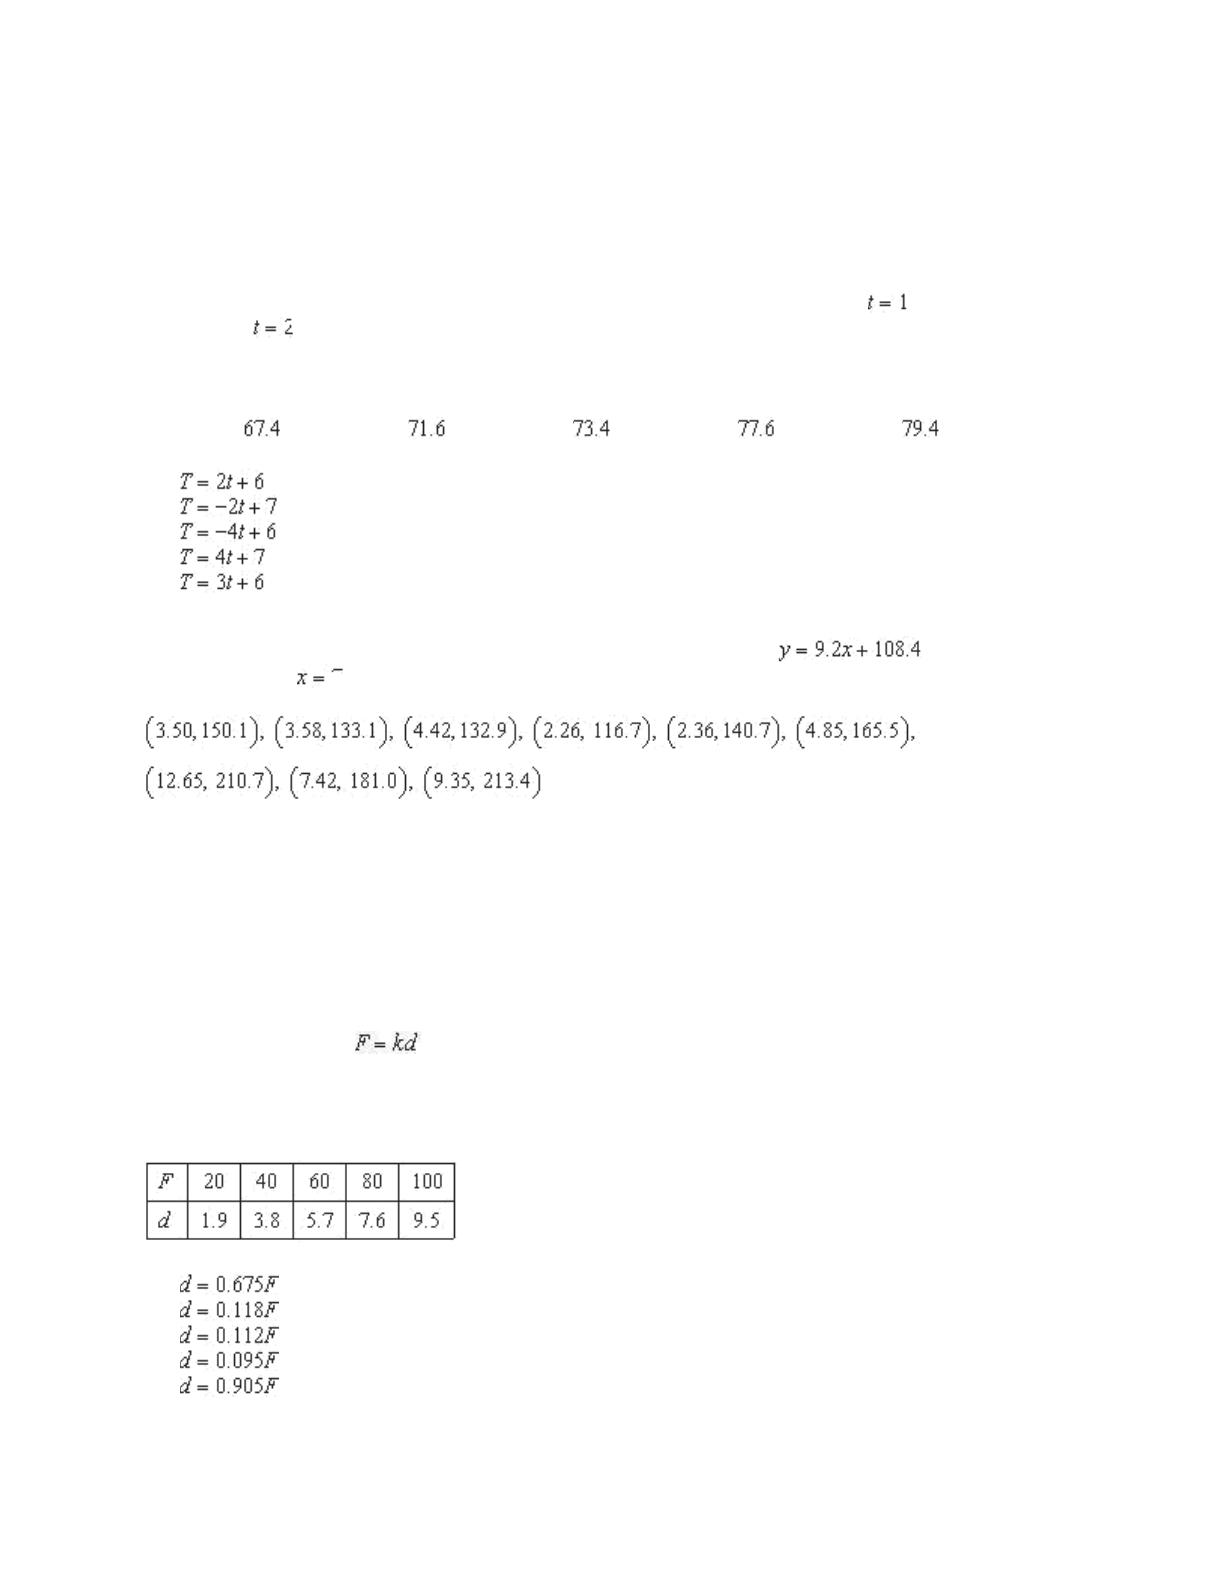
____ 3.
The following ordered pairs represent temperatures in degrees Fahrenheit taken each
hour from 1:00 pm until 5:00 pm. Let T be temperature, and let t be time, where
corresponds
to 1:00 pm,
corresponds to 2:00 pm, and so on. Plot the data. Visually find a linear model for
the data and find its equation. From the visual linear model that you created, determine which of
the models that follow appears to best approximate the data.
(1:00 pm ,
), (2:00 pm ,
), (3:00 pm ,
), (4:00 pm ,
), (5:00 pm ,
)
a.
b.
c.
d.
e.
____ 4.
Each ordered pair gives the exposure index x of a carcinogenic substance and the
cancer mortality y per 100,000 people in the population. Use the model
to
approximate y if
. Round your answer to one decimal place.
168.2
163.6
182.0
172.8
177.4
____ 5. Hooke’s Law states that the force F required to compress or stretch a spring (within its
elastic limits) is proportional to the distance d that the spring is compressed or stretched from its
original length. That is, where k is a measure of the stiffness of the spring and is called the
spring constant. The table shows the elongation d in centimeters of a spring when a force of F
newtons is applied. Use the regression capabilities of a graphing utility to find a linear model for
the data. Round the numerical values in your answer to three decimal places.
a.
b.
c.
d.
e.
40
Chapter 1: Preparation for Calculus
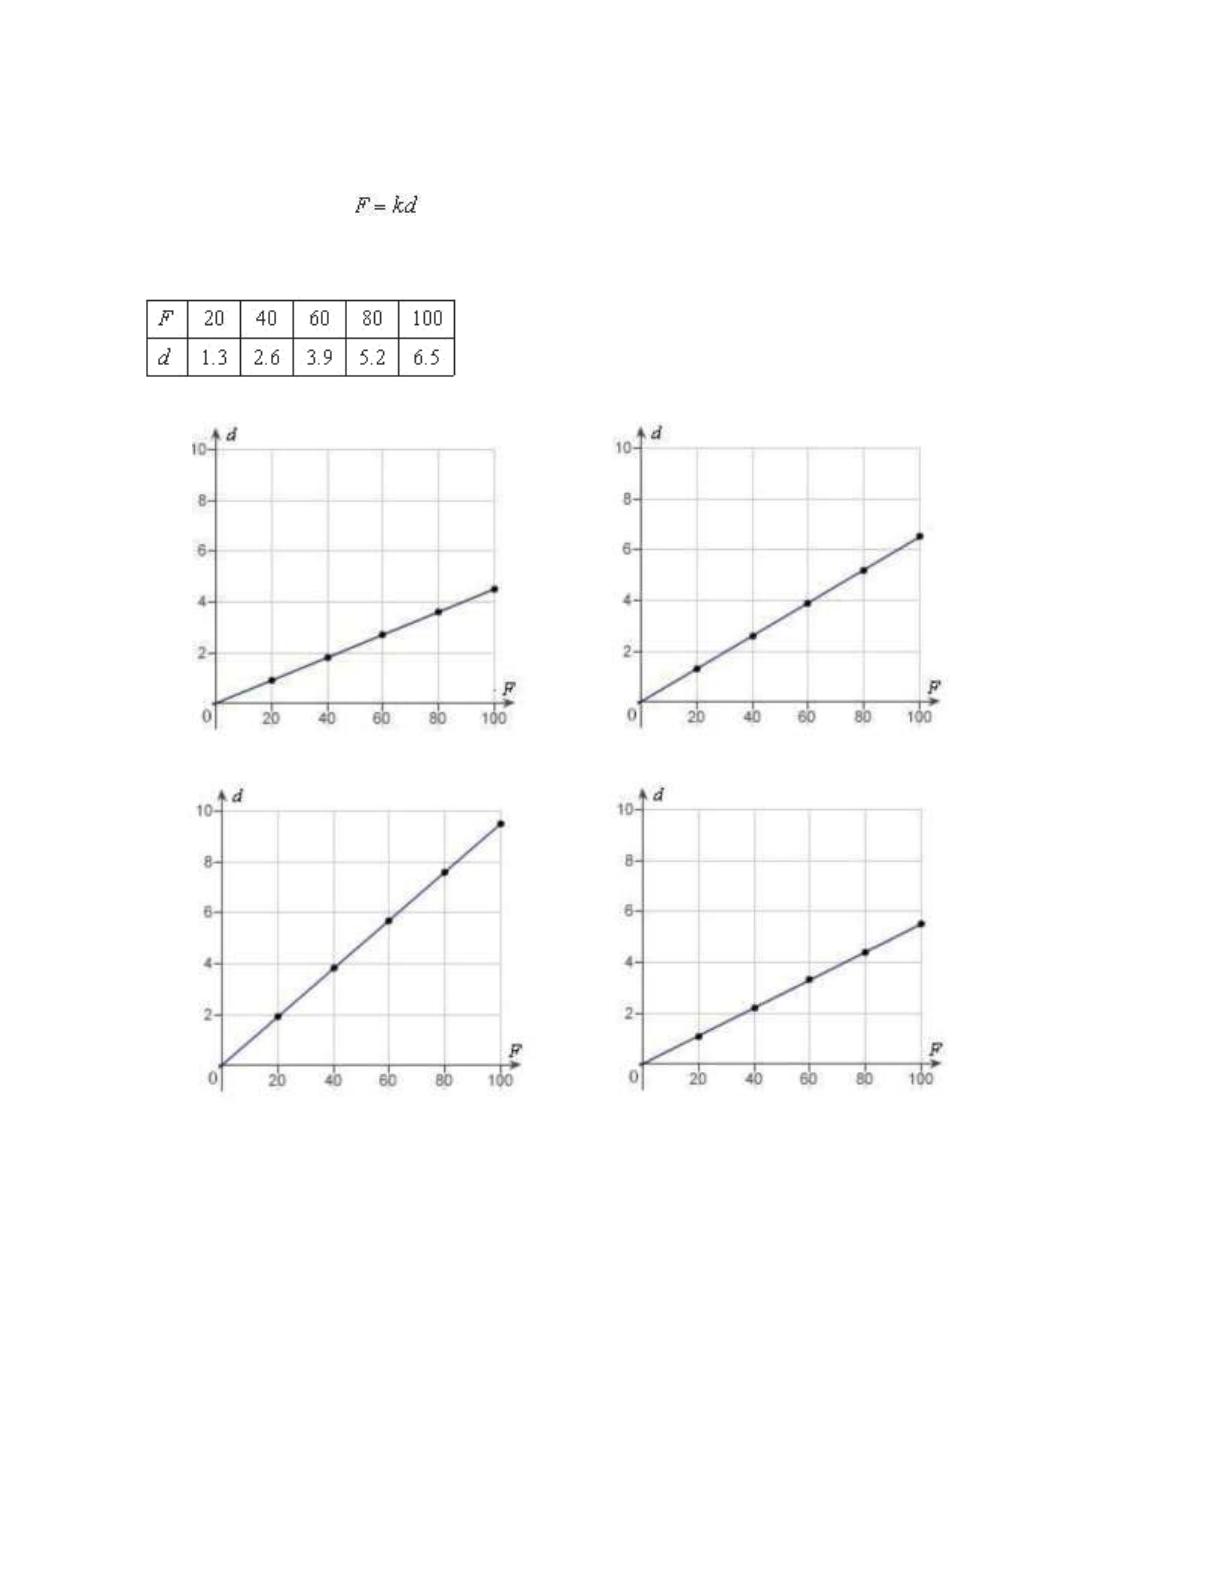
____
6.
Hooke’s Law states that the force F required to compress or stretch a spring (within
its elastic limits) is proportional to the distance d that the spring is compressed or stretched from its
original length. That is, where k is a measure of the stiffness of the spring and is called the
spring constant. The table shows the elongation d in centimeters of a spring when a force of F
newtons is applied. Use a graphing utility to plot the data and graph the linear model.
a. d.
b. e.