Unlock document.
This document is partially blurred.
Unlock all pages and 1 million more documents.
Get Access
68.
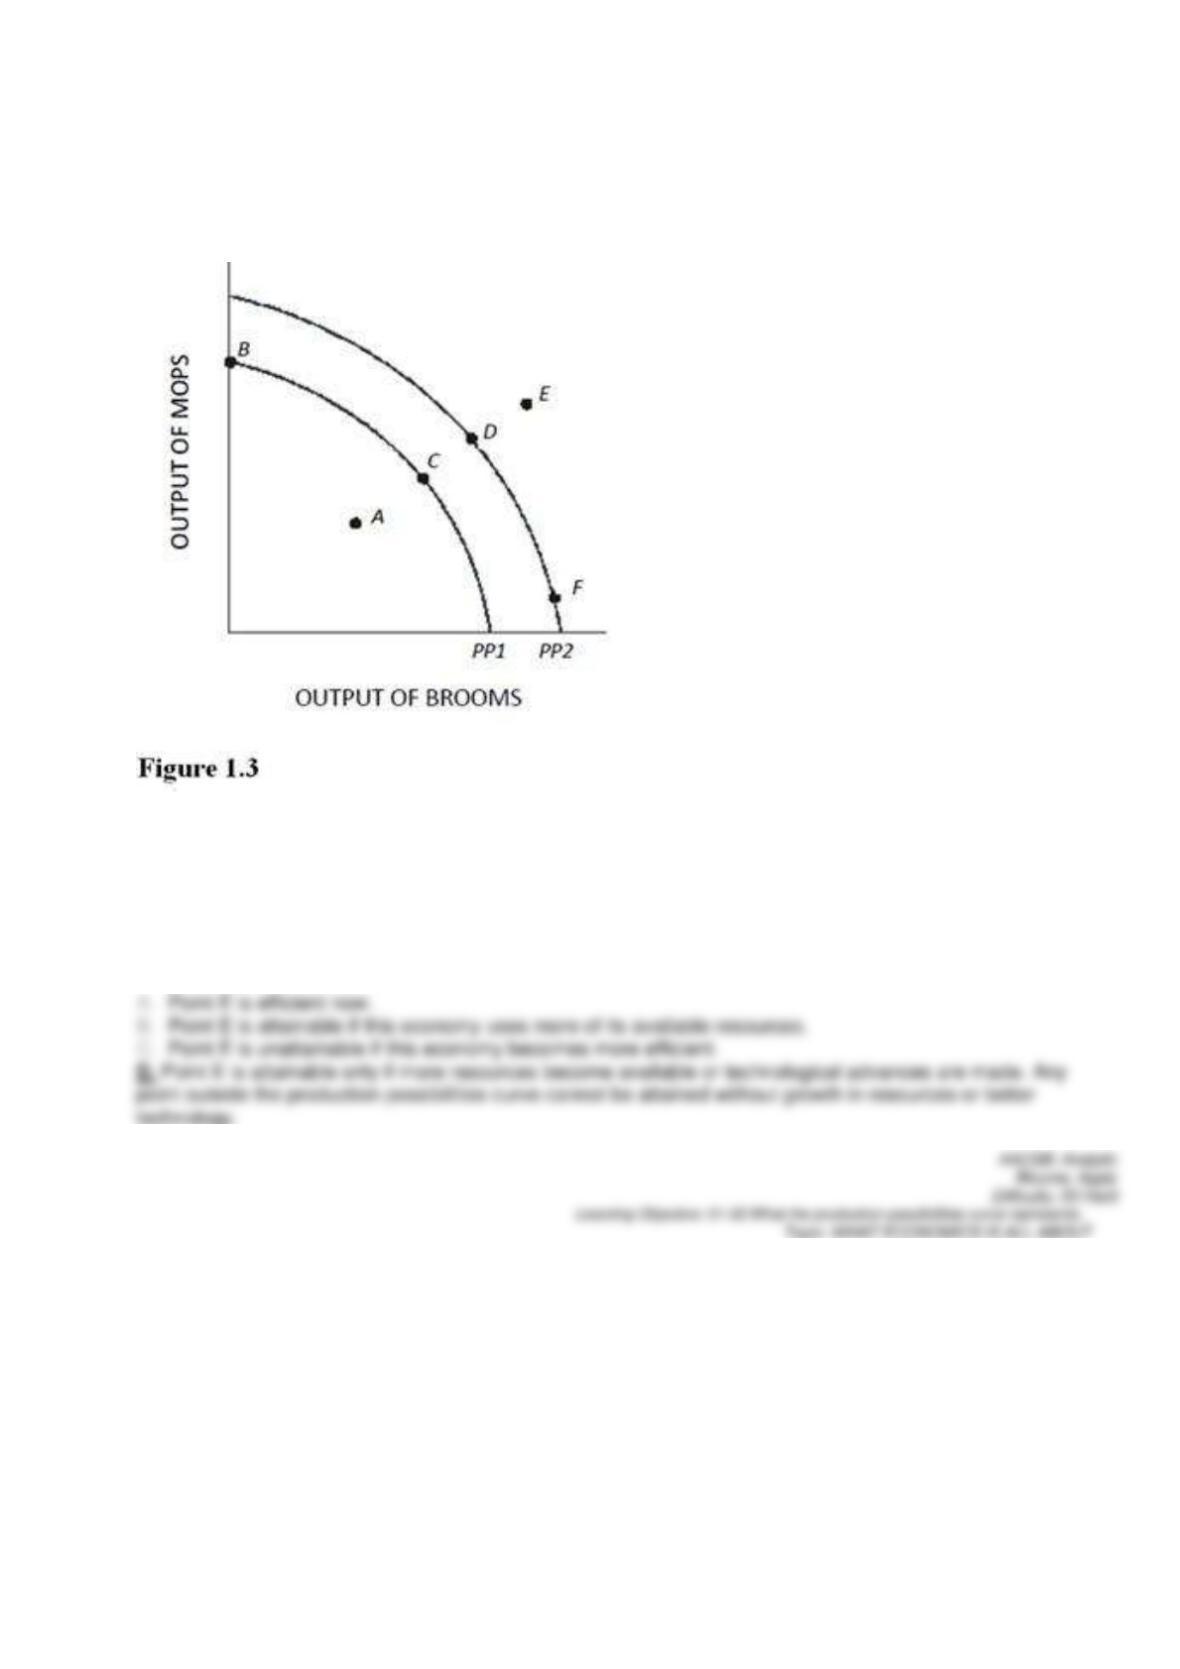
Which of the following is true about the combination of mops and brooms represented by point E in Figure
1.3 and using PP1?
69.
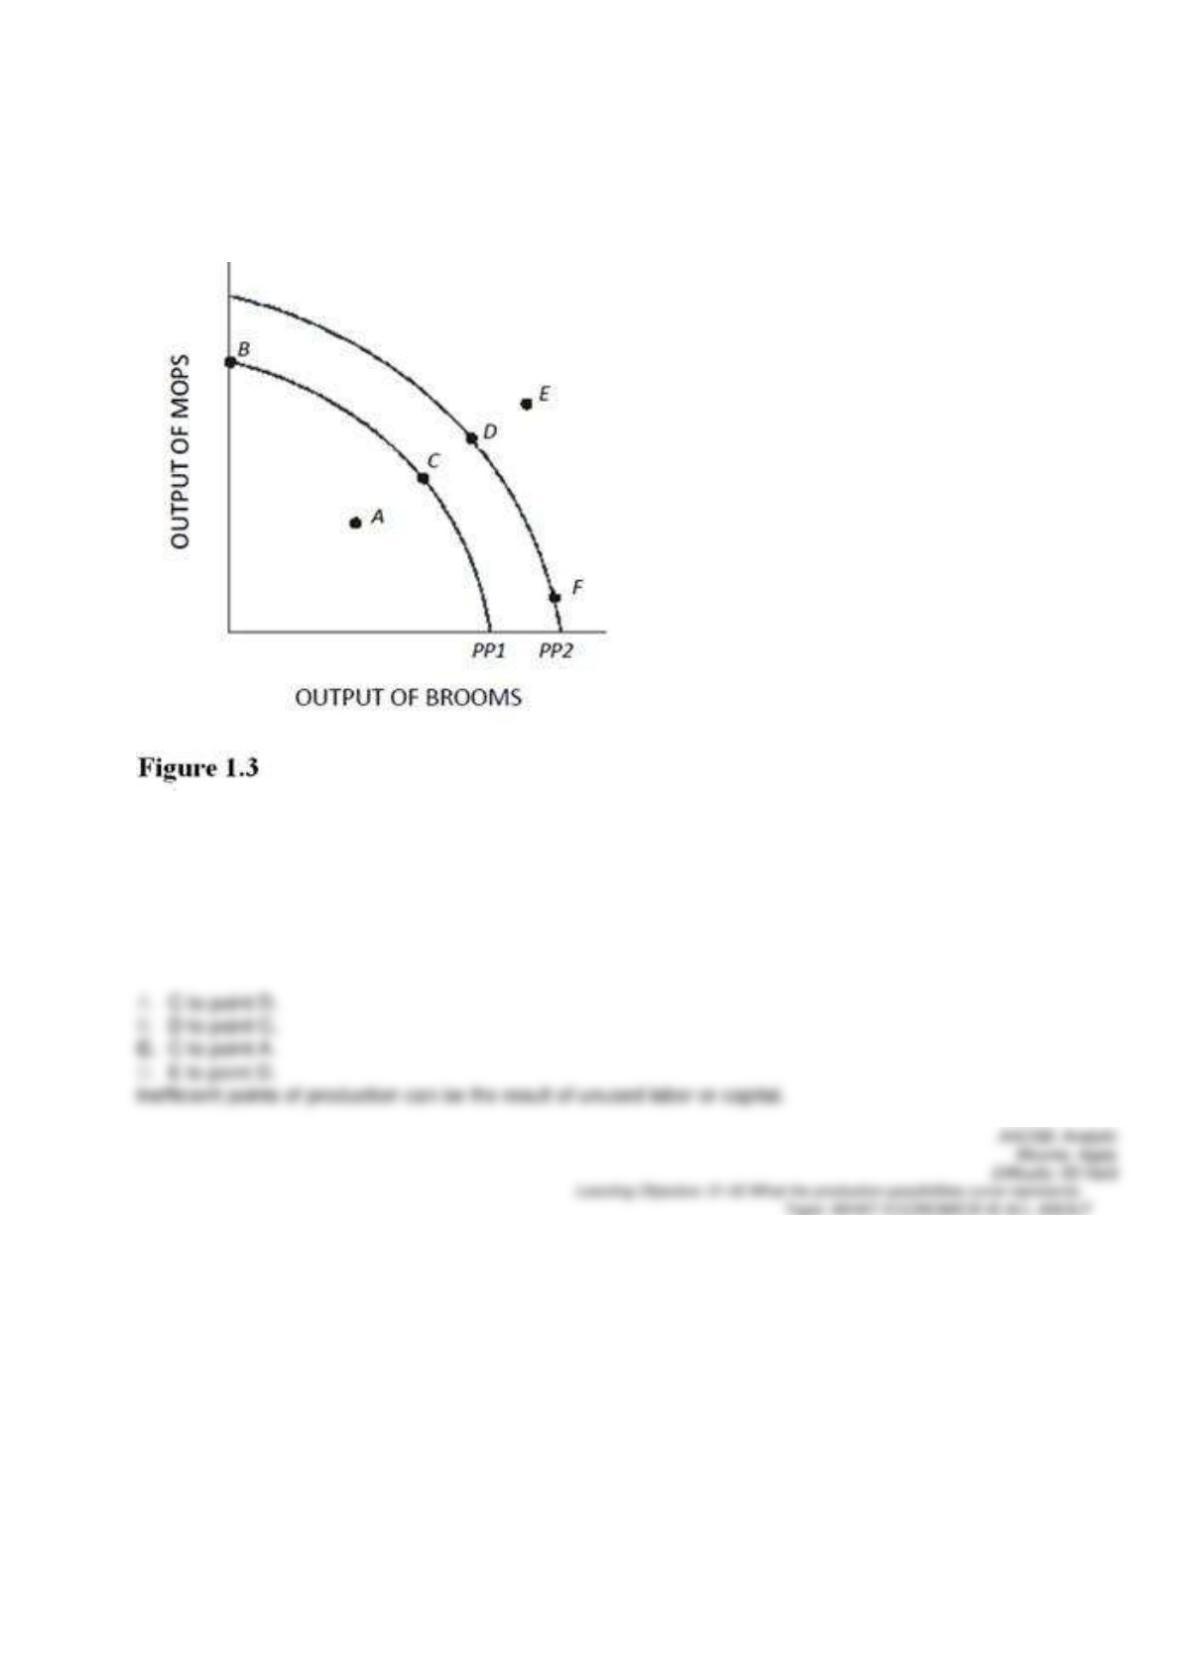
An increase in the proportion of the population that is unemployed above the normal rate is best represented in
Figure 1.3 and using PP1 by a movement from point
70.
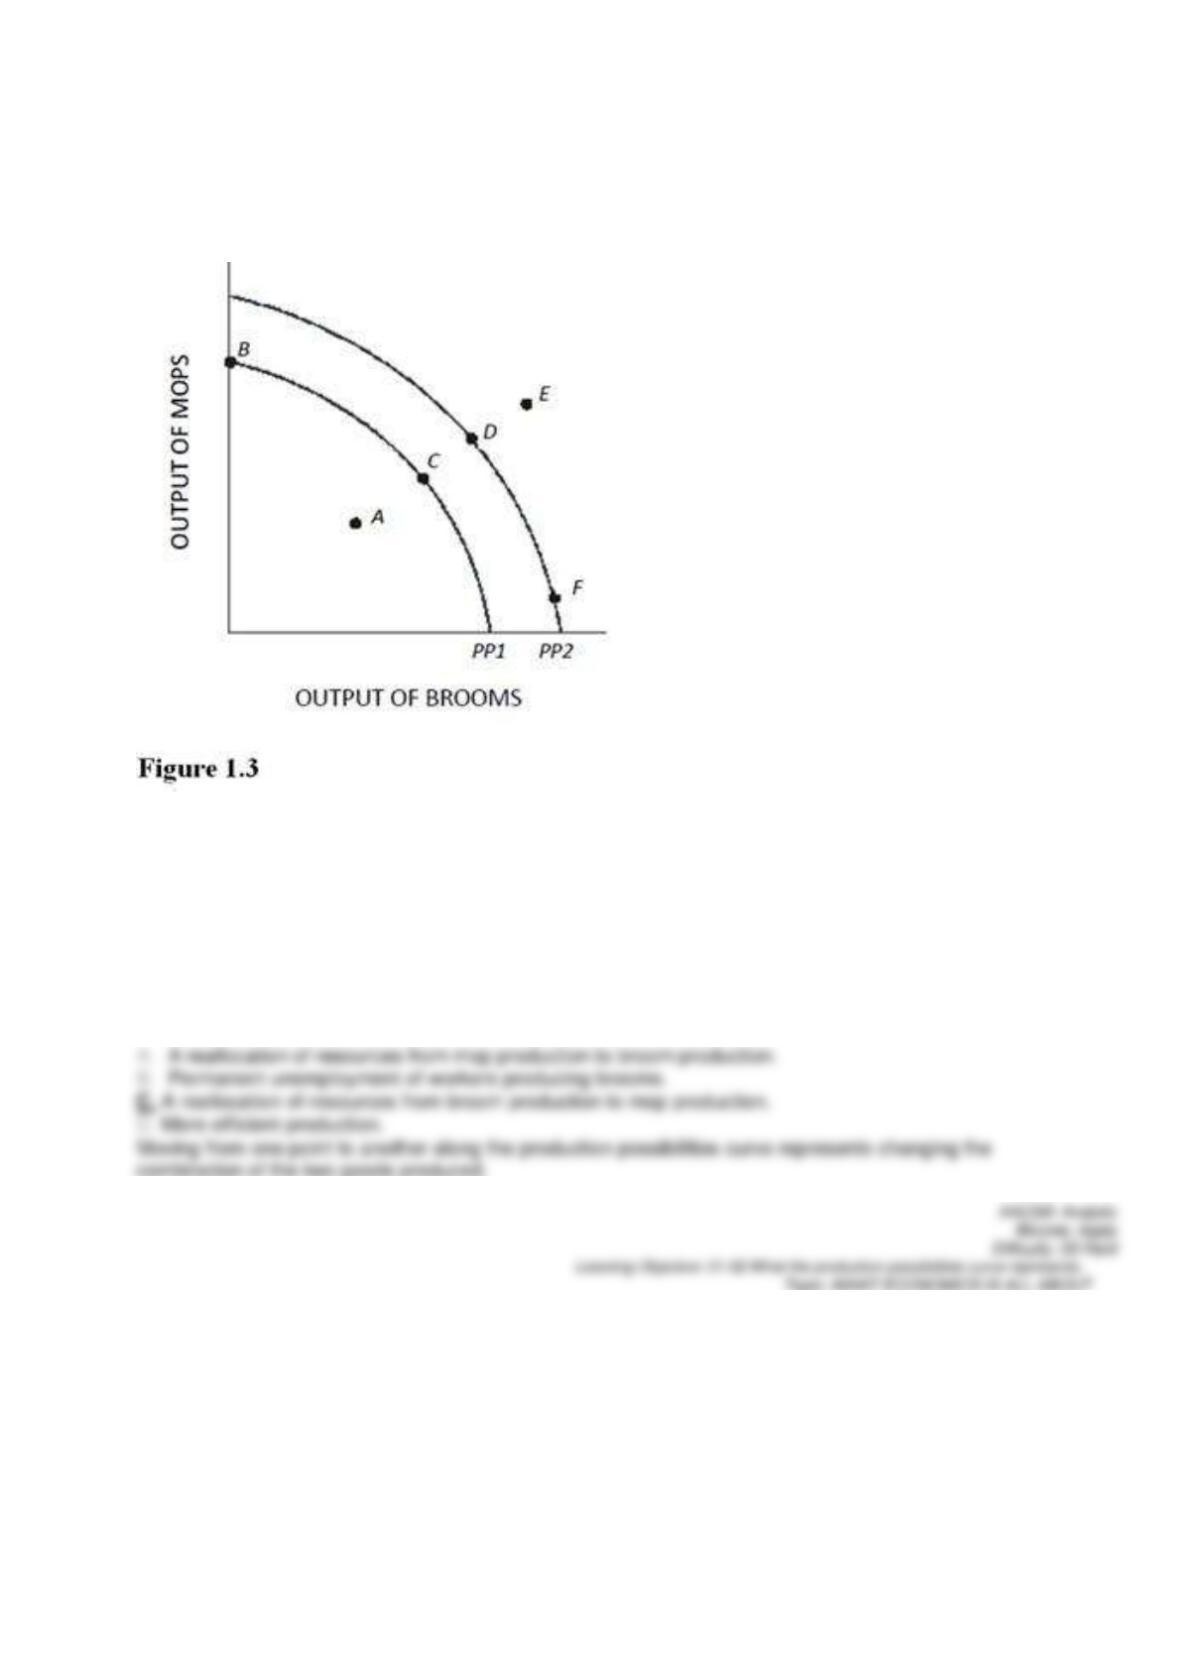
A movement from point F to point D in Figure 1.3 results in
71.
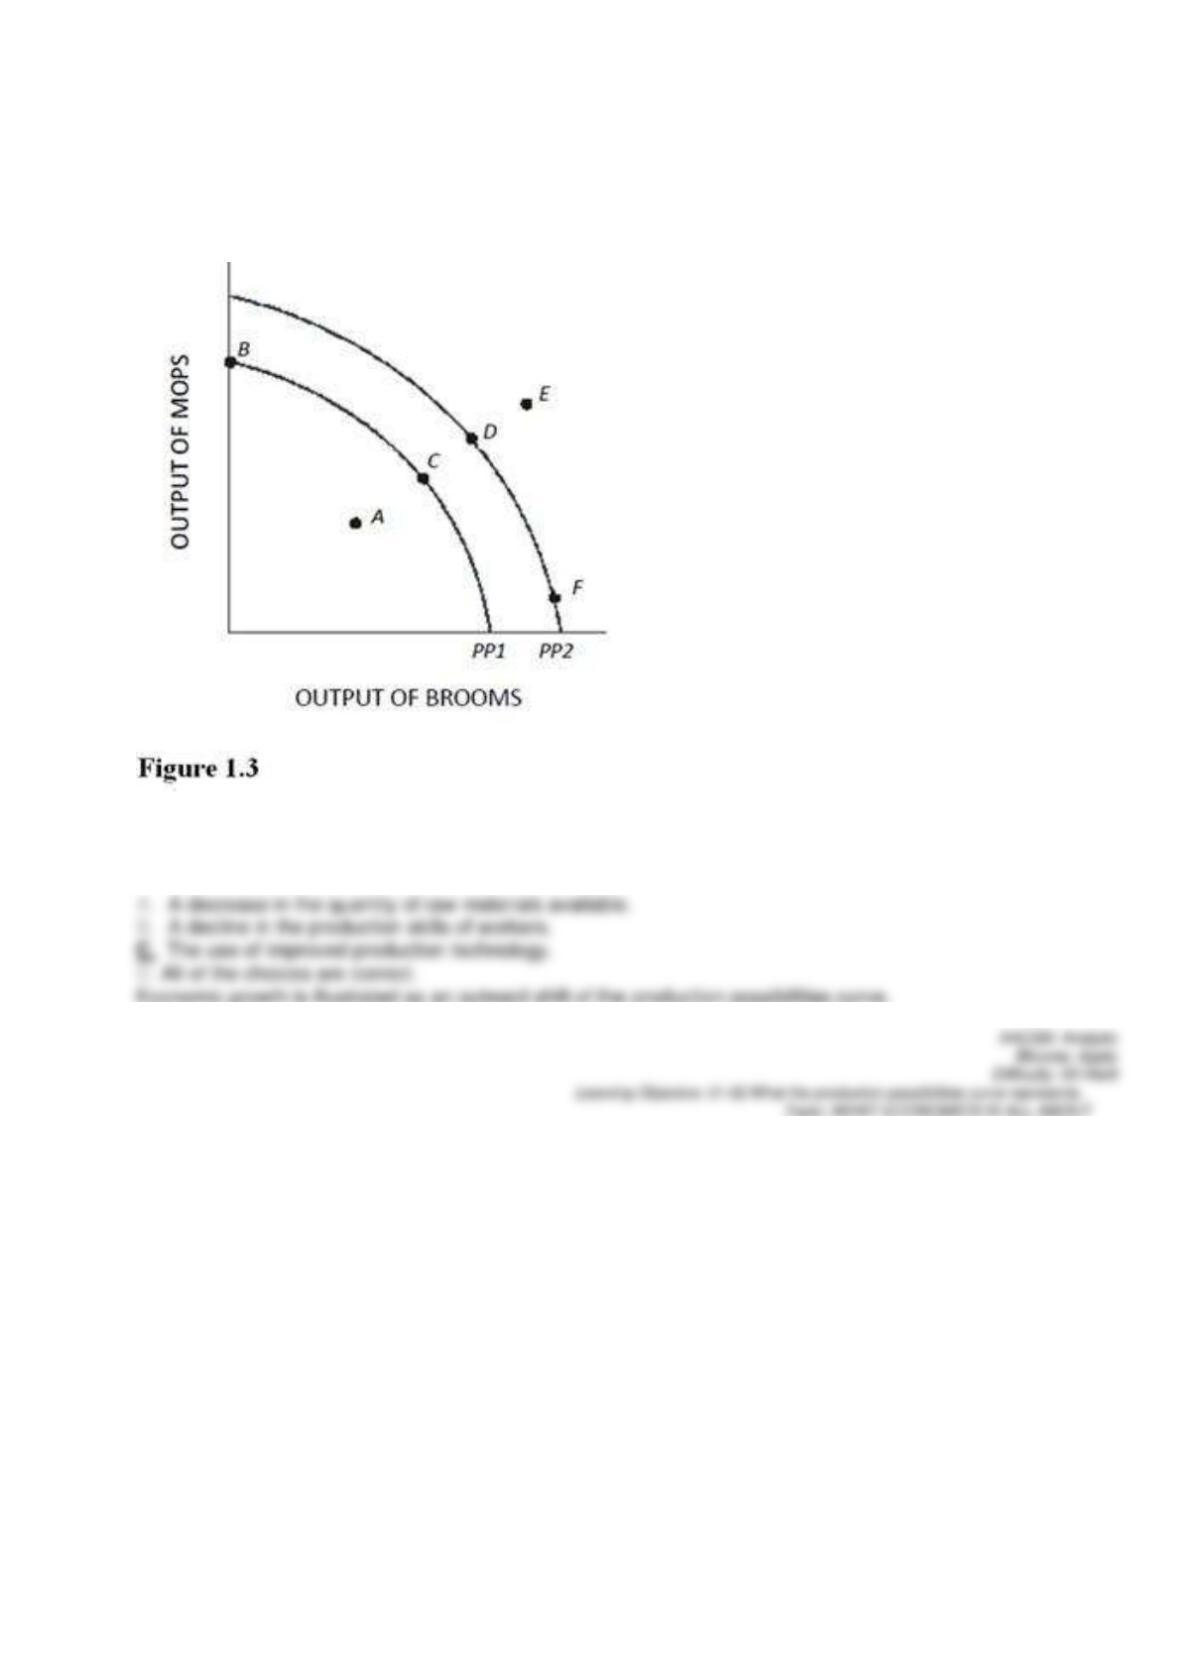
In Figure 1.3, a shift of the production possibilities curve from PP1 to PP2 could be caused by
72.
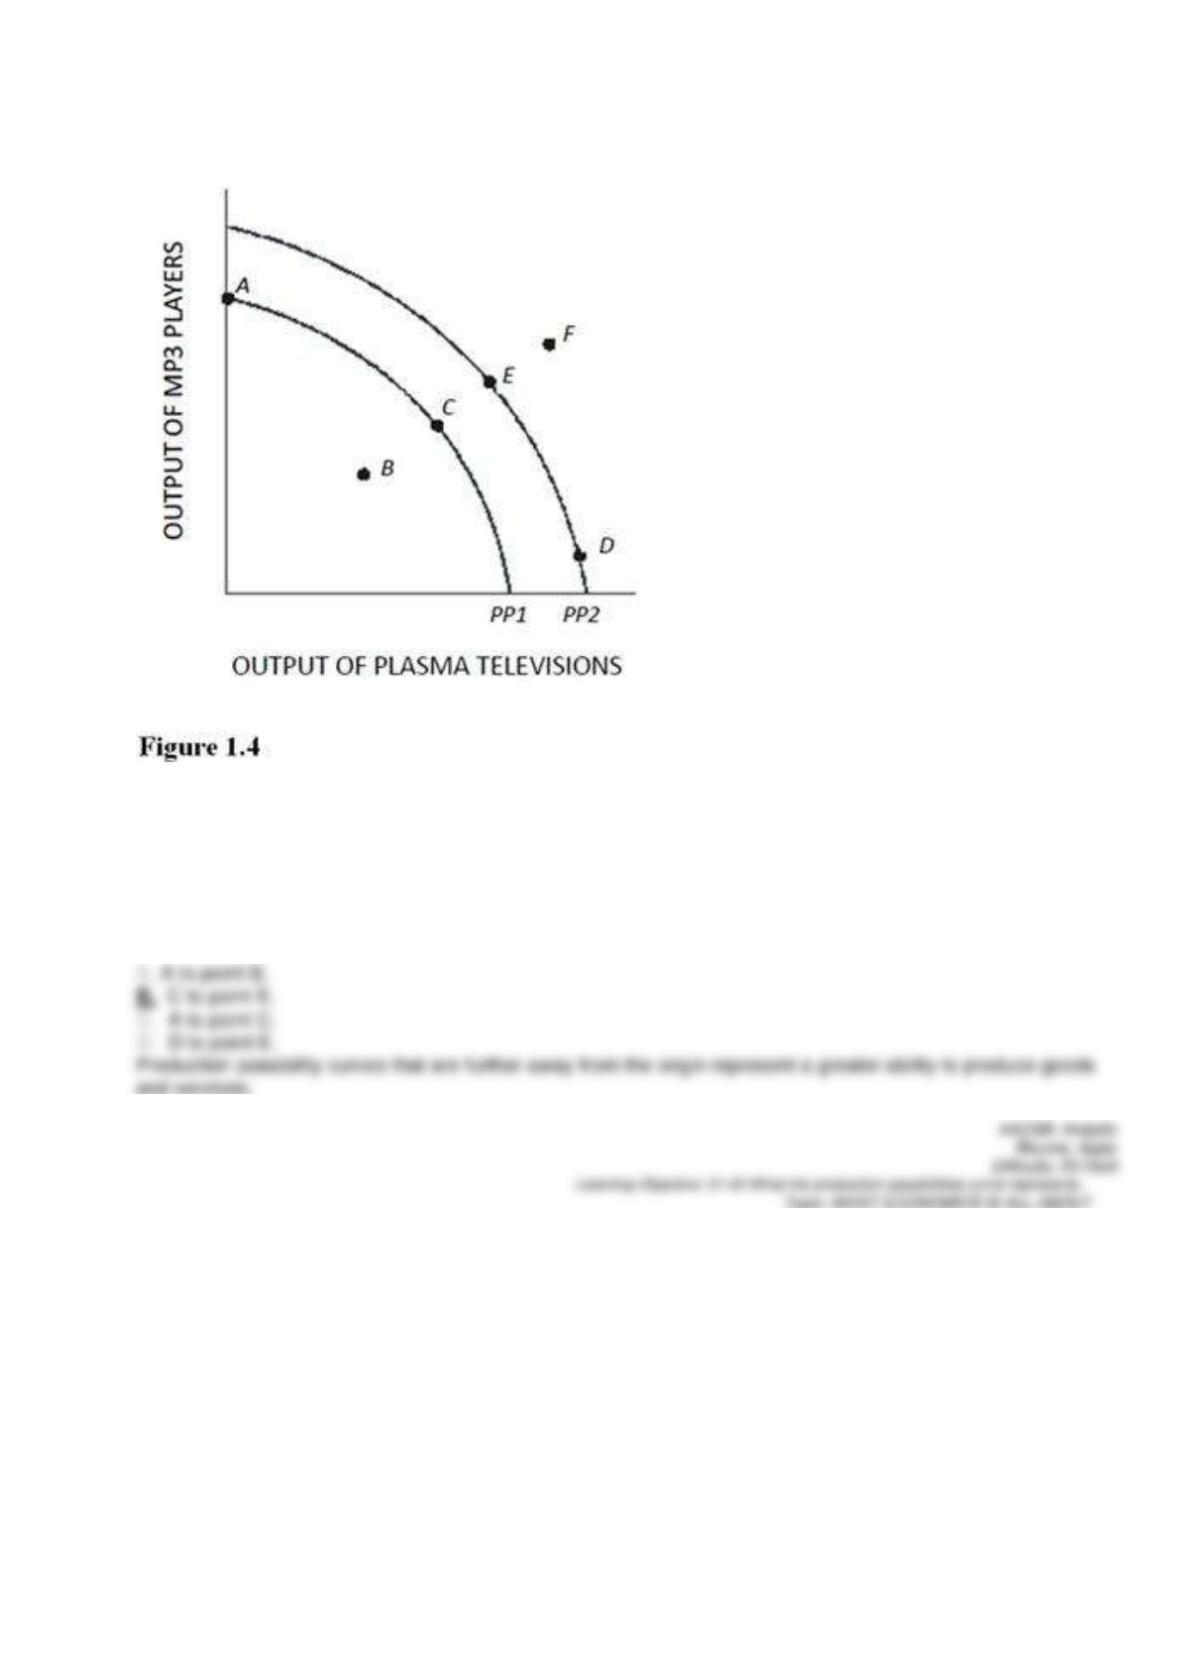
Using Figure 1.4 and starting at PP1, an increase in the capacity to produce can be represented by a
movement from point
73.
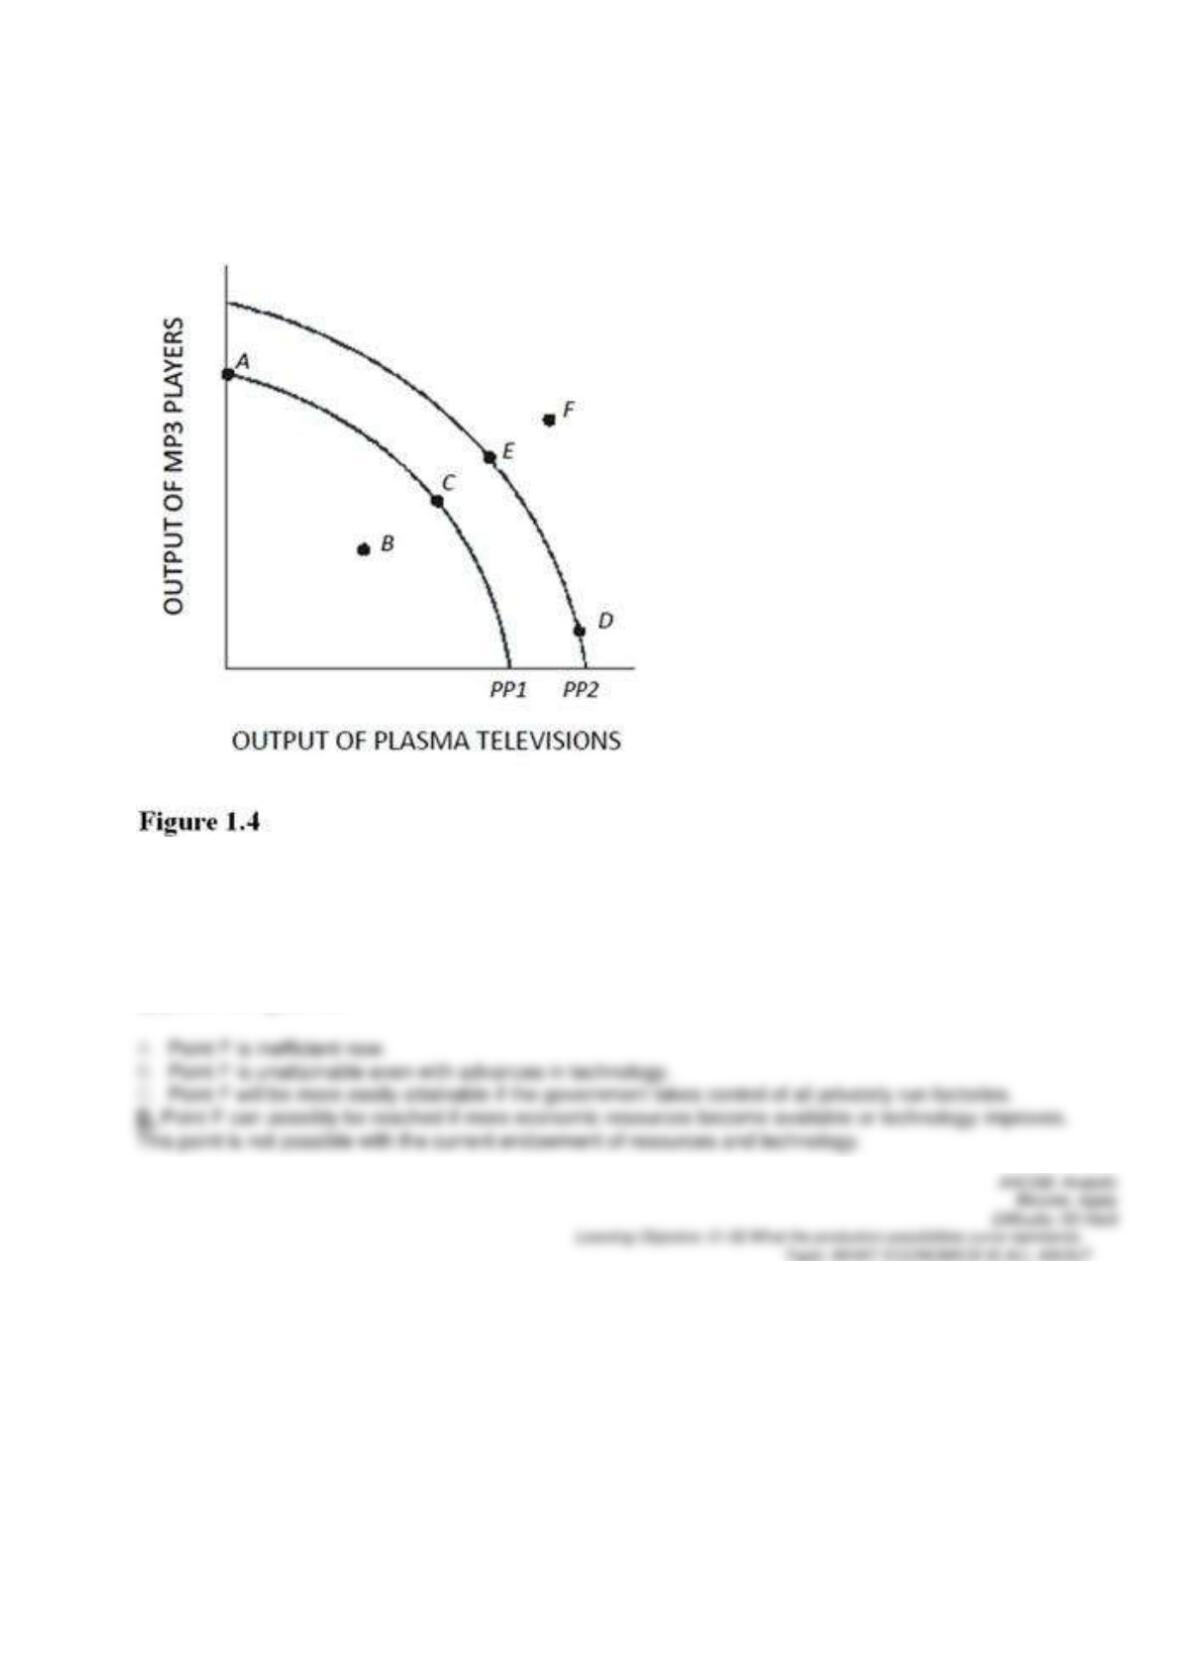
Which of the following is true about the combination of plasma televisions and MP3 players represented
by point F in Figure 1.4?
74.
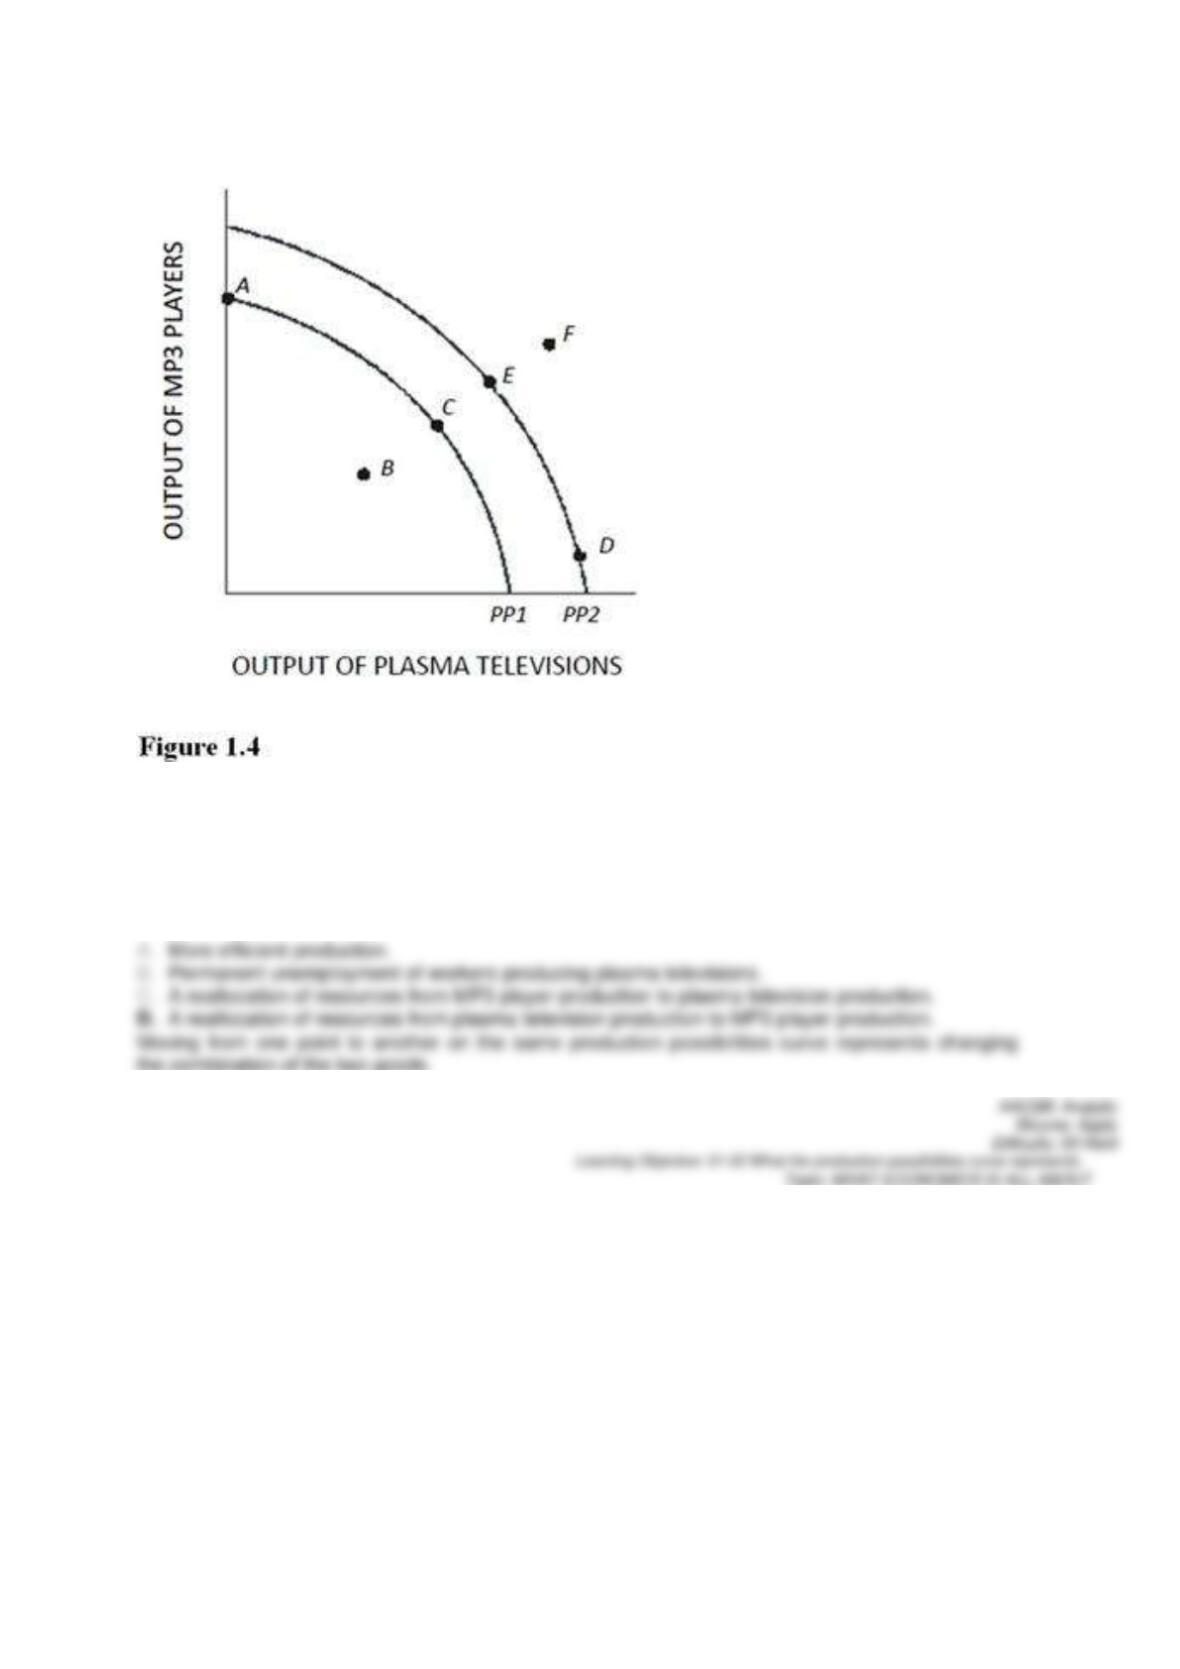
A movement from point C to point A in Figure 1.4 results in
75.
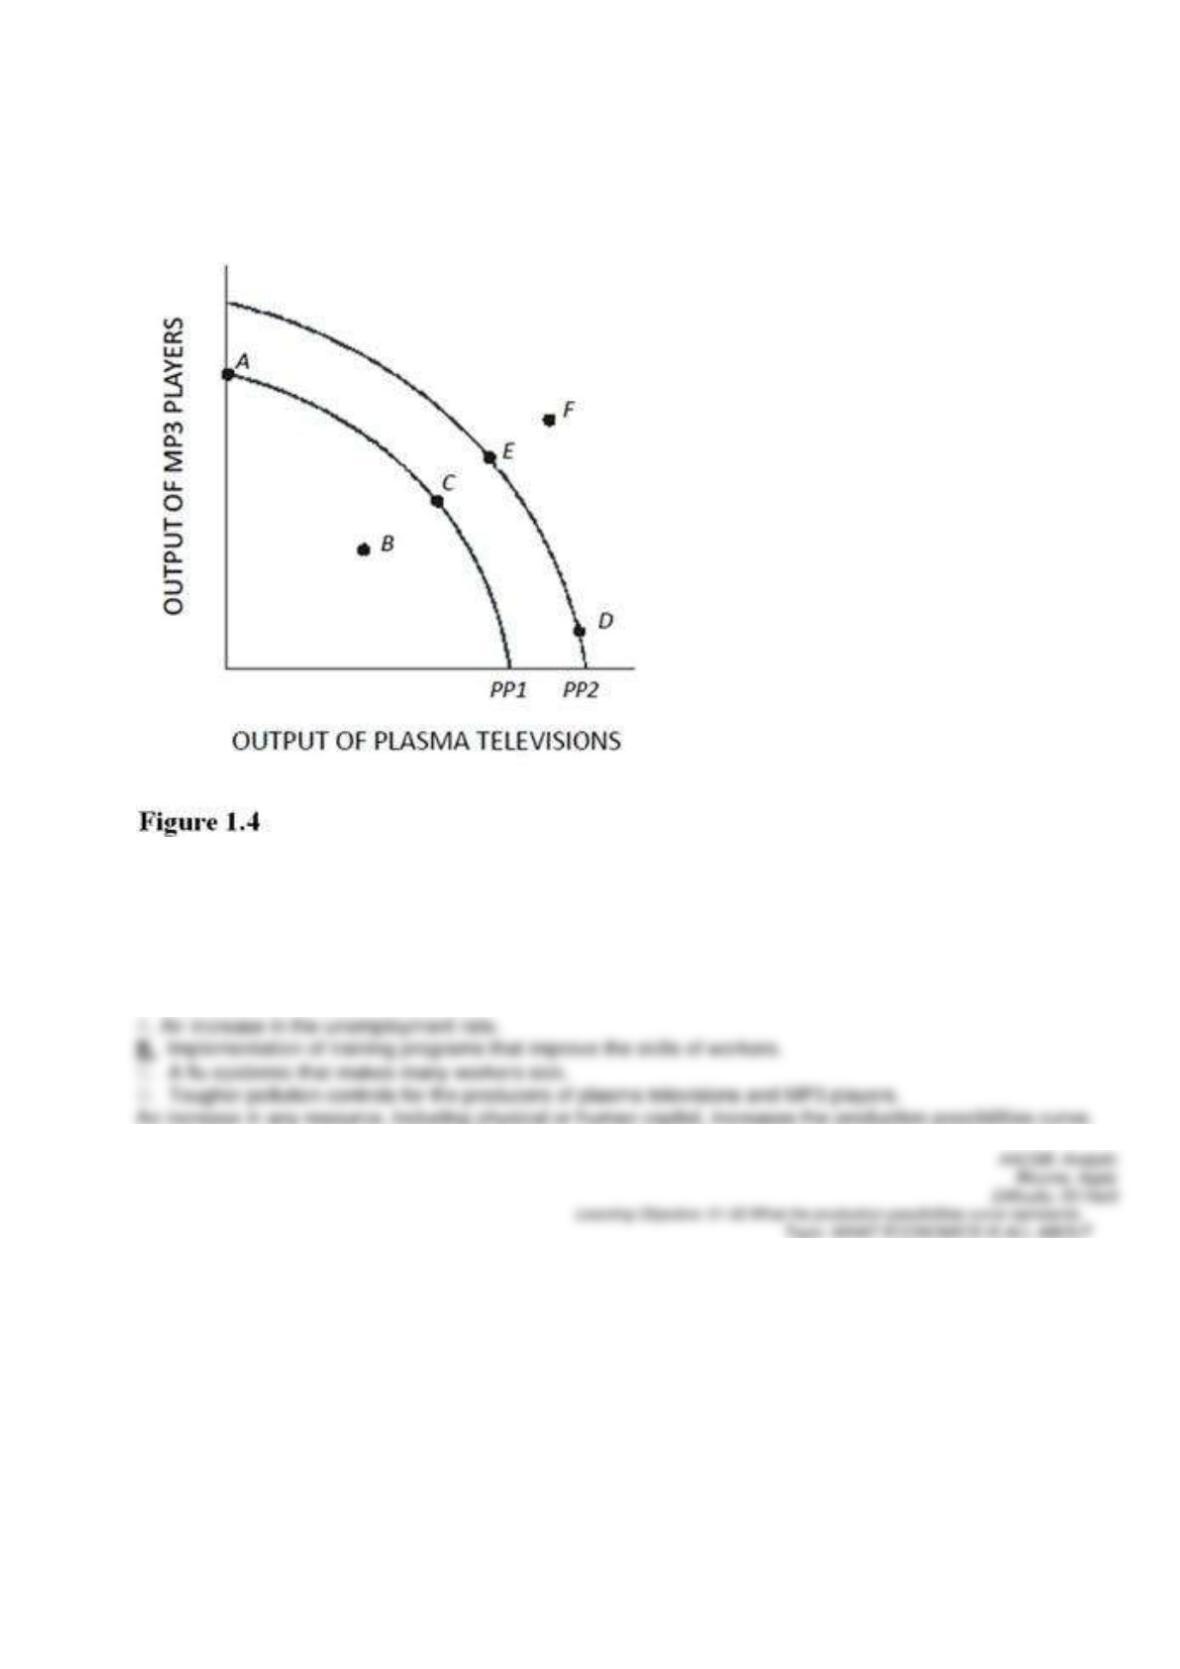
In Figure 1.4, a shift of the production possibilities curve from PP1 to PP2 could be caused by
76.
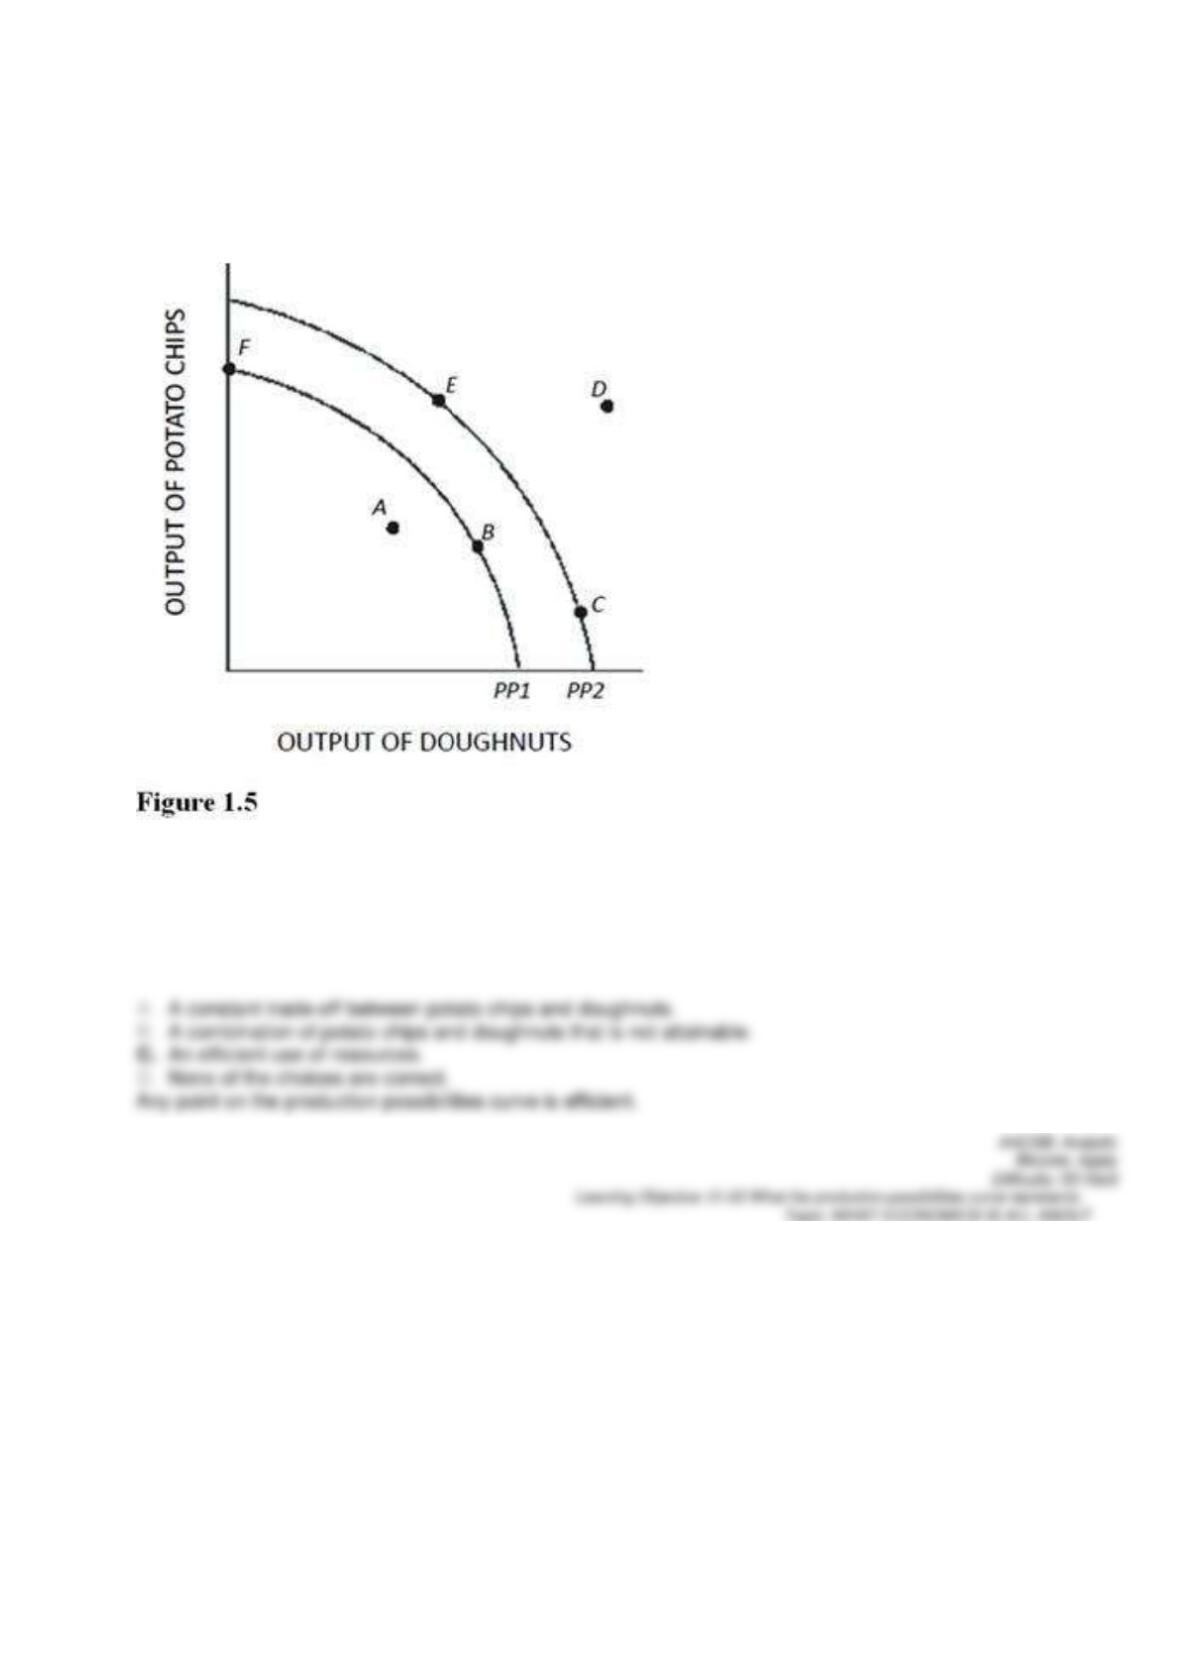
Using Figure 1.5, if an economy has the capacity to produce represented by PP2, then point E represents
77.
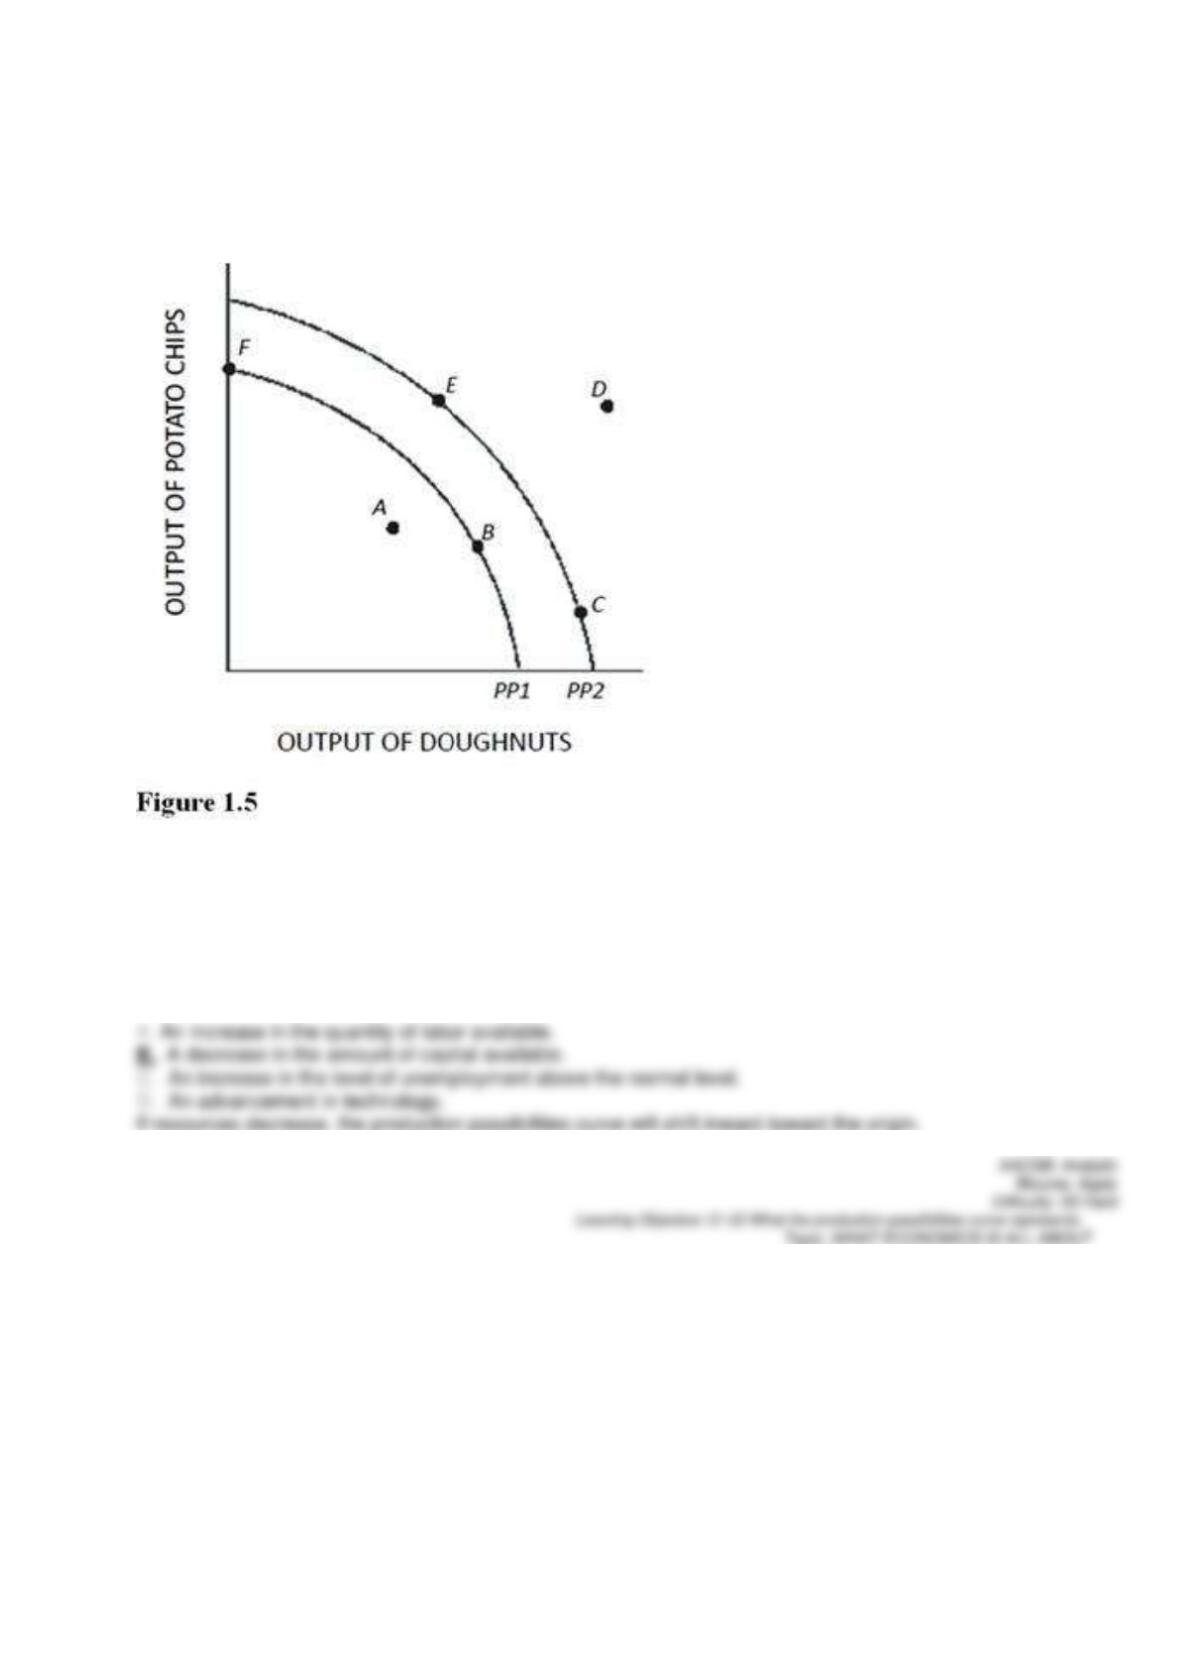
Using Figure 1.5, if an economy is currently producing on PP2, which of the following would shift the
production possibilities curve toward PP1?
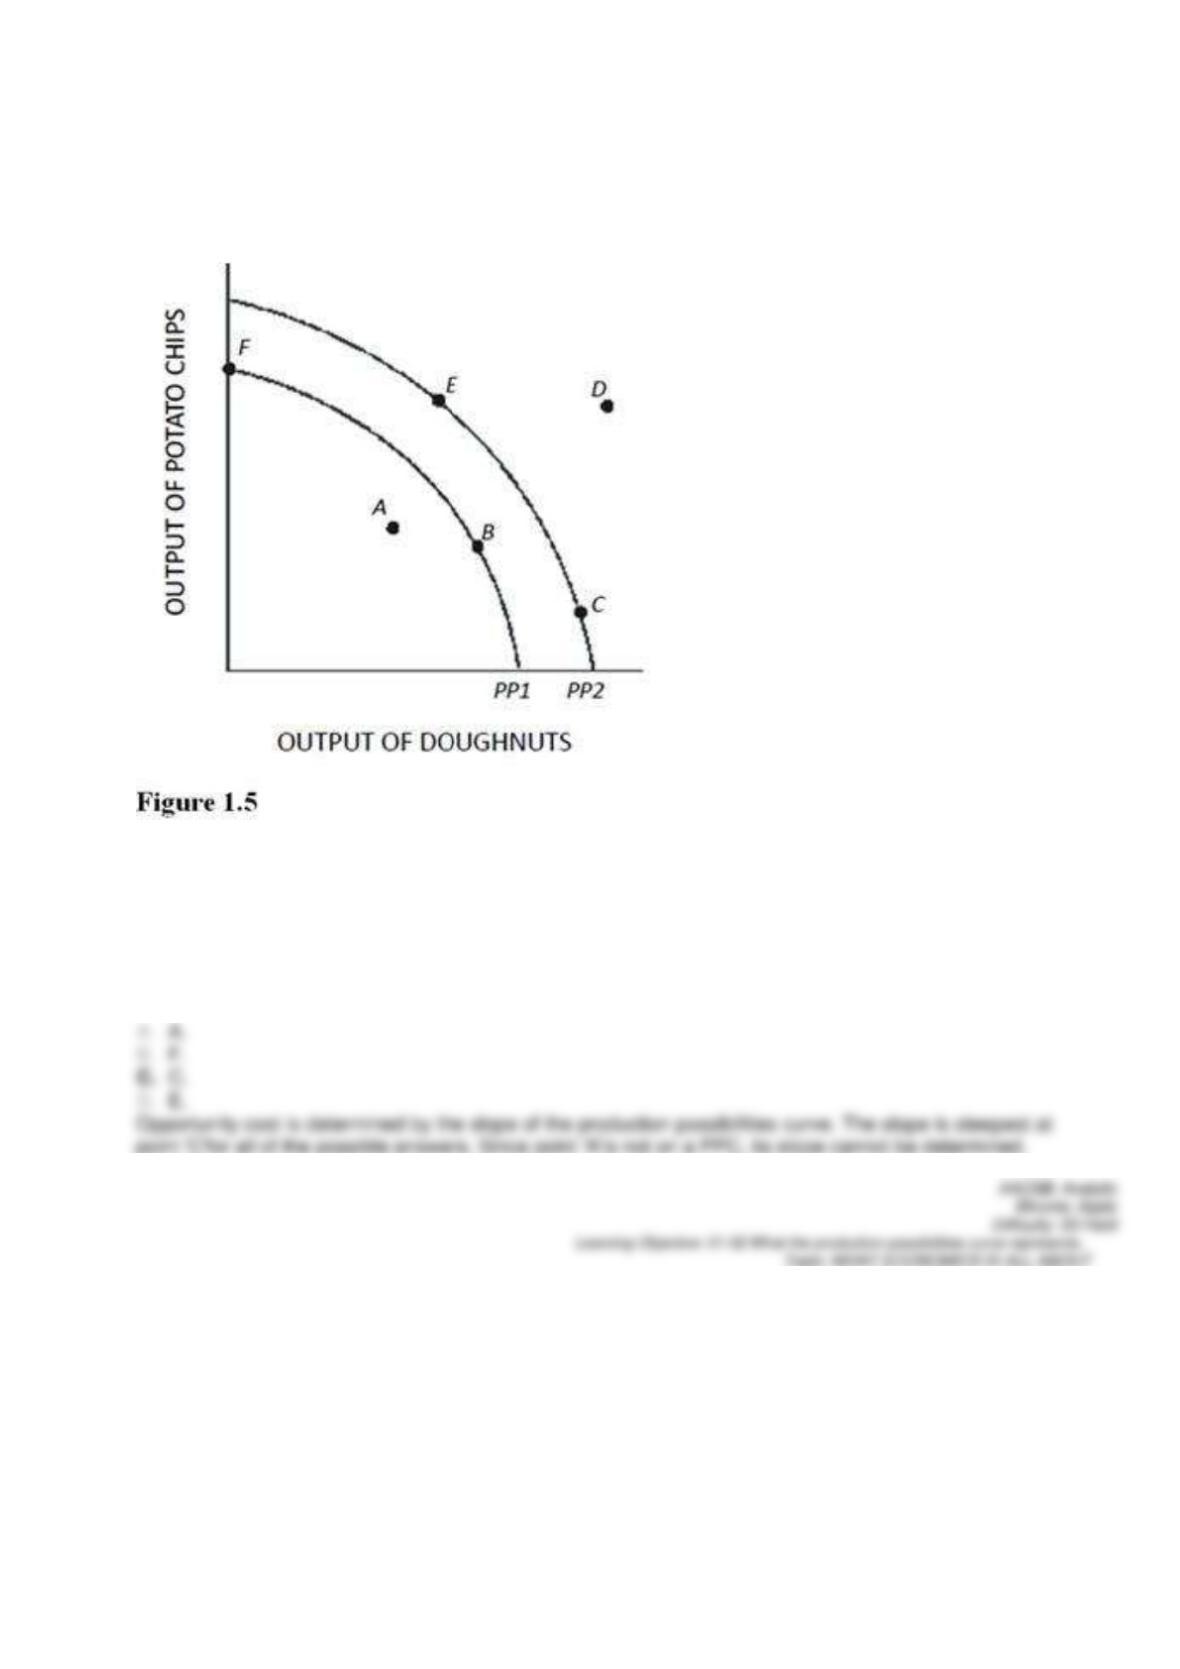
78.
In Figure 1.5, at which of the following points would the opportunity cost of producing another doughnut
be greatest?
79.
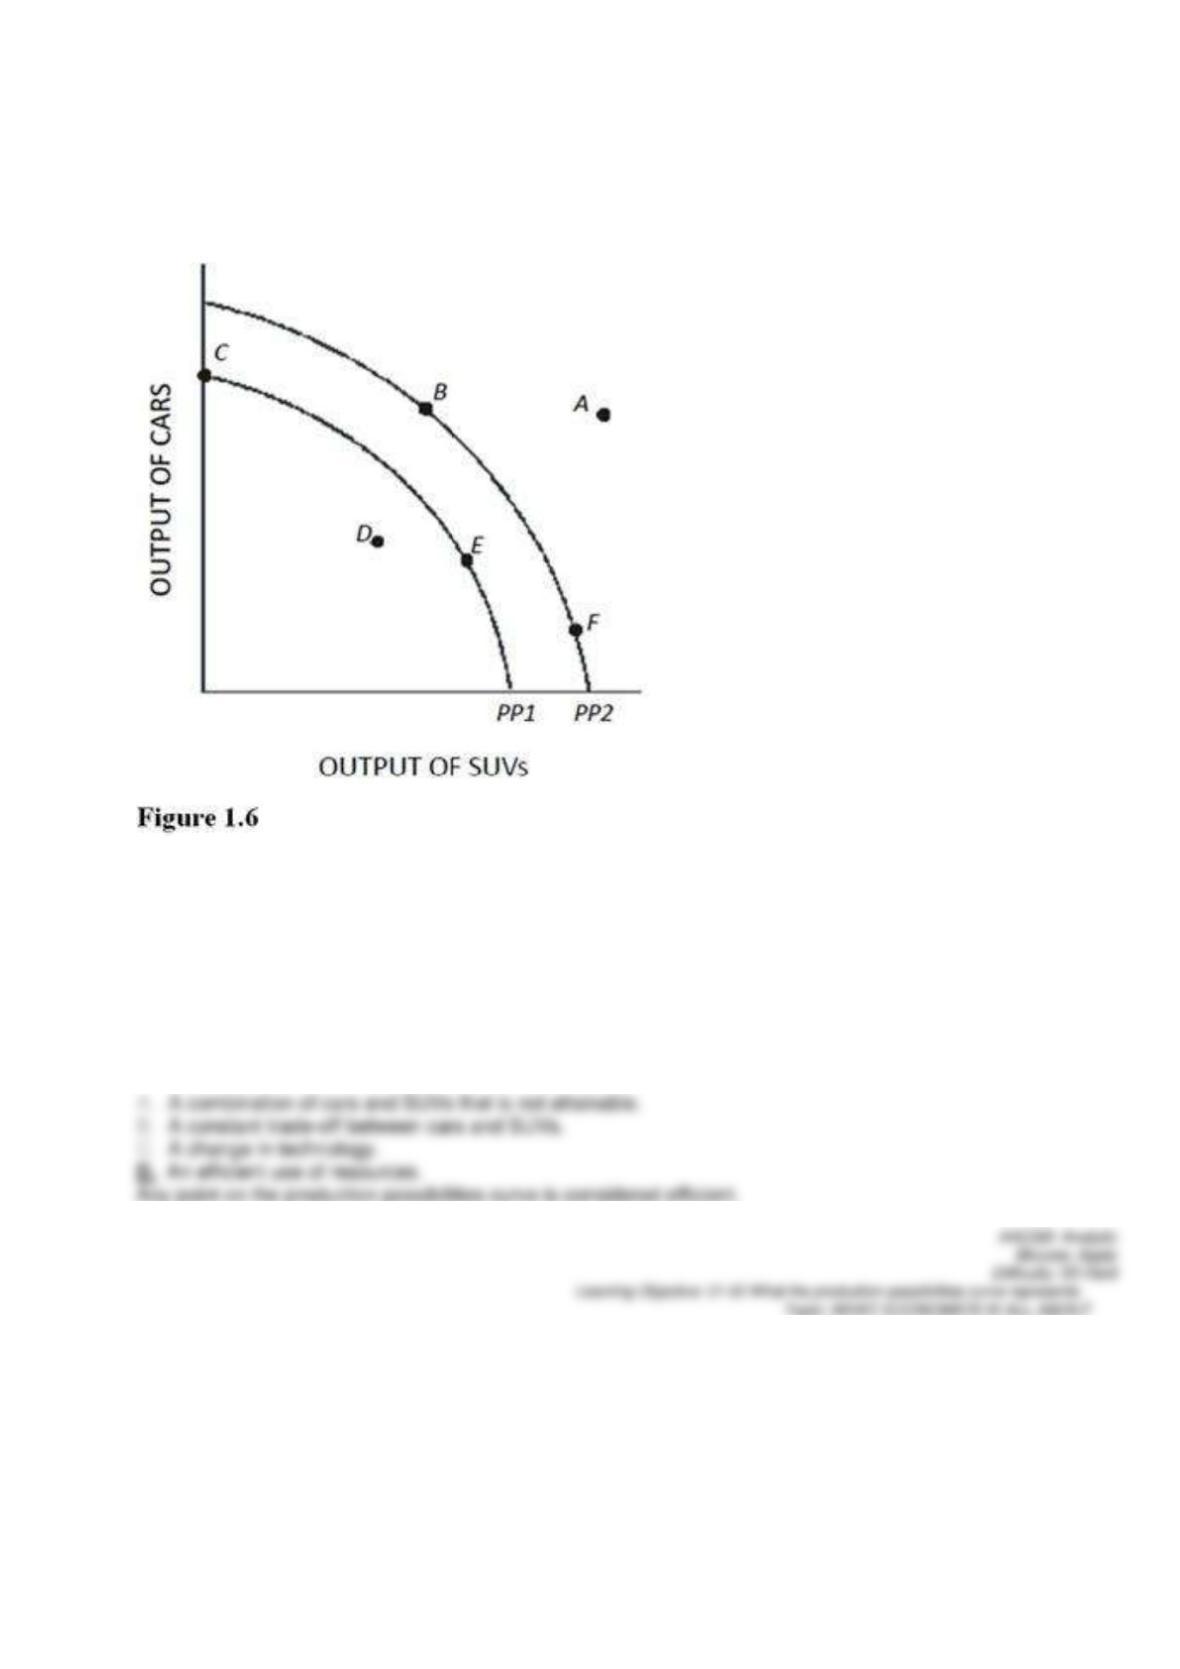
Using Figure 1.6, if an economy has the capacity to produce represented by PP1, then point E represents
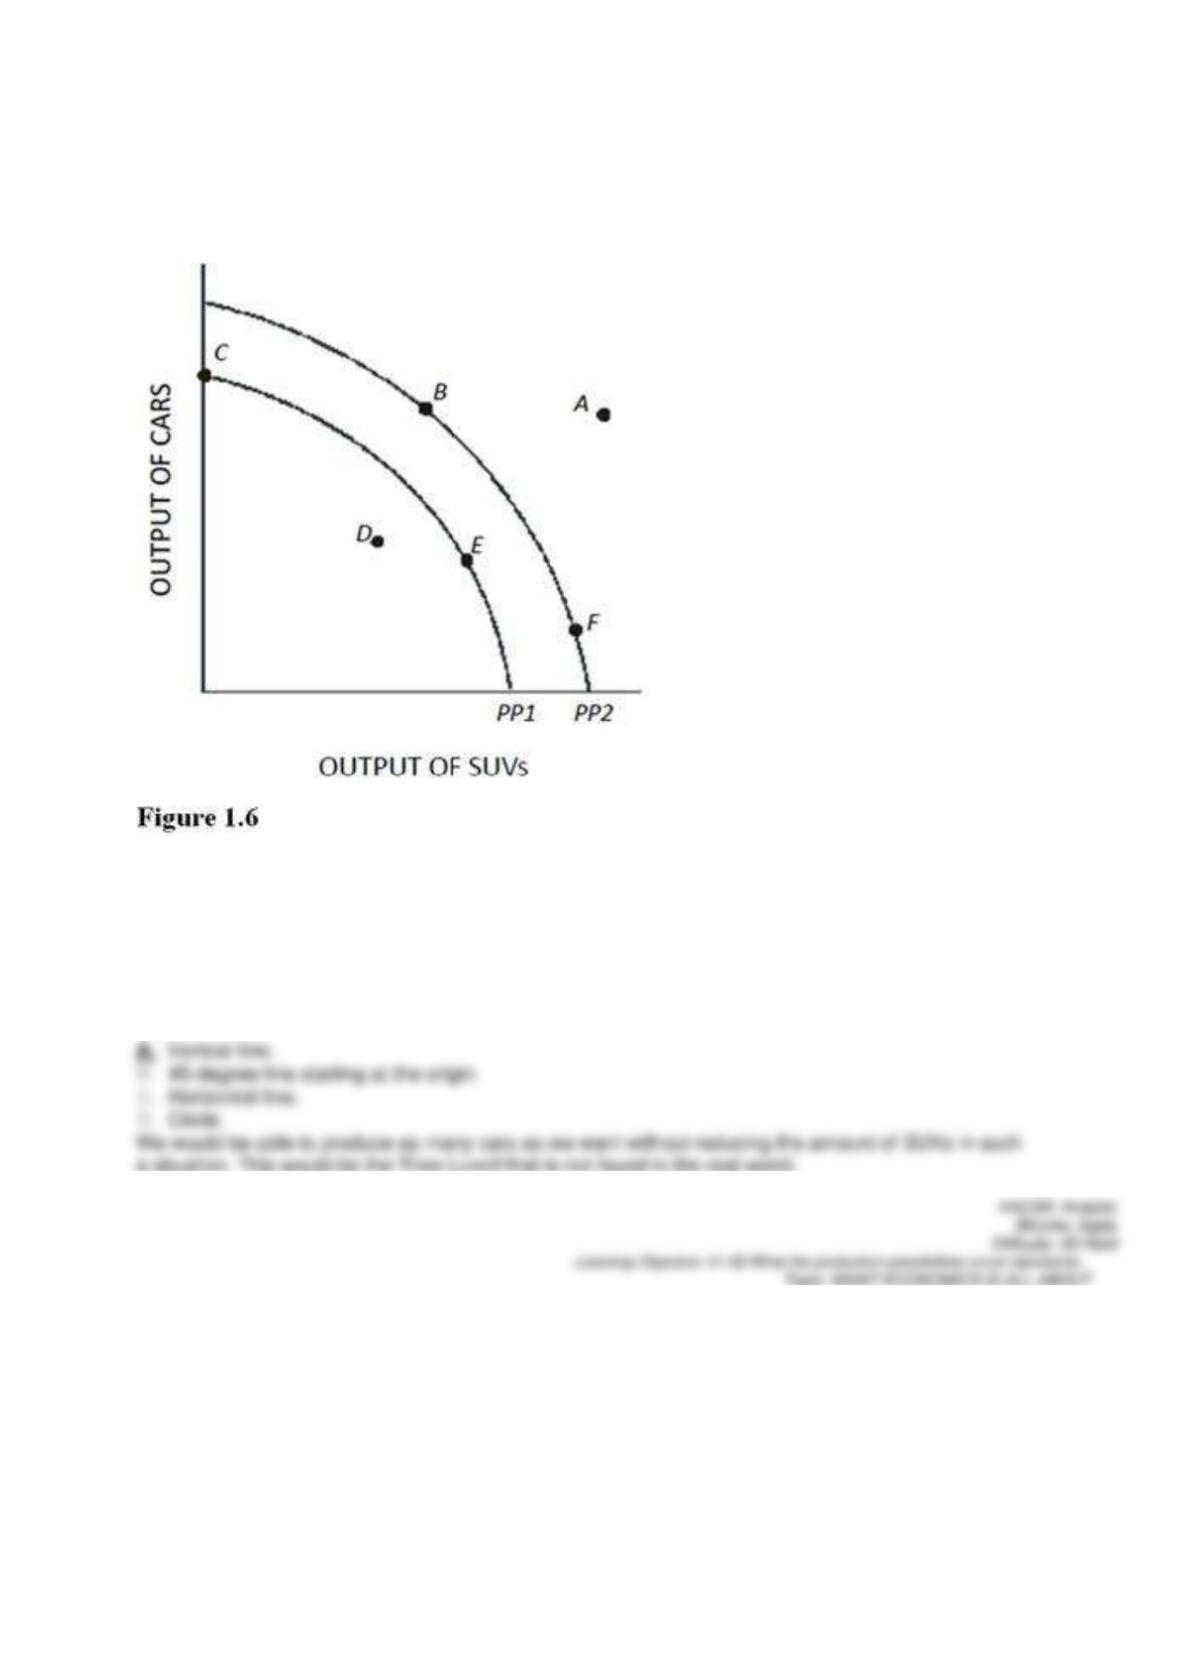
80.
In Figure 1.6, if the opportunity cost of producing cars was zero at all levels of production, the production
possibilities curve would be best be represented by a
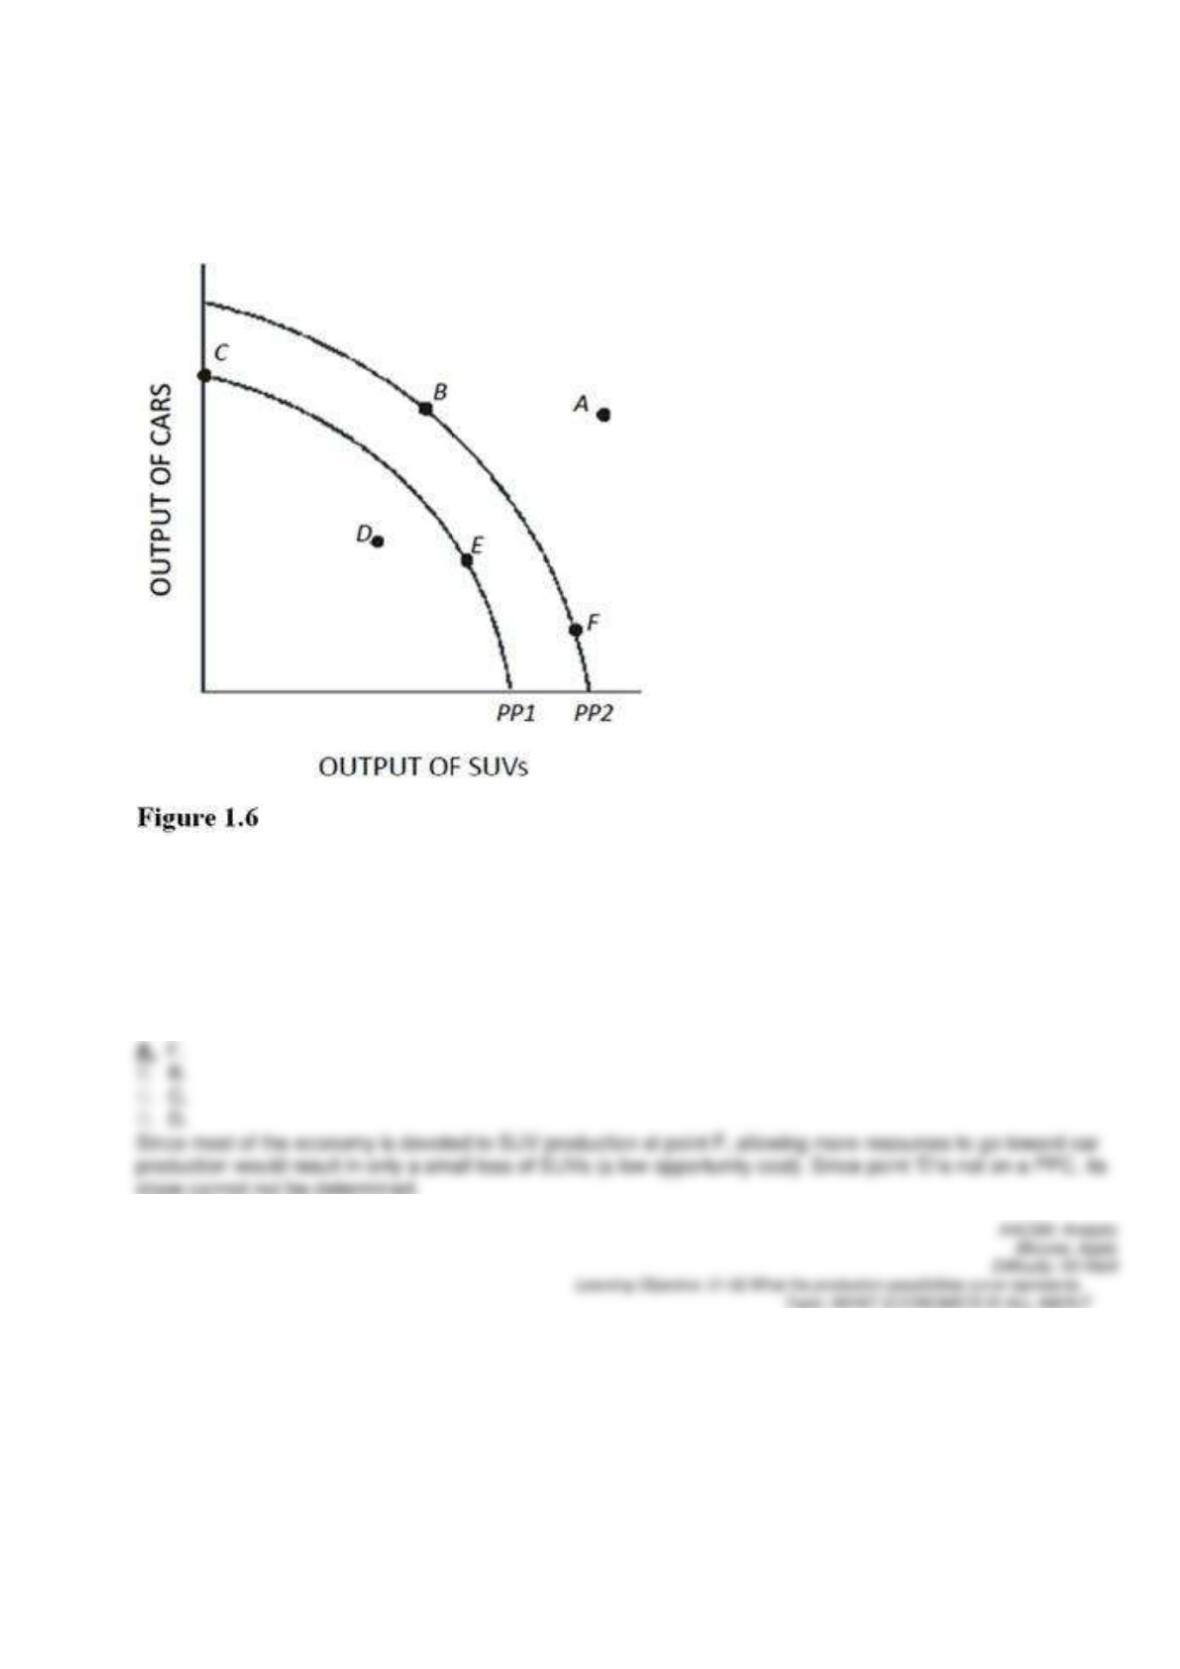
81.
In Figure 1.6, at which of the following points would the opportunity cost of producing one more car be the
lowest?
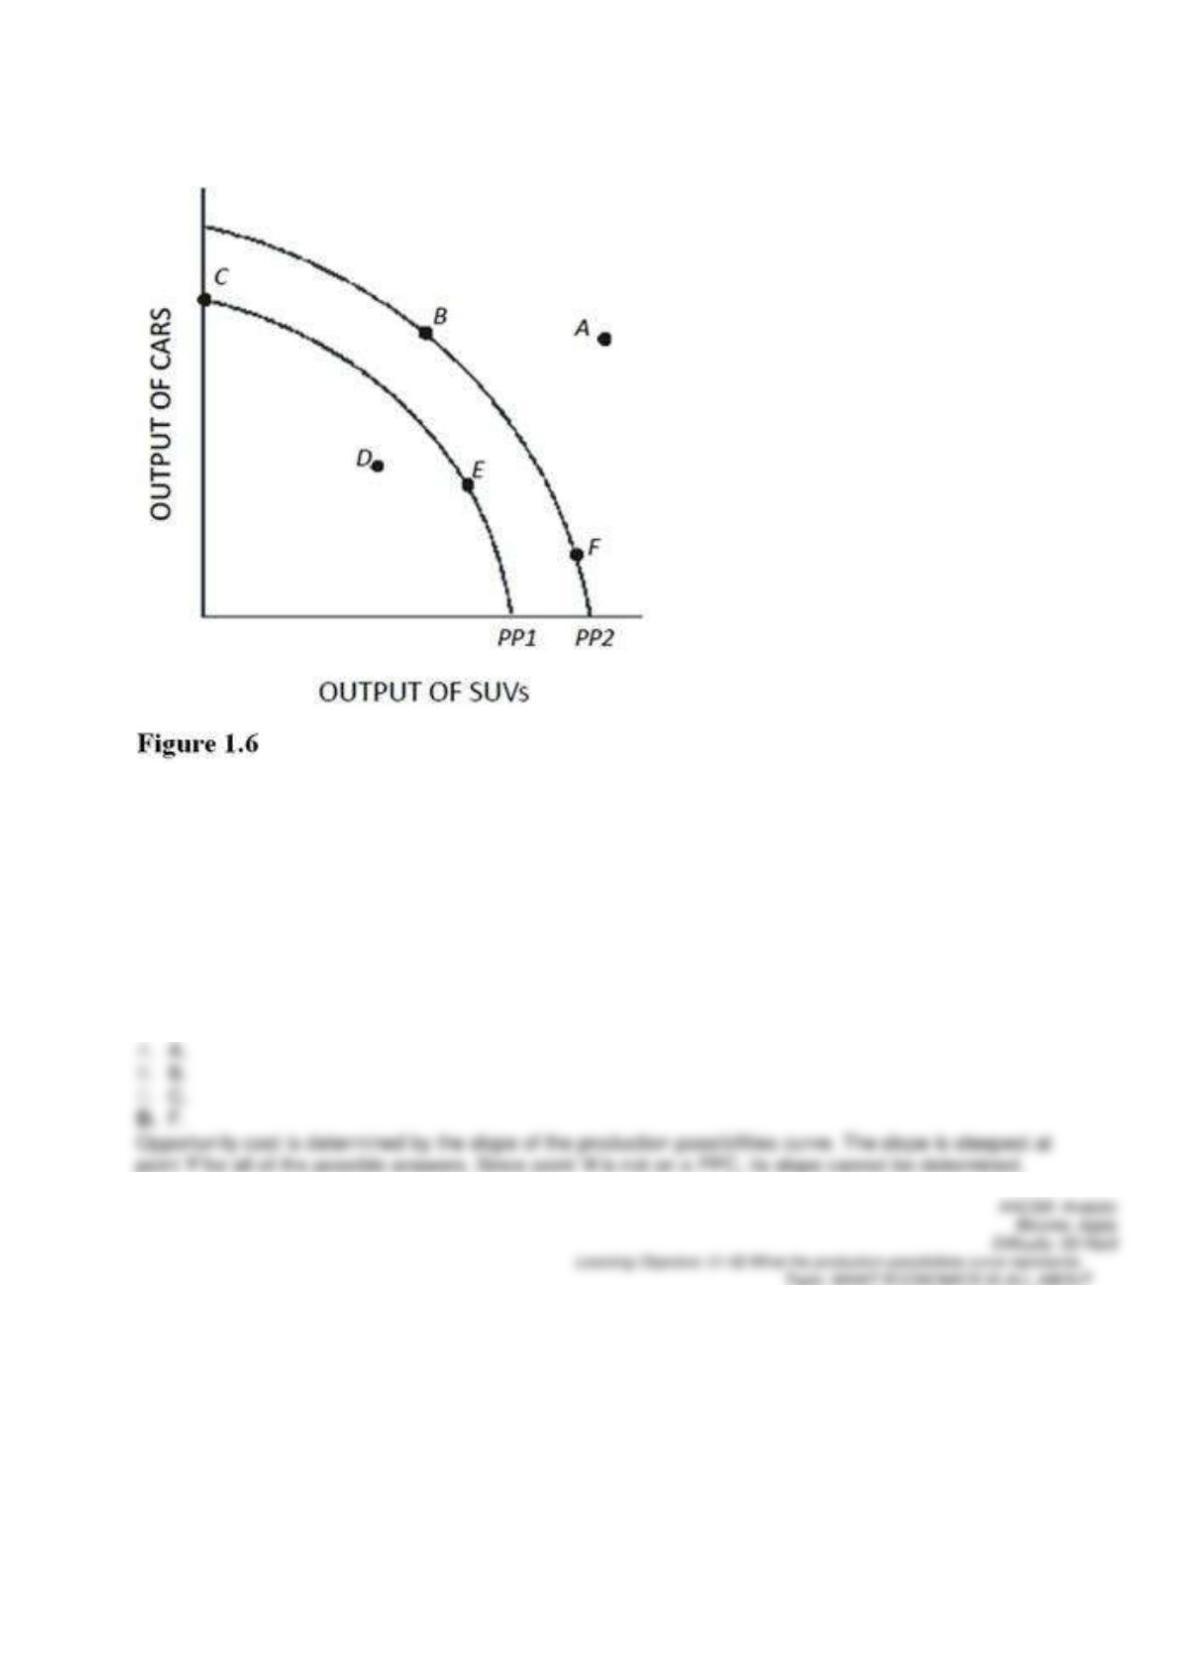
82.
In Figure 1.6, at which of the following points would the opportunity cost of producing one more SUV be
highest?
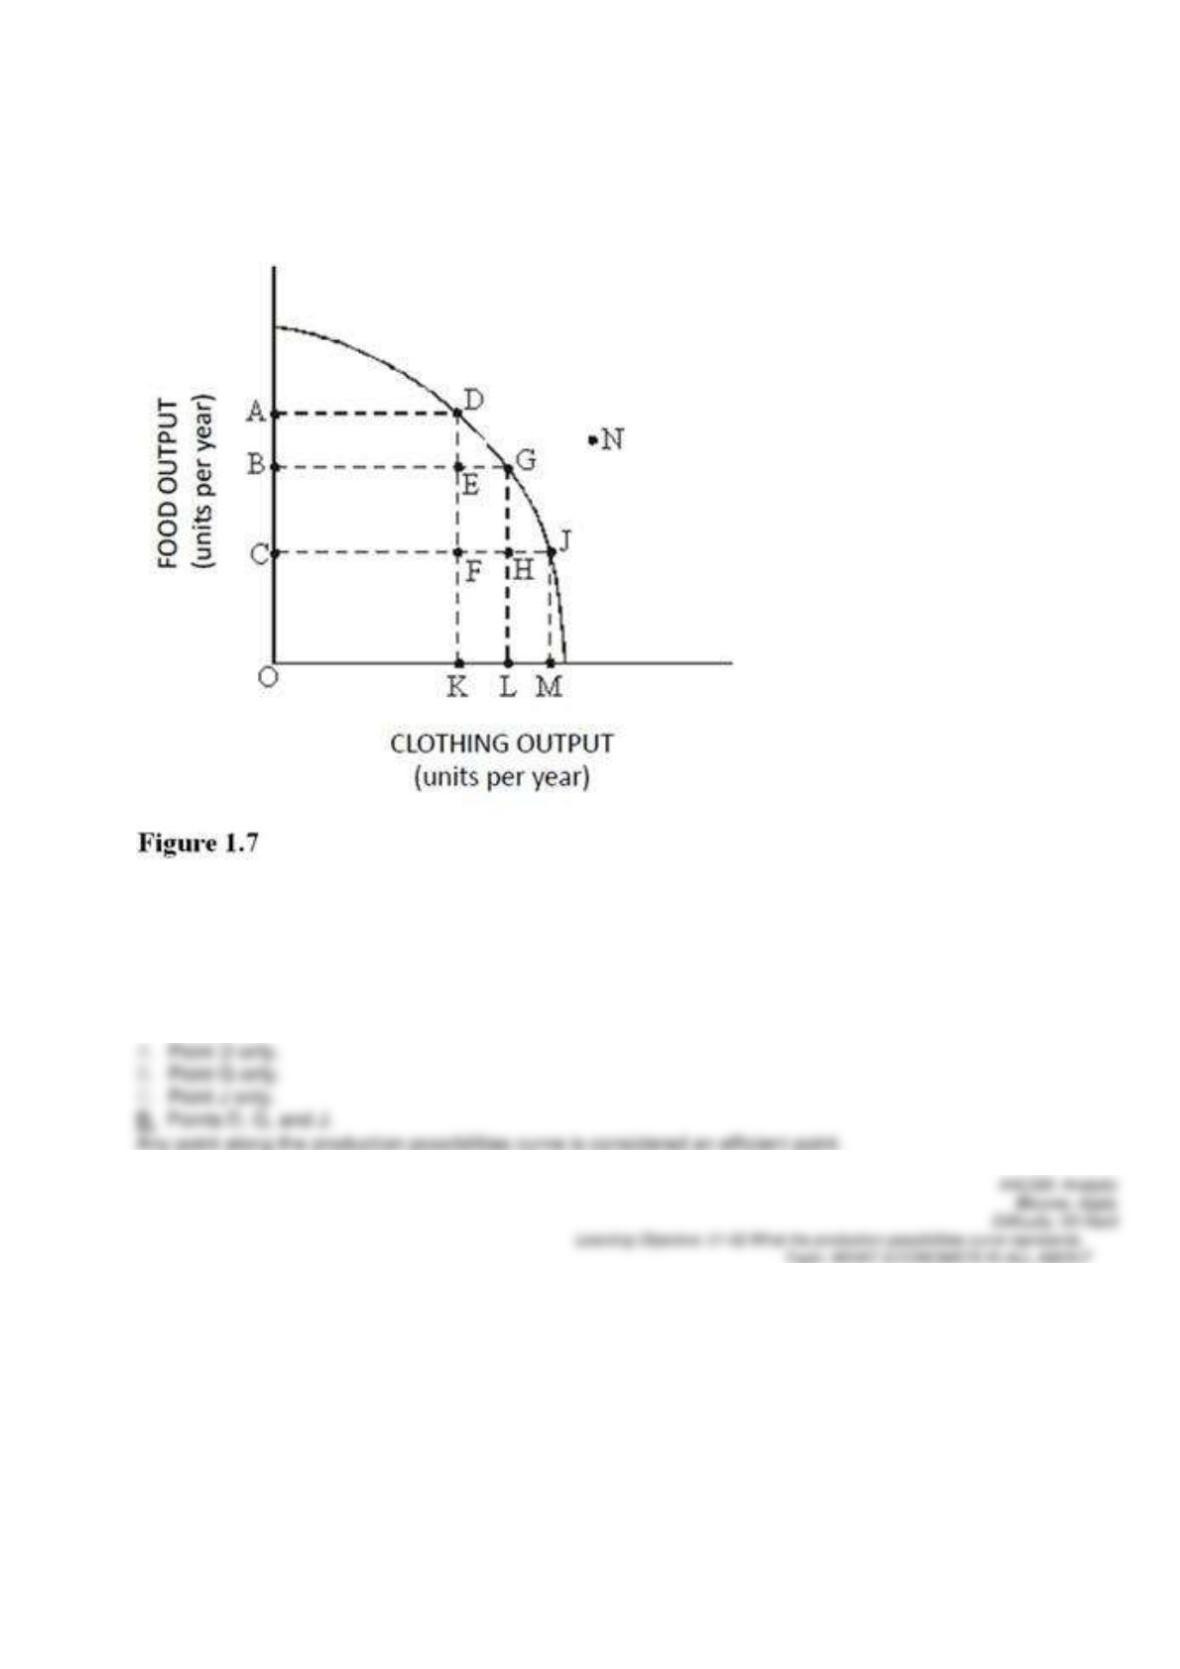
83.
Refer to Figure 1.7. This economy will achieve efficiency in production at

84.
Refer to Figure 1.7. The cost of producing at point G rather than point D is
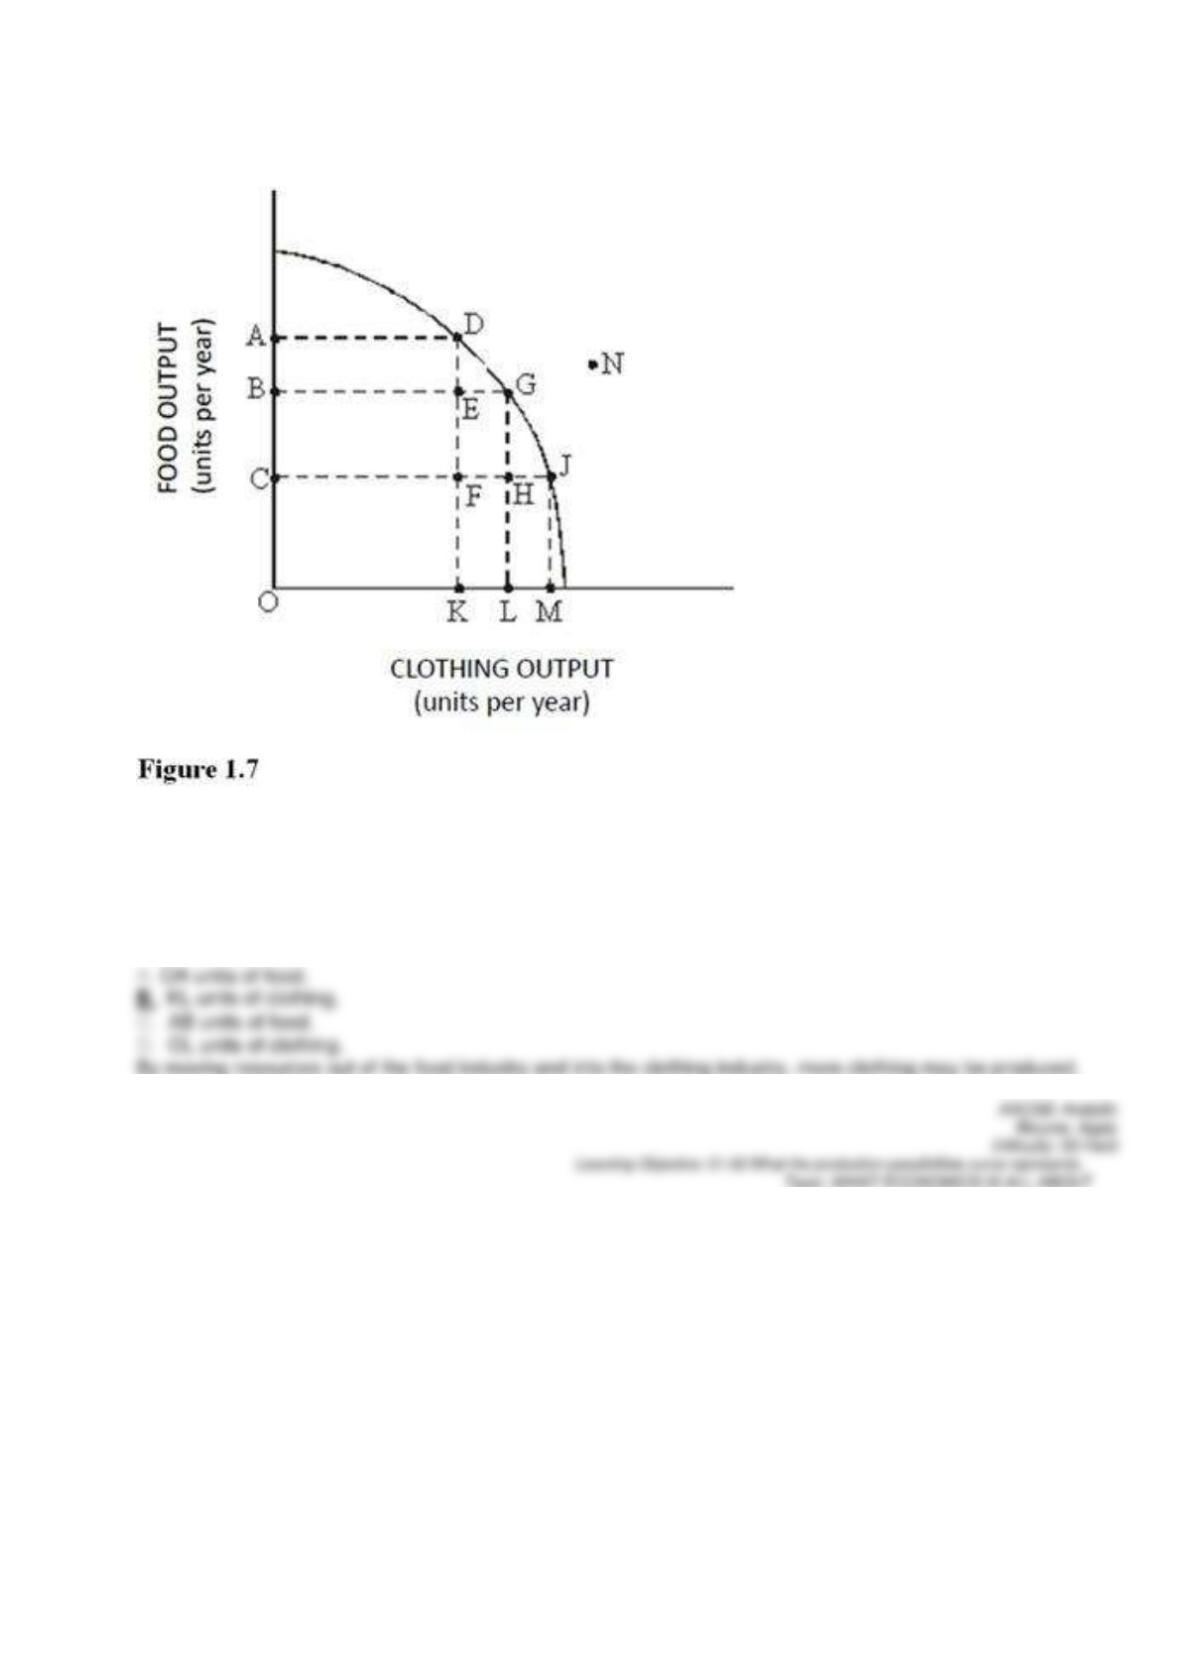
85.
Refer to Figure 1.7. The benefit of producing at point G rather than point D is
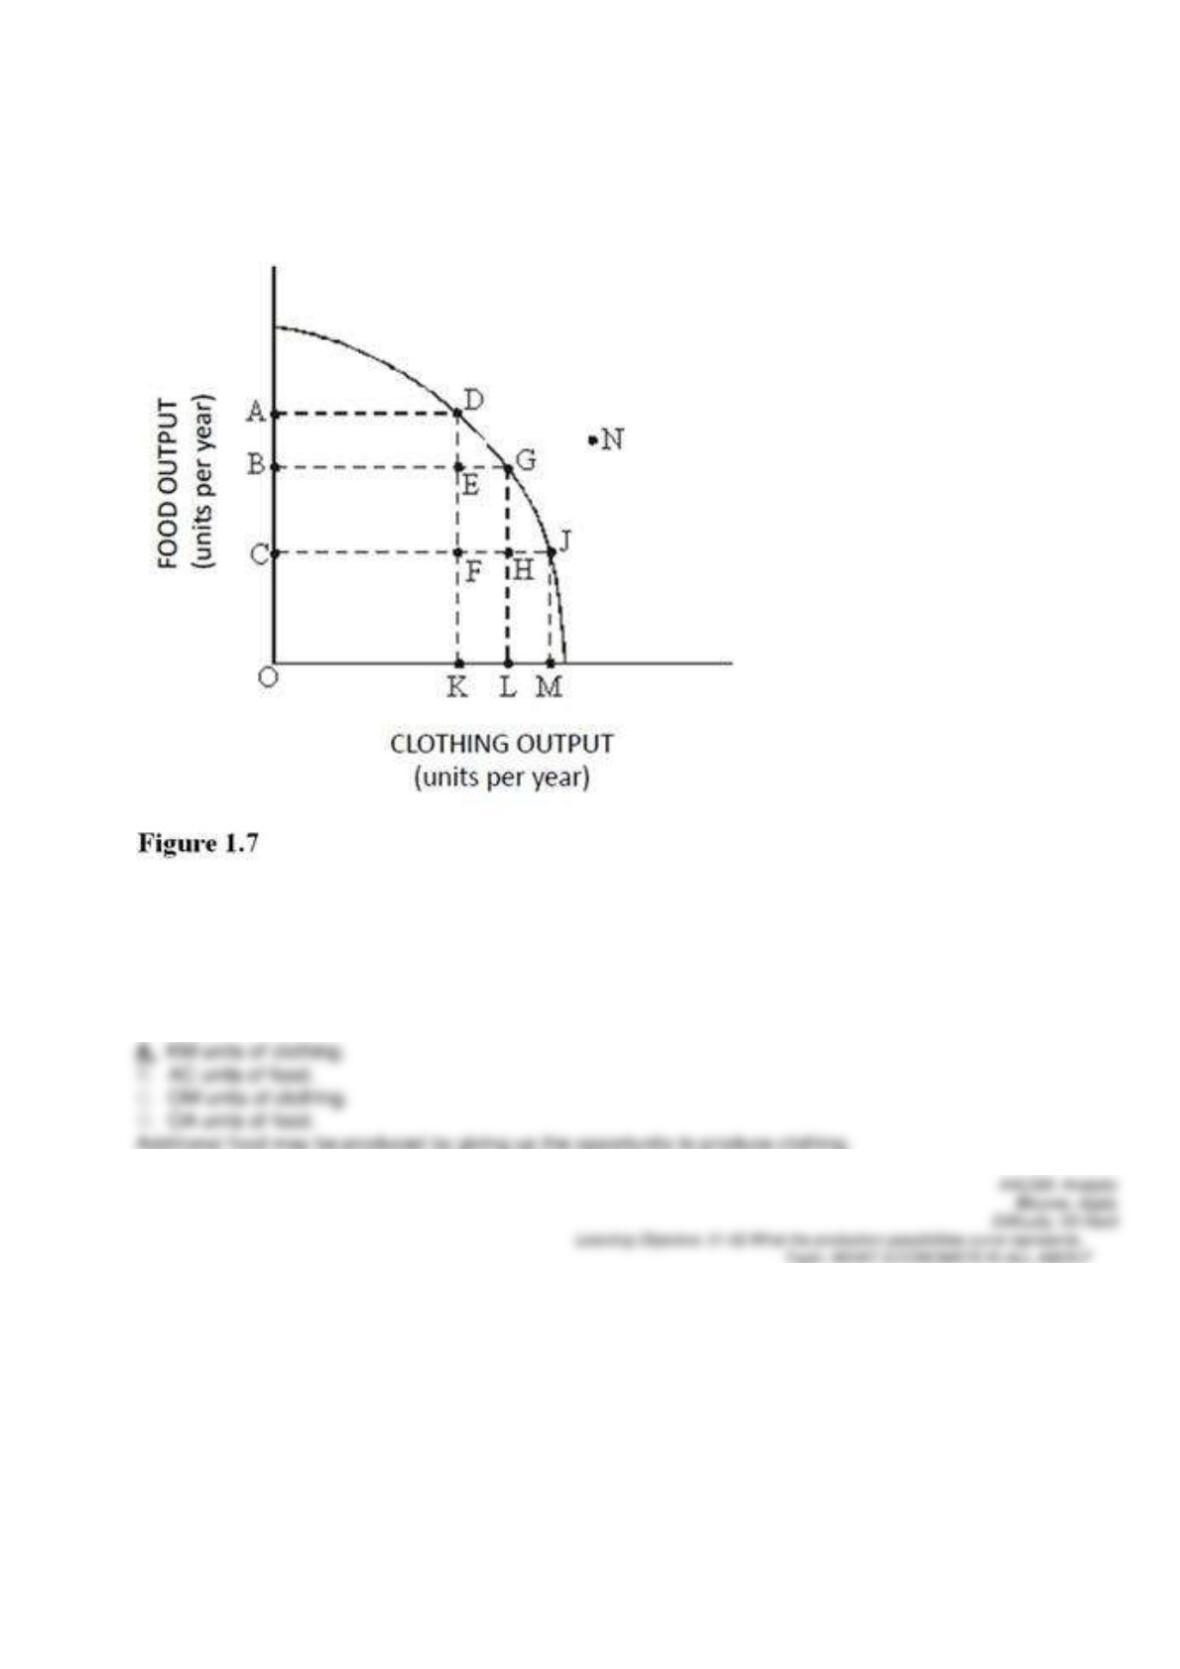
86.
Refer to Figure 1.7. The cost of producing at point D rather than point J is
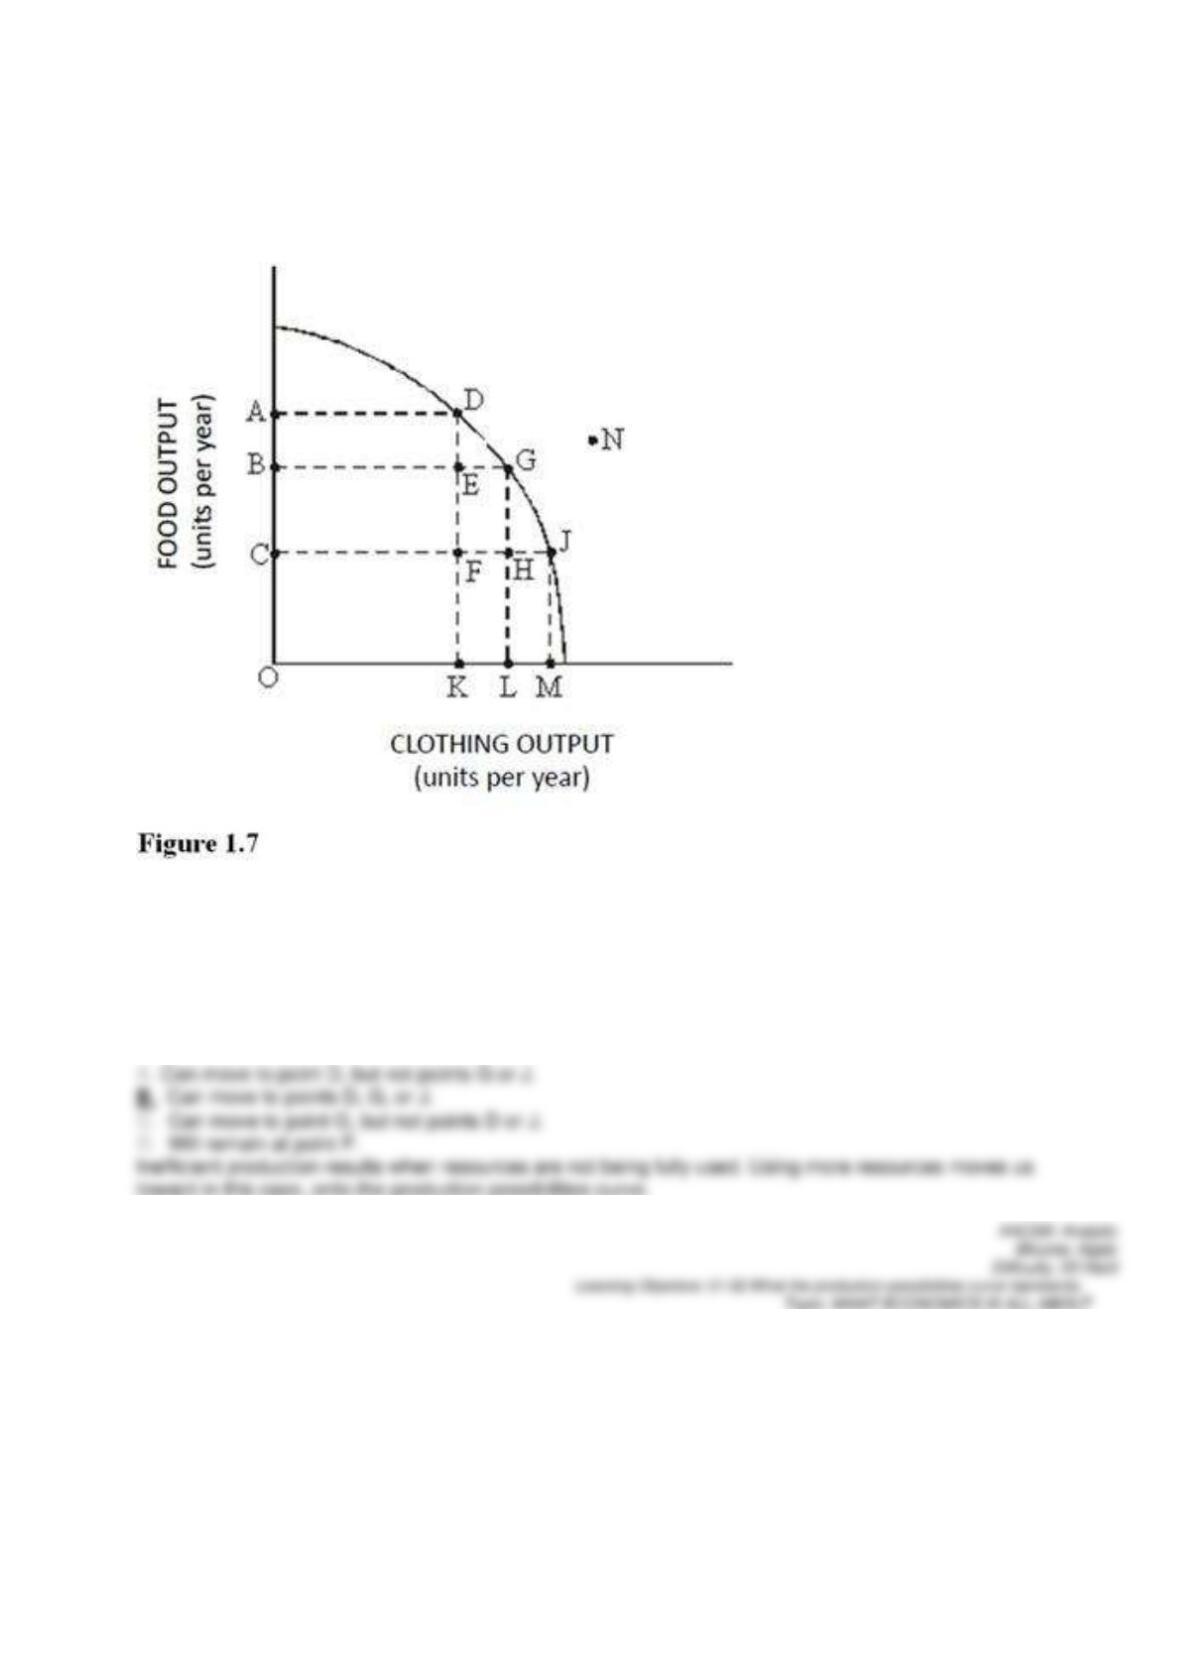
87.
Refer to Figure 1.7. If this economy is currently producing at point F, then by employing more resources this
economy


