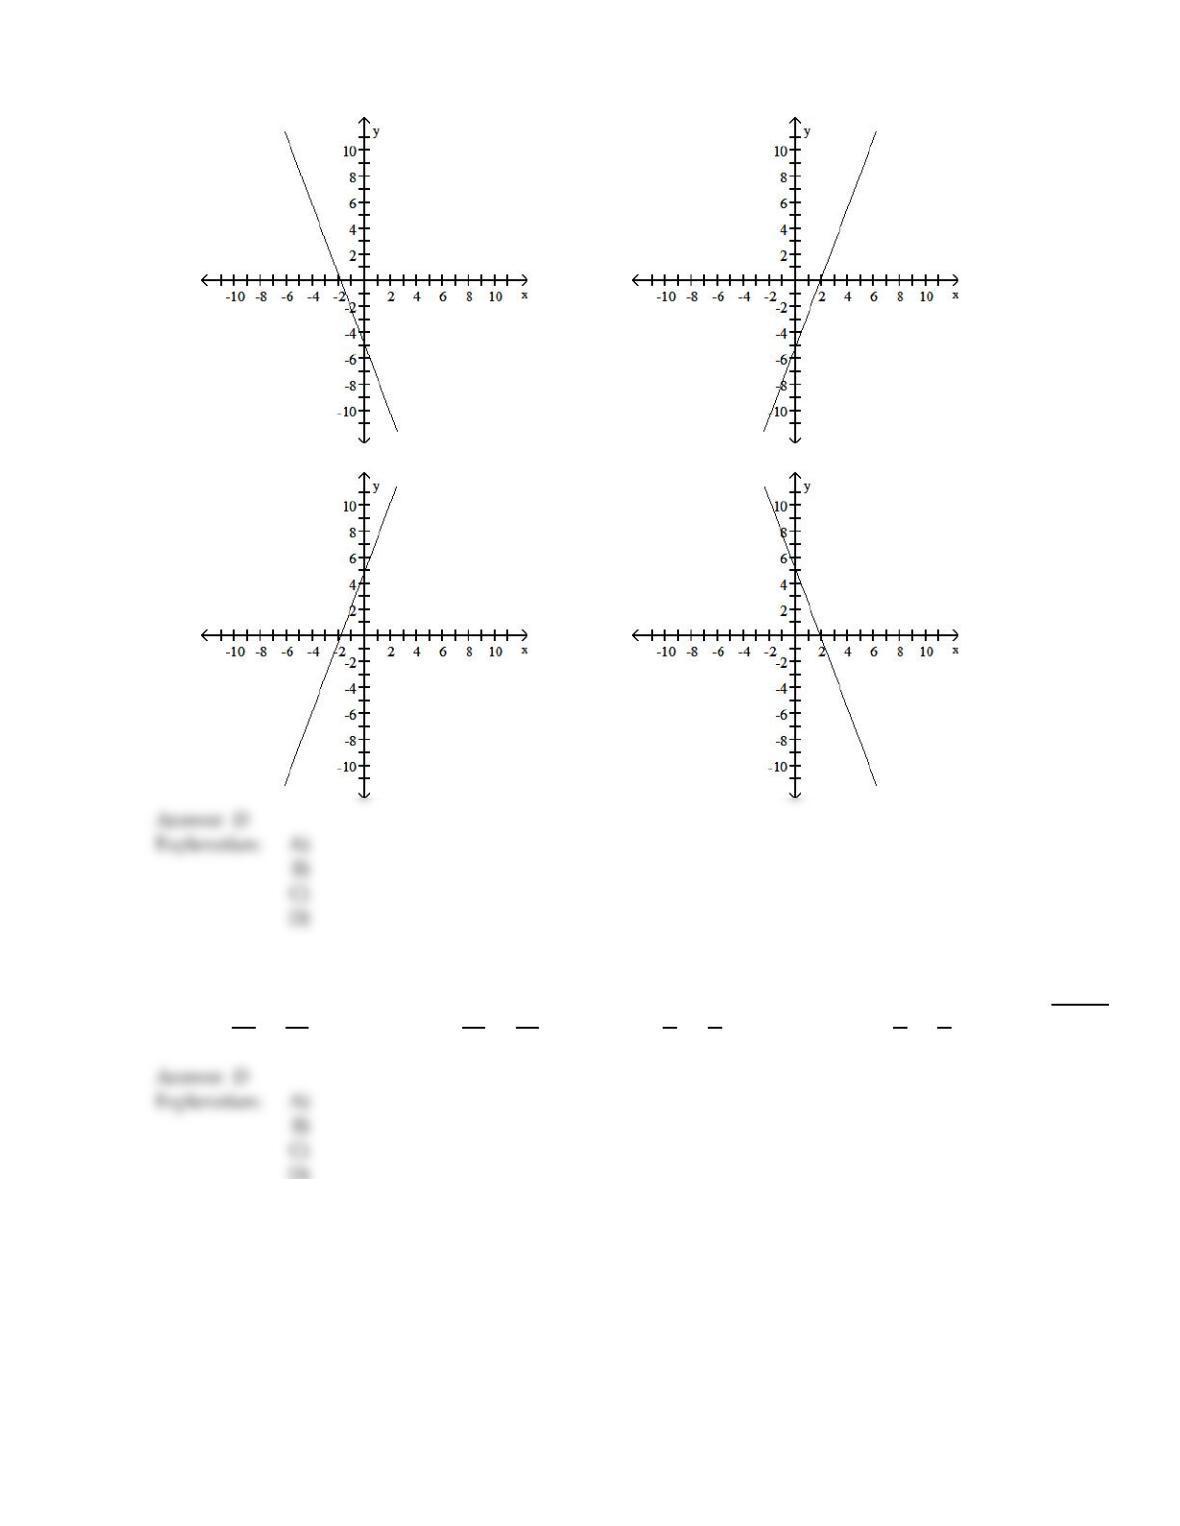
A)
B)
C)
D)
Find an equation in slope–intercept form (where possible) for the line.
153)
Through (–2, 0) and (–8, 5)
153)
A)
y =2
13 x +81
13
B)
y = – 2
13 x +81
13
C)
y =5
6x –5
3
D)
y = – 5
6x –5
3
D)
Graph the equation.
52
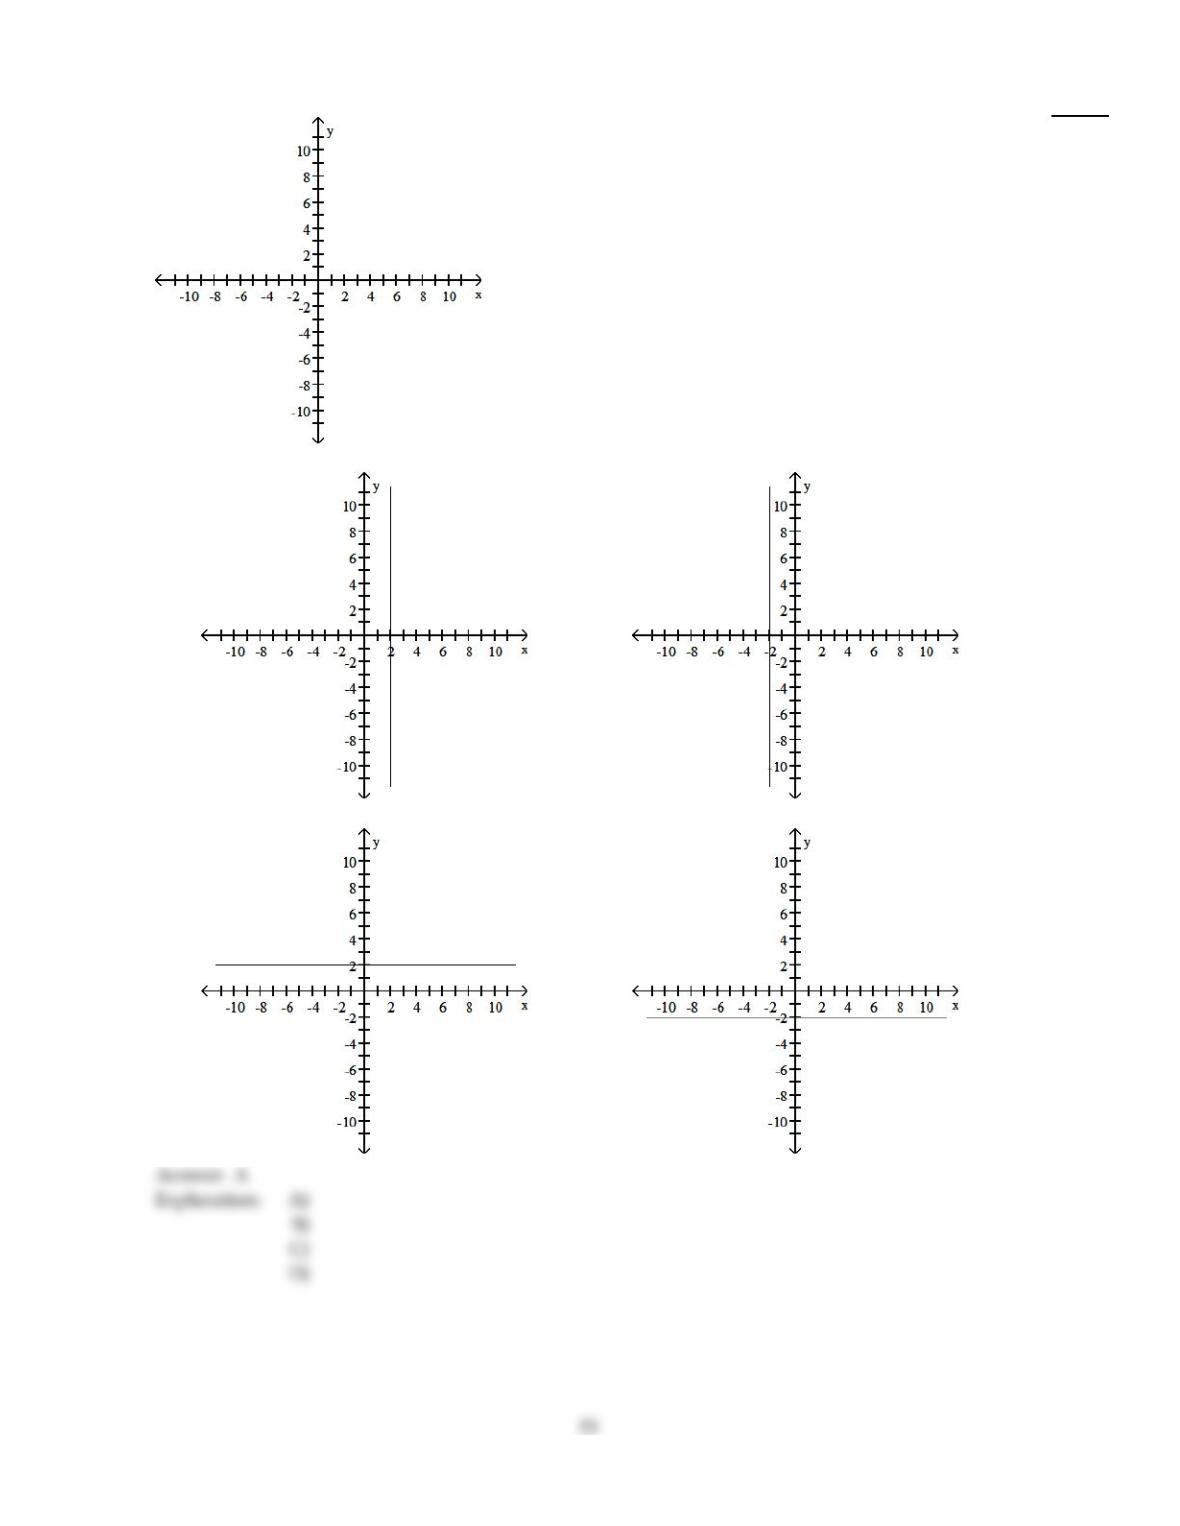
D)
154)
x – 2 = 0
154)
A)
B)
C)
D)
Evaluate the function as indicated.
155)
Find f(–6.5) when f(x) = – 3x – 6.9.
155)
A)
12.6
B)
26.4
C)
–26.4
D)
18.81
Find an equation in slope–intercept form (where possible) for the line.
156)
The line with y–intercept –2 and perpendicular to x +3y = – 4
156)
A)
y =1
3x – 2
B)
y =3x – 2
C)
y = – 3x – 2
D)
y = – 1
3x + 1
157)
Through (6, 4), perpendicular to –7x – 4y = – 58
157)
A)
y =4
7x +4
7
B)
y =7
4x + 4
C)
y = – 4
7x –4
7
D)
y =4
7x
158)
Through (–3, 4), m =2.5
158)
A)
y = – 2.5x – 3.5
B)
y =2.5x – 3.5
C)
y = – 2.5x + 11.5
D)
y =2.5x + 11.5
Solve the problem.
159)
The information in the chart below gives the salary of a person for the stated years. Model the data
with a linear function using the points (1, 24,400) and (3, 26,600). Then use this function to predict
the salary for the year 2007.
Year, x Salary, y
1990, 0 $23,500
1991, 1 $24,400
1992, 2 $25,200
1993, 3 $26,600
1994, 4 $27,200
159)
A)
$42,180
B)
$42,200
C)
$42,220
D)
$42,240
Evaluate the function as indicated.
160)
Find g 4 when g(x) =7–7x.
160)
A)
–1
2
B)
21
C)
– 21
D)
35
Graph the equation.
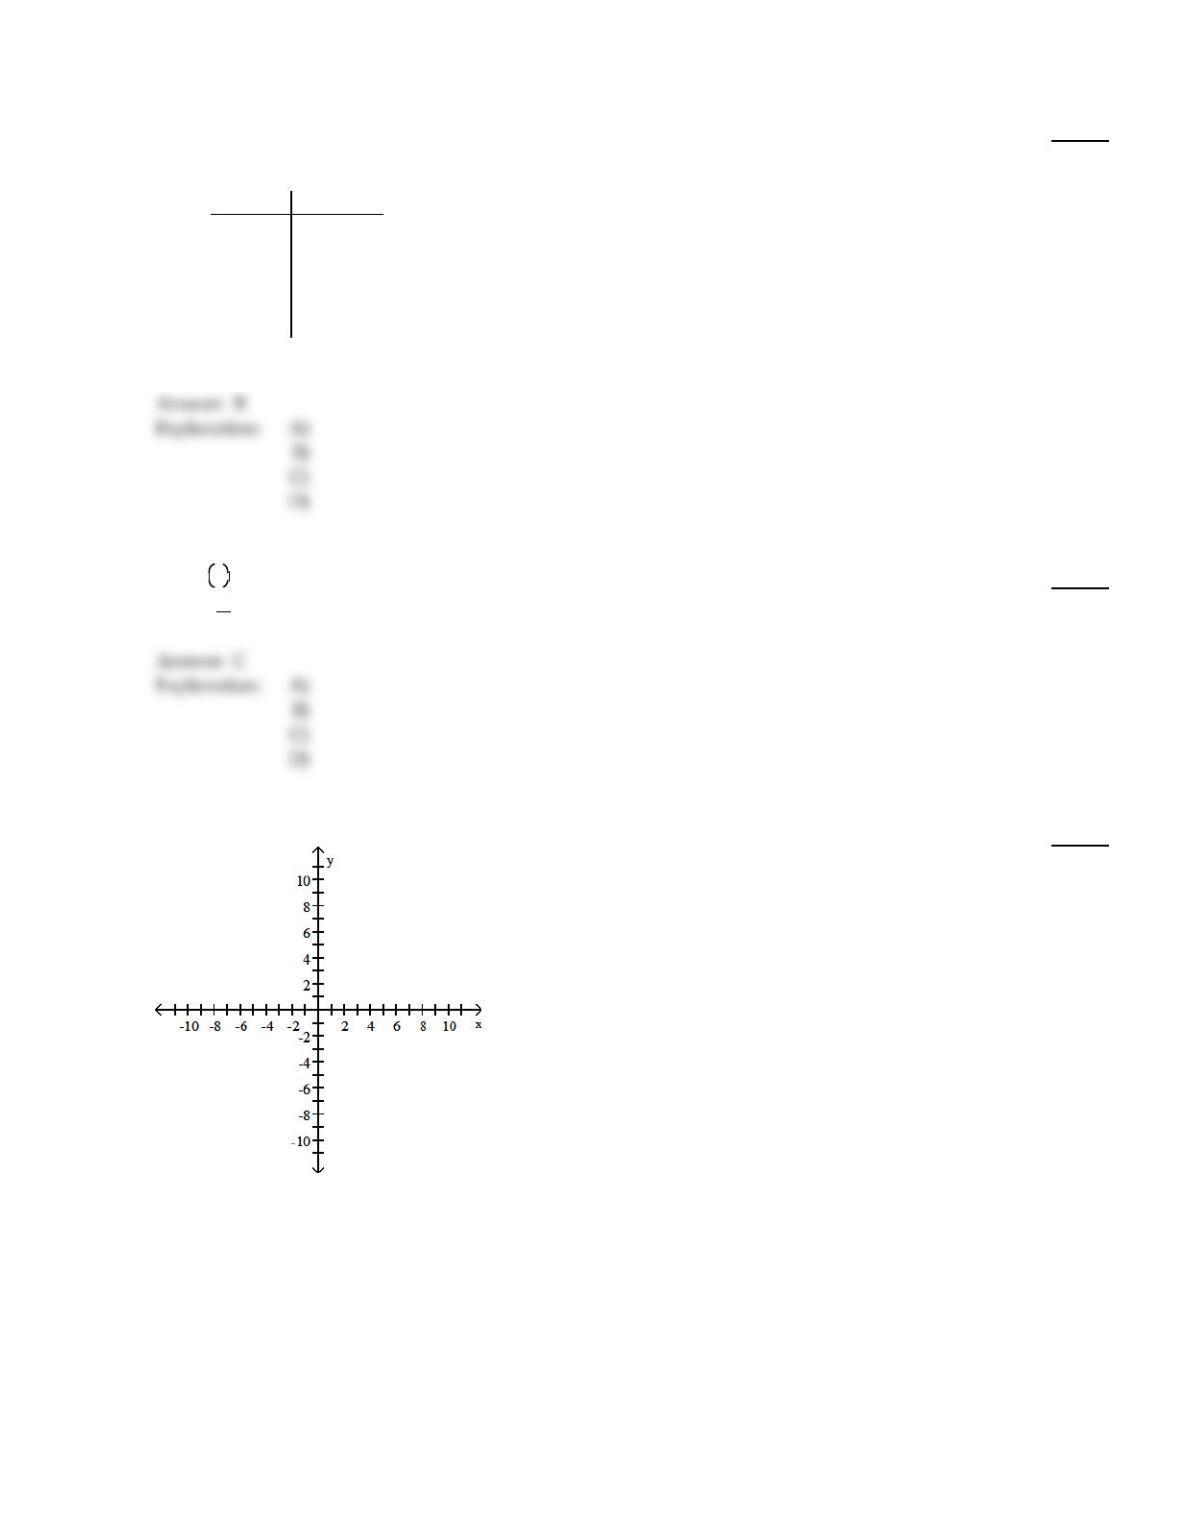
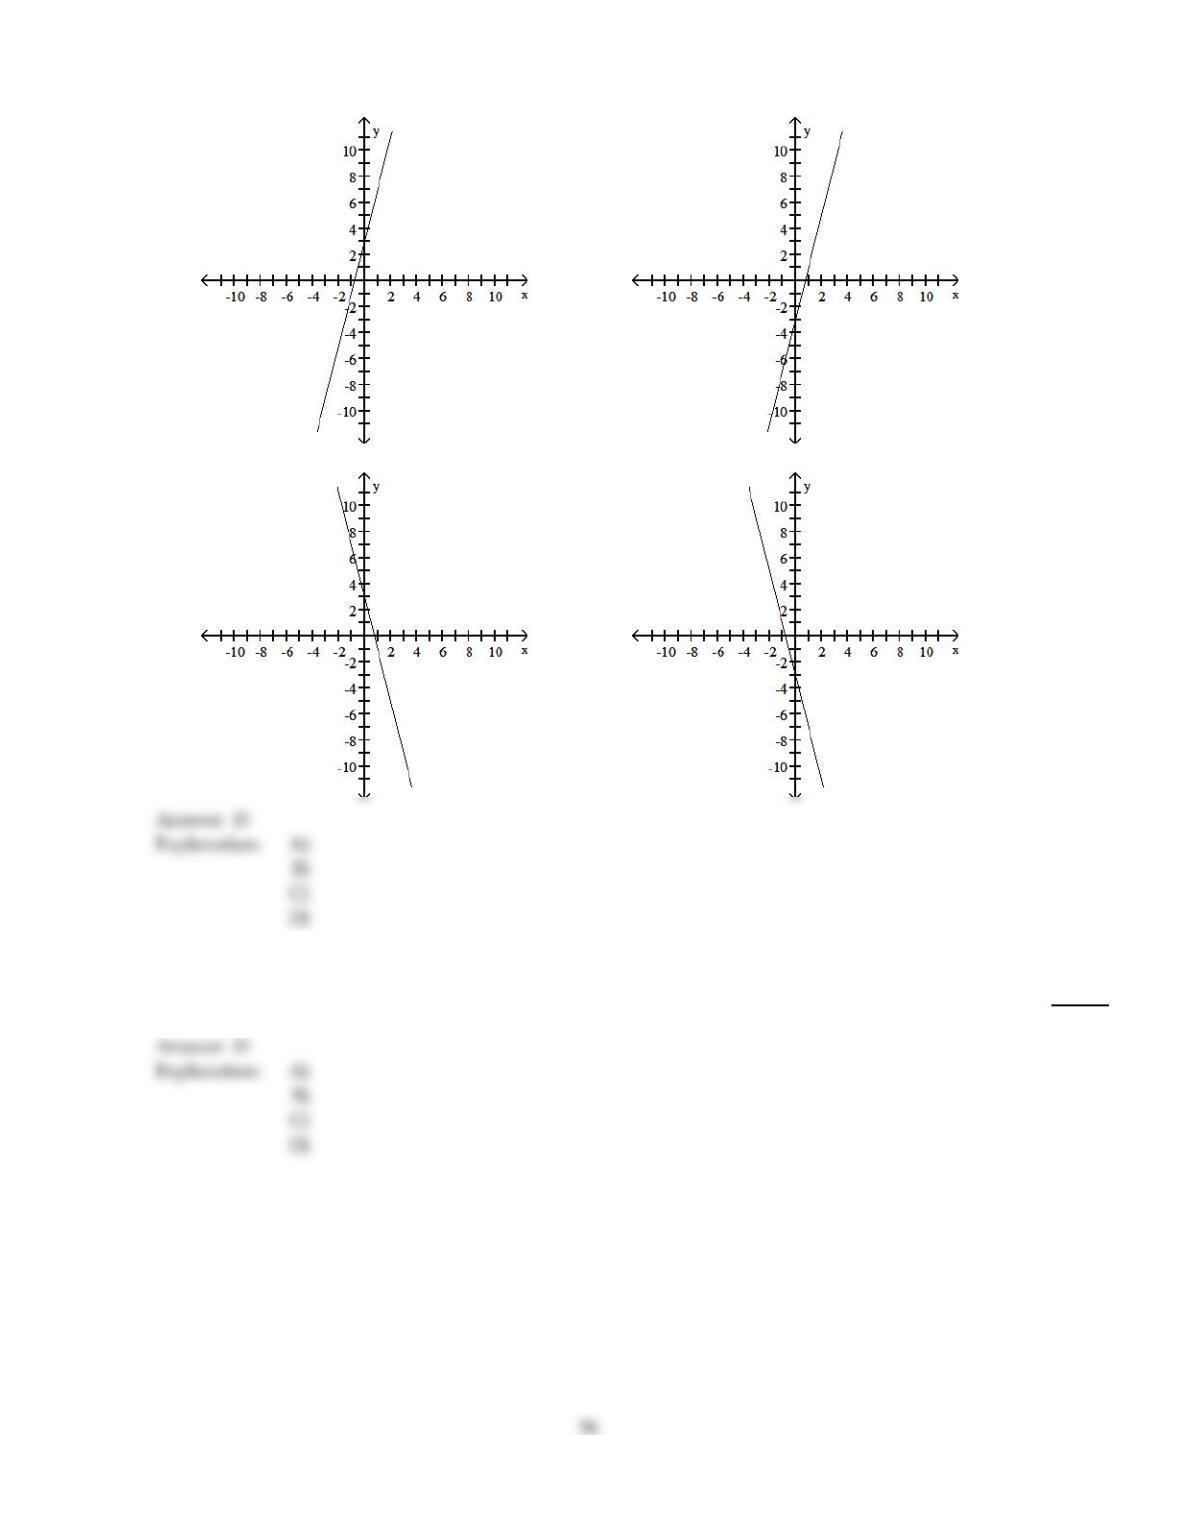
161)
4x + y = – 3
161)
55
A)
B)
C)
D)
Find the slope of the line.
162)
x =10
162)
A)
1
B)
0
C)
10
D)
Not defined
Solve the problem.
163)
The mathematical model C =600x + 60,000 represents the cost in dollars a company has in
manufacturing x items during a month. Based on this, how much does it cost to produce 500 items?
163)
A)
$360,000
B)
$100.00
C)
$300,000
D)
$0.20
Find an equation in slope–intercept form (where possible) for the line.
164)
Through (–1, 1) and (8, 5)
164)
A)
y =2
3x +31
3
B)
y = – 4
9x +13
9
C)
y = – 2
3x +31
3
D)
y =4
9x +13
9
Find the equation of the least squares line.
165)
Ten students in a graduate program were randomly selected. Their grade point averages (GPAs)
when they entered the program were between 3.5 and 4.0. The following data were obtained
regarding their GPAs on entering the program versus their current GPAs.
Entering GPA (x) Current GPA (y)
3.5 3.6
3.8 3.7
3.6 3.9
3.6 3.6
3.5 3.9
3.9 3.8
4.0 3.7
3.9 3.9
3.5 3.8
3.7 4.0
165)
A)
y = 2.51 + 0.329x
B)
y = 4.91 + 0.0212x
C)
y = 3.67 + 0.0313x
D)
y = 5.81 + 0.497x
Find the correlation coefficient.
166)
The following are costs of advertising (in thousands of dollars) and the number of products sold (in
thousands):
Cost 6 3 7 6 10 4 7 7
Number 54 75 91 57 96 52 92 100
166)
A)
0.6112
B)
–0.3707
C)
0.2635
D)
0.6756
Answer Key
Testname: C1
Answer Key
Testname: C1
Answer Key
Testname: C1
Answer Key
Testname: C1