Stewart_Calc_7ET ch01sec05
MULTIPLE CHOICE
1. Use the Law of Exponents to rewrite and simplify the expression.
a.
b.
c.
d.
e.
2. Starting with the graph of , find the equation of the graph that results from reflecting
about the line .
a.
b.
c.
d.
e.
3. Use the Law of Exponents to rewrite and simplify the expression.
a.
b.
c.
d.
e.
4. Starting with the graph of , write the equation of the graph that results from shifting 5
units right.
a.
b.
c.
d.
e.
5. The table gives the population of the United States, in millions, for the years 1900 – 2000.
Use a graphing calculator with exponential regression capability to model the U.S.
population since 1900. Use the model to estimate the population in 1965 and to predict the
population in the year 2025.
Year
1900
1910
1920
1930
1940
1950
1960
1970
1980
1990
2000
Population
(millions)
76
92
106
123
131
150
179
203
227
250
281
a.
186 million, 402 million
b.
191 million, 407 million
c.
196 million, 412 million
d.
181 million, 397 million
e.
176 million, 392 million
6. Under ideal conditions a certain bacteria population is known to double every three hours.
Suppose that there are initially 45 bacteria. What is the size of the population after 15 hours?
a.
2880 bacteria
b.
180 bacteria
c.
1440 bacteria
d.
360 bacteria
e.
720 bacteria
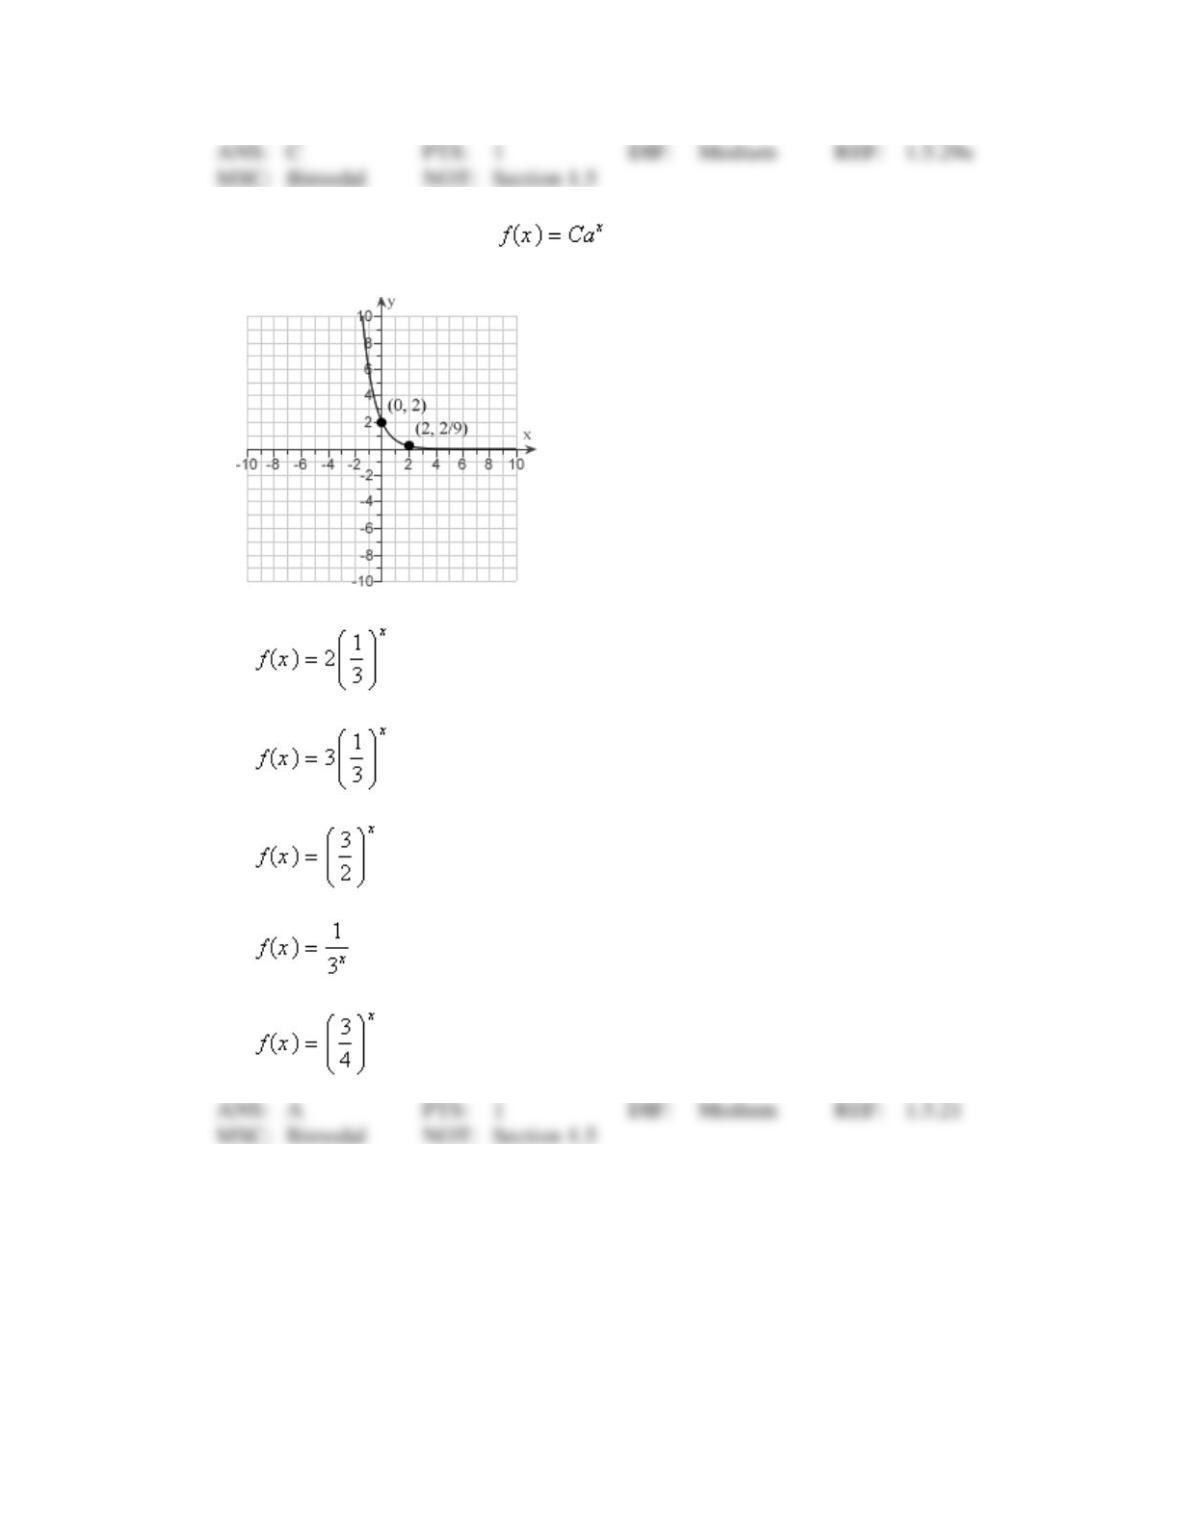
7. Find the exponential function whose graph is given.
a.
b.
c.
d.
e.