Exam
Name___________________________________
MULTIPLE CHOICE. Choose the one alternative that best completes the statement or answers the question.
Write an equation of the line with the indicated slope and y intercept.
1)
Slope = – 2
3; y intercept =13
3
1)
A)
y =2
3x +7
3
B)
y = – 2
3x +13
3
C)
y = – 3
2x +13
3
D)
y = – 2
3x –13
3
Solve the problem. Express your answer as an integer or simplified fraction.
2)
-5(2x +1) –2=-2(x +5) +5x
2)
A)
3
13
B)
– 6
13
C)
9
13
D)
3
7
Determine whether the slope of the line is positive, negative, zero, or undefined.
3)
3)
A)
undefined
B)
positive
C)
negative
D)
zero
Provide an appropriate response.
4)
Find the line passing through the two points. Write the equation in standard form.
(–3, 6) and (6, 6)
4)
A)
x = – 2
B)
–2x – y 0
C)
–x – 2y = 0
D)
y = 6
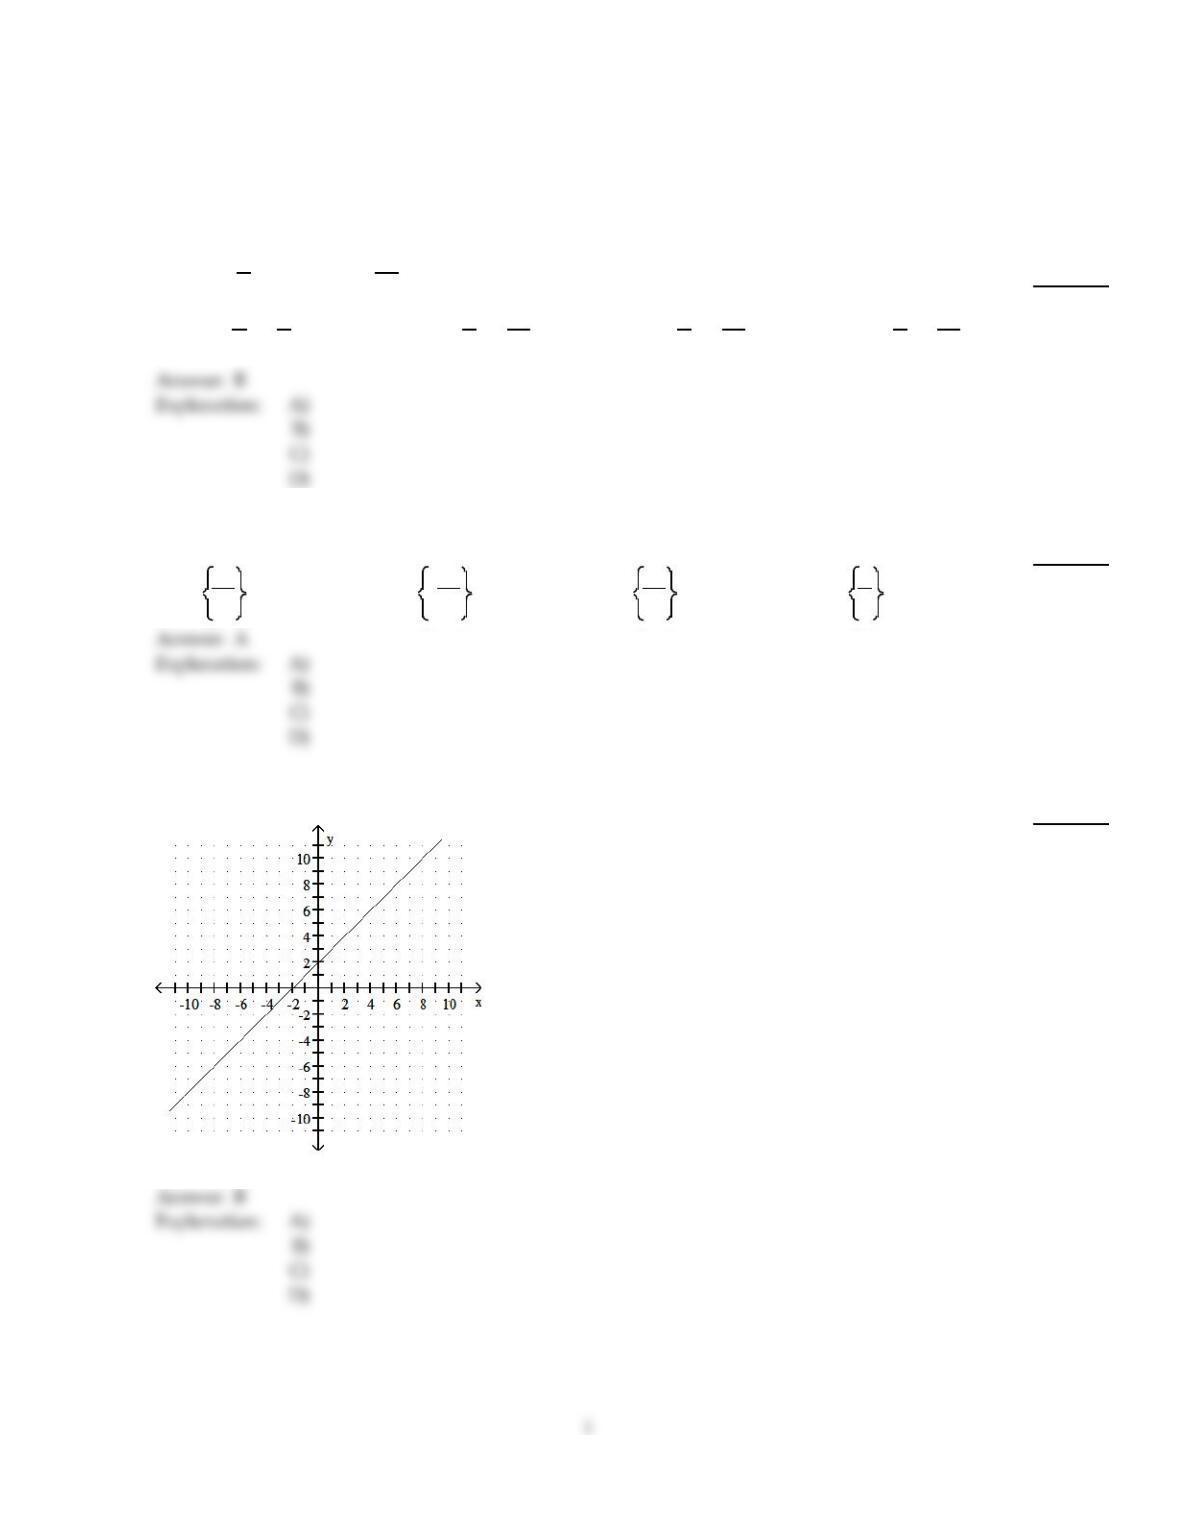
5)
Use the graph to find the slope–intercept form of the equation of the line.
5)
A)
y = x – 3
B)
y = – x + 3
C)
y = 3x
D)
y = x + 3
Write an equation of the line with the indicated slope and y intercept.
6)
Slope =2, y intercept = – 5
6)
A)
y = – 2x –5
B)
y =5x –2
C)
y =2x –5
D)
y =5x +2
Provide an appropriate response.
7)
Given two points (x1, y1) and (x2, y2), the ratio of the change in y to the change in x is called.
7)
A)
equilibrium point
B)
slope
C)
break–even point
D)
x–intercept
Solve the problem.
8)
The mathematical model C = 600 x + 30,000 represents the cost in dollars a company has in
manufacturing x items during a month. Using this model, how much does it cost to produce 600
items?
8)
A)
$390,000
B)
$360,000
C)
$0.08
D)
$50.00
Find the slope and y intercept of the graph of the equation.
9)
y =x+ 3
9)
A)
Slope =3; y intercept = 1
B)
Slope =3; y intercept = – 1
C)
Slope =0; y intercept =-3
D)
Slope =1; y intercept =3
Solve the problem.
10)
You have $50,000 and wish to invest part at 10% and the rest at 6%. How much should be invested
at each rate to produce the same return as if it all had been invested at 9%?
10)
A)
$37,500 at 6%, $12,500 at 10%
B)
$37,000 at 6%, $13,000 at 10%
C)
$37,500 at 10%, $12,500 at 6%
D)
$37,000 at 10%, $13,000 at 6%
Use the REGRESSION feature on a graphing calculator.
11)
A study was conducted to compare the average time spent in the lab each week versus course
grade for computer students. The results are recorded in the table below.
Hours in lab 10 11 16 9 7 15 16 10
Grade (percent) 96 51 62 58 89 81 46 51
Use linear regression to find a linear function that predicts a student’s course grade as a function of
the number of hours spent in lab.
11)
A)
y = 44.3 + 0.930x
B)
y = 88.6 – 1.86x
C)
y = 1.86 + 88.6x
D)
y = 0.930 + 44.3x
Write an equation of the line with the indicated slope and y intercept.
12)
Slope =5
2; y intercept = – 3
2
12)
A)
y =5
2x –3
2
B)
y =3
2x –5
2
C)
y =5
2x +3
2
D)
y = – 3
2x +5
2
Find the slope and y intercept of the graph of the equation.
13)
y =2x –7
13)
A)
Slope =2, y intercept = – 7
B)
Slope =2, y intercept =7
C)
Slope =7, y intercept =2
D)
Slope = – 7, y intercept =2
Solve the formula for the specified variable.
14)
7x + 10y = 19 for y
14)
A)
y = 7x – 19
B)
y = – 7
10 x +19
10
C)
– 7x – 10y = – 19
D)
y =7
10 x +19
10
Write an equation of the line with the indicated slope and y intercept.
15)
Slope =1; y intercept =-2
15)
A)
y =x– 2
B)
y =-2x – 1
C)
y =-2x + 1
D)
y = – x – 2
Use the REGRESSION feature on a graphing calculator.
16)
Efficiency experts rate employees according to job performance and attitude. The results for several
randomly selected employees are given below.
Attitude, x 59 63 65 69 58 77 76 69 70 64
Performance, y 72 67 78 82 75 87 92 83 87 78
Find the regression line which can be used to predict performance rating if attitude rating is
known.
16)
A)
y = 92.3 – 0.669x
B)
y = – 47.3 + 2.02x
C)
y = 2.81 + 1.35x
D)
y = 11.7 + 1.02x
Solve the inequality and graph. Express your answer in interval notation.
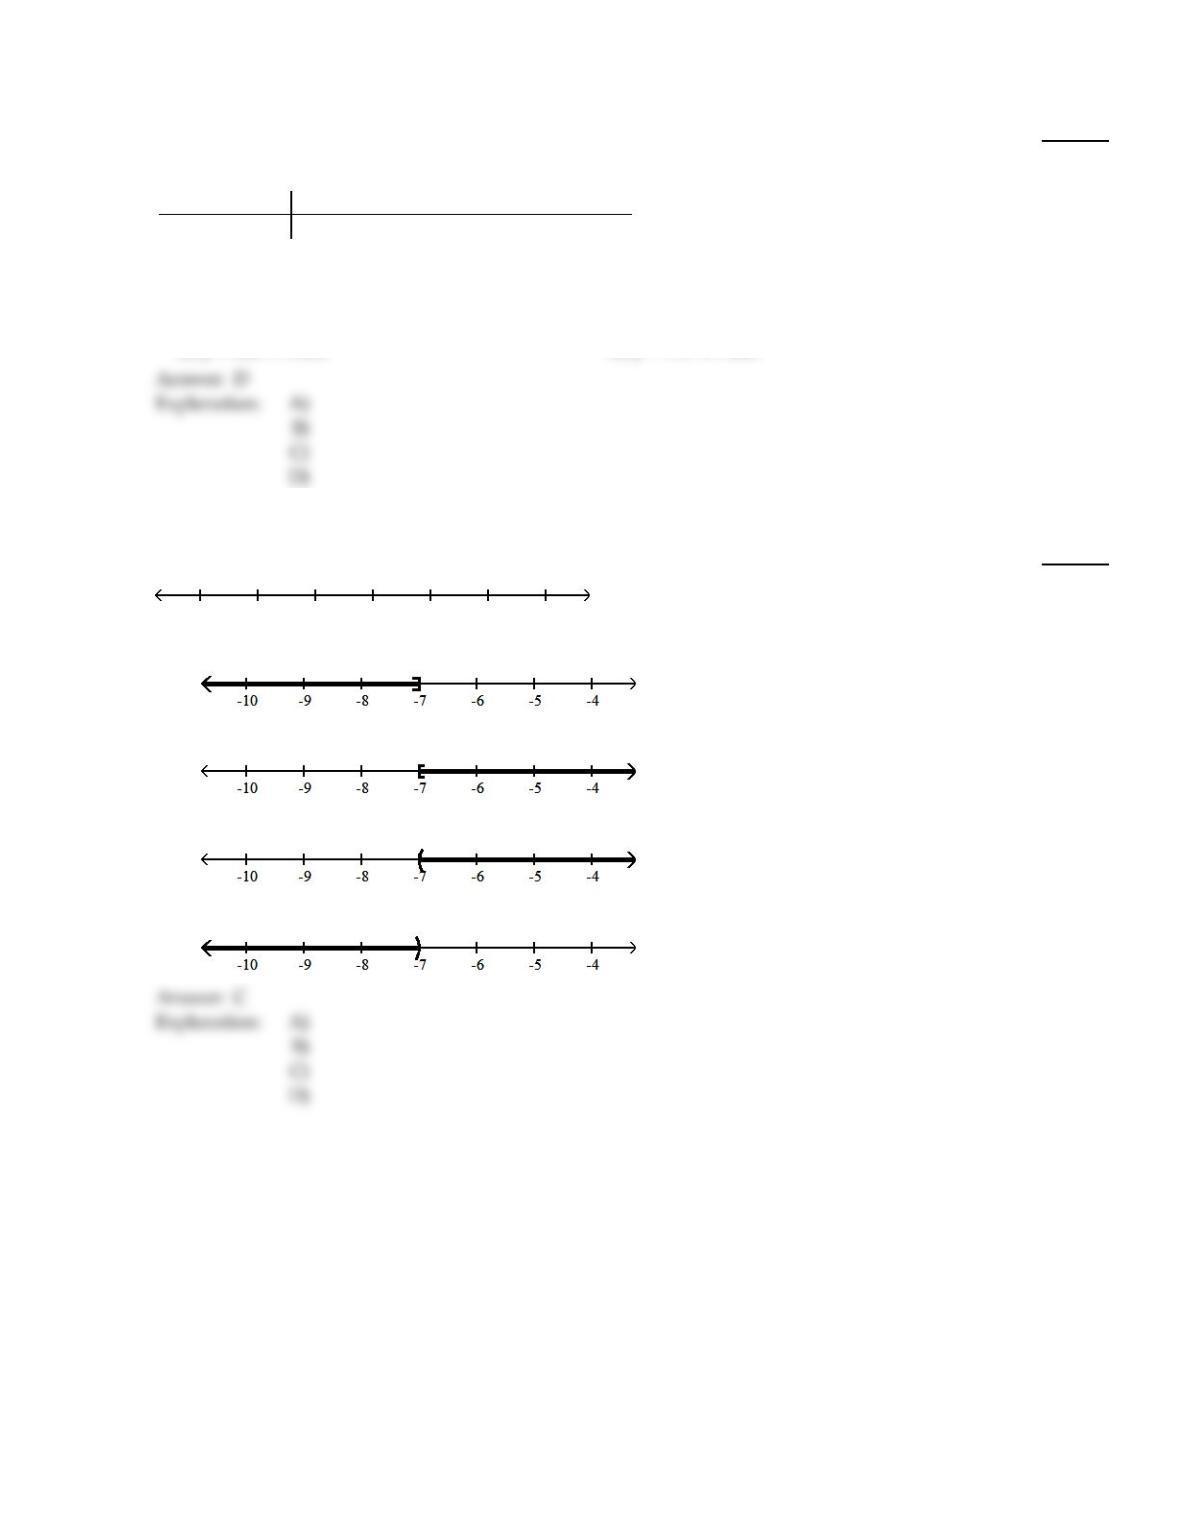
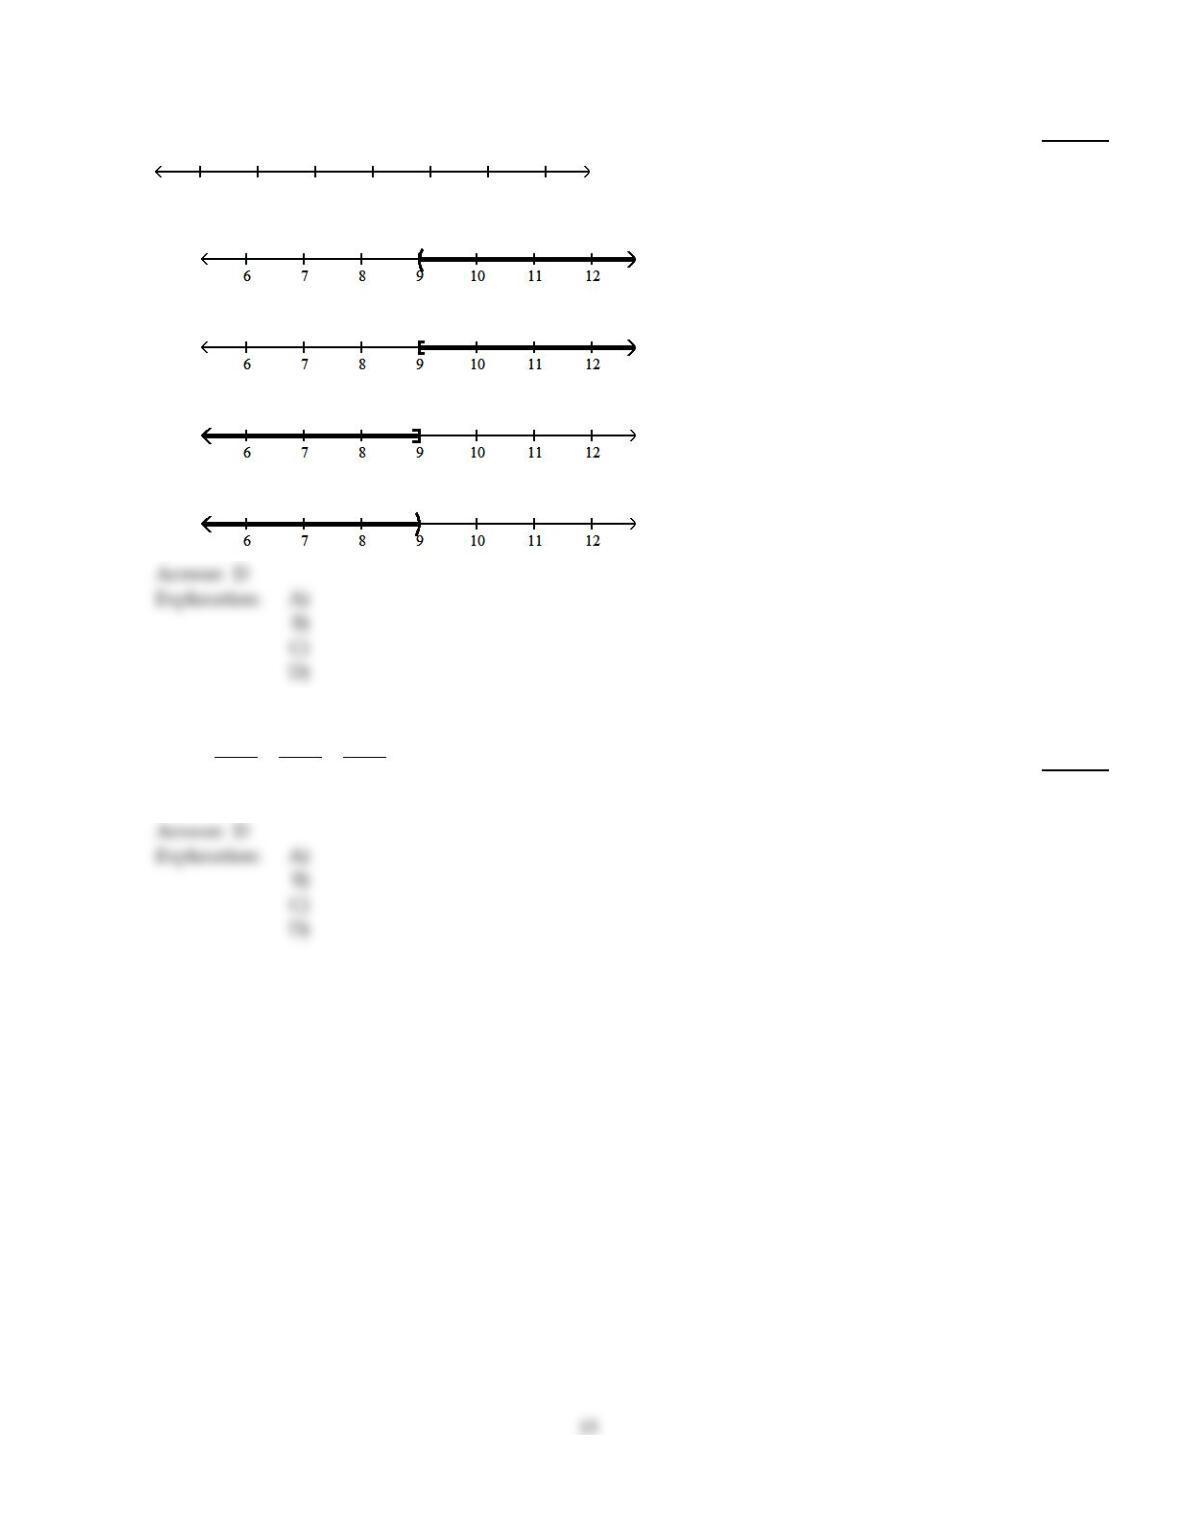
17)
12x – 4 >4(2x – 8)
17)
A)
(–, -7]
B)
[-7, )
C)
(-7, )
D)
(–, -7)
5
Use the REGRESSION feature on a graphing calculator.
18)
For some reason the quality of production decreased as the year progressed at a flash drive
manufacturing plant. The following data represent the percentage of defective flash drives
produced at the plant in the corresponding month of the year.
Month, x 2 3 5 7 8 9 12
% defective, y 1.3 1.6 2.0 2.4 2.6 2.8 3.1
Use the regression equation with values rounded to four decimals to predict the percentage of
defective drives in month 6, June.
18)
A)
2.15%
B)
2.0%
C)
2.20%
D)
2.3%
Solve the inequality and graph. Express your answer in interval notation.
19)
6x + 4 >5x + 8
19)
A)
(–, 4]
B)
[4, )
C)
(4, )
D)
(12, )
Solve the formula for the specified variable.
20)
S = 2rh + 2r2 for h
20)
A)
h =S
2r– 1
B)
h = 2(S – r)
C)
h = S – r
D)
h =S – 2r2
2r
6
Provide an appropriate response.
21)
Write the equation of a line that passes through (3, 9) and (0, –7). Write the final answer in the form
Ax + By = C where A, B, and C are integers with no common divisors (other than ±1) and A > 0.
21)
A)
16x – 3y = 21
B)
16x – 3y = – 21
C)
–16x + 3y = 21
D)
3x – 16y = 21
Find the slope of the line containing the given points.
22)
(2, -9); (-4, 8)
22)
A)
17
6
B)
– 6
17
C)
6
17
D)
– 17
6
D
Provide an appropriate response.
23)
Find the line passing through the two points. Write the equation in standard form.
(10, 9) and (10, 1)
23)
A)
x = 10
B)
x + y = 11
C)
x + y = 19
D)
y = 9
A
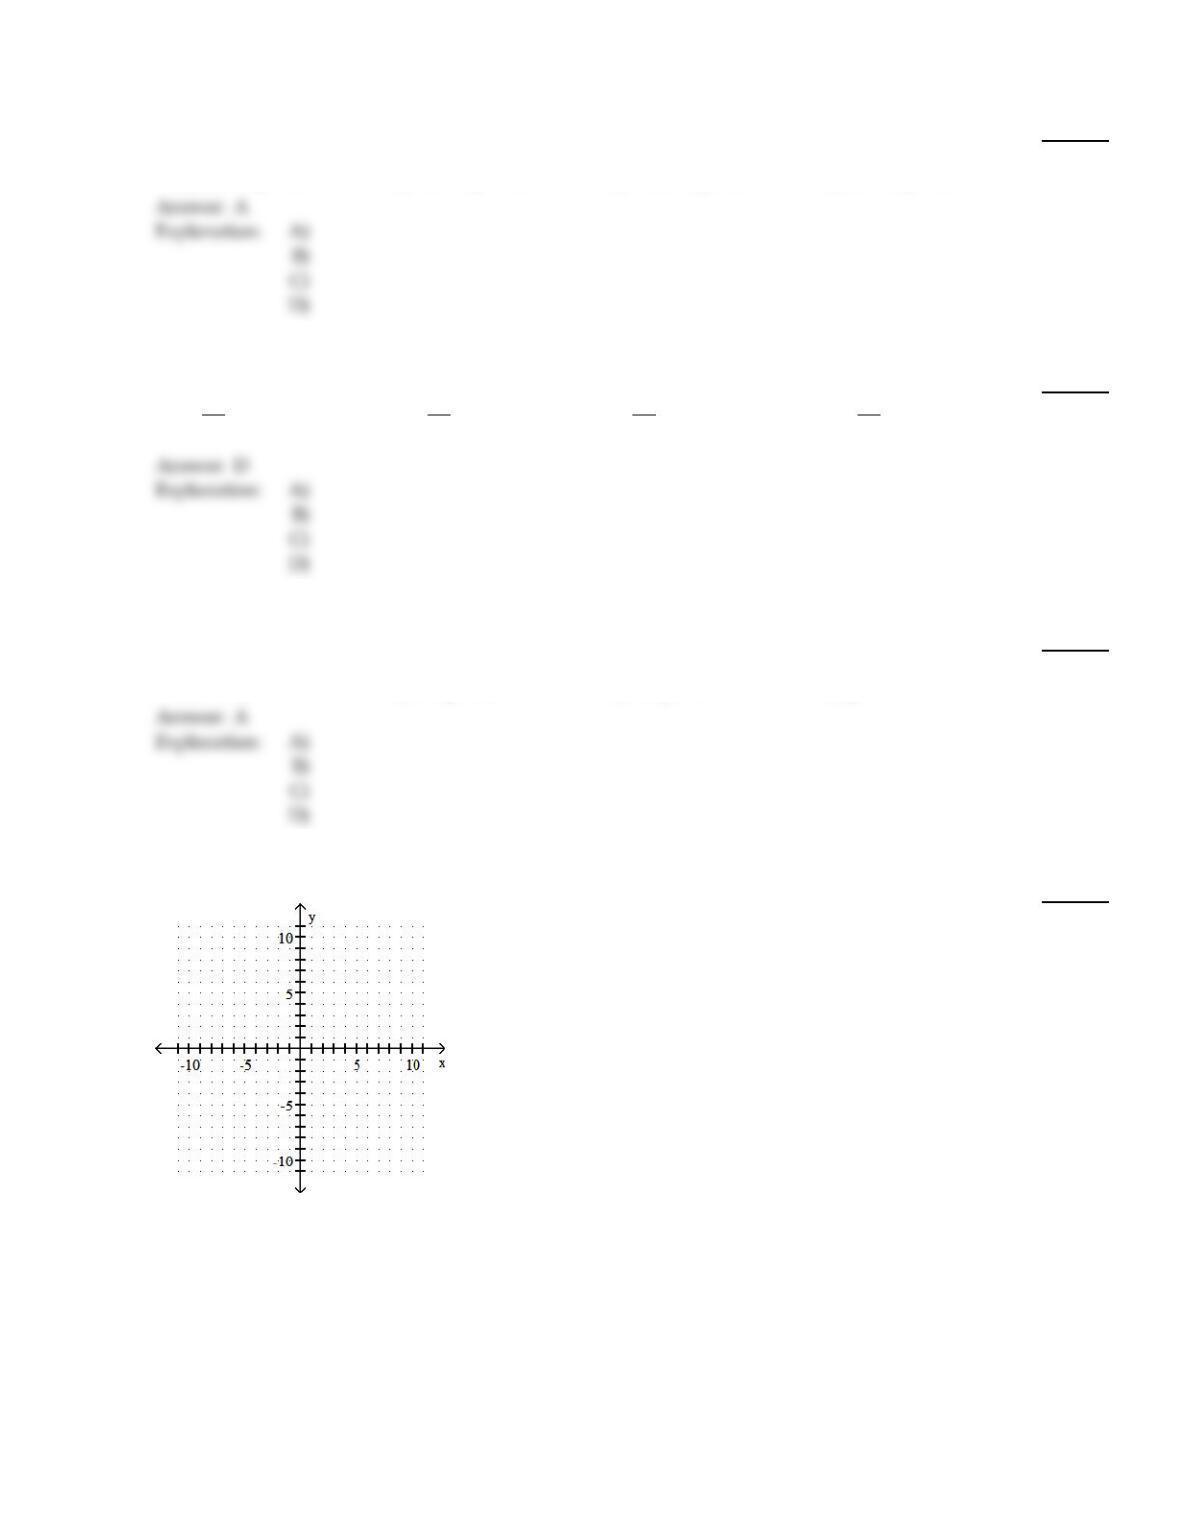
Graph the equation.
24)
63 +9y = 0
24)
7
A
A)
B)
C)
D)
8
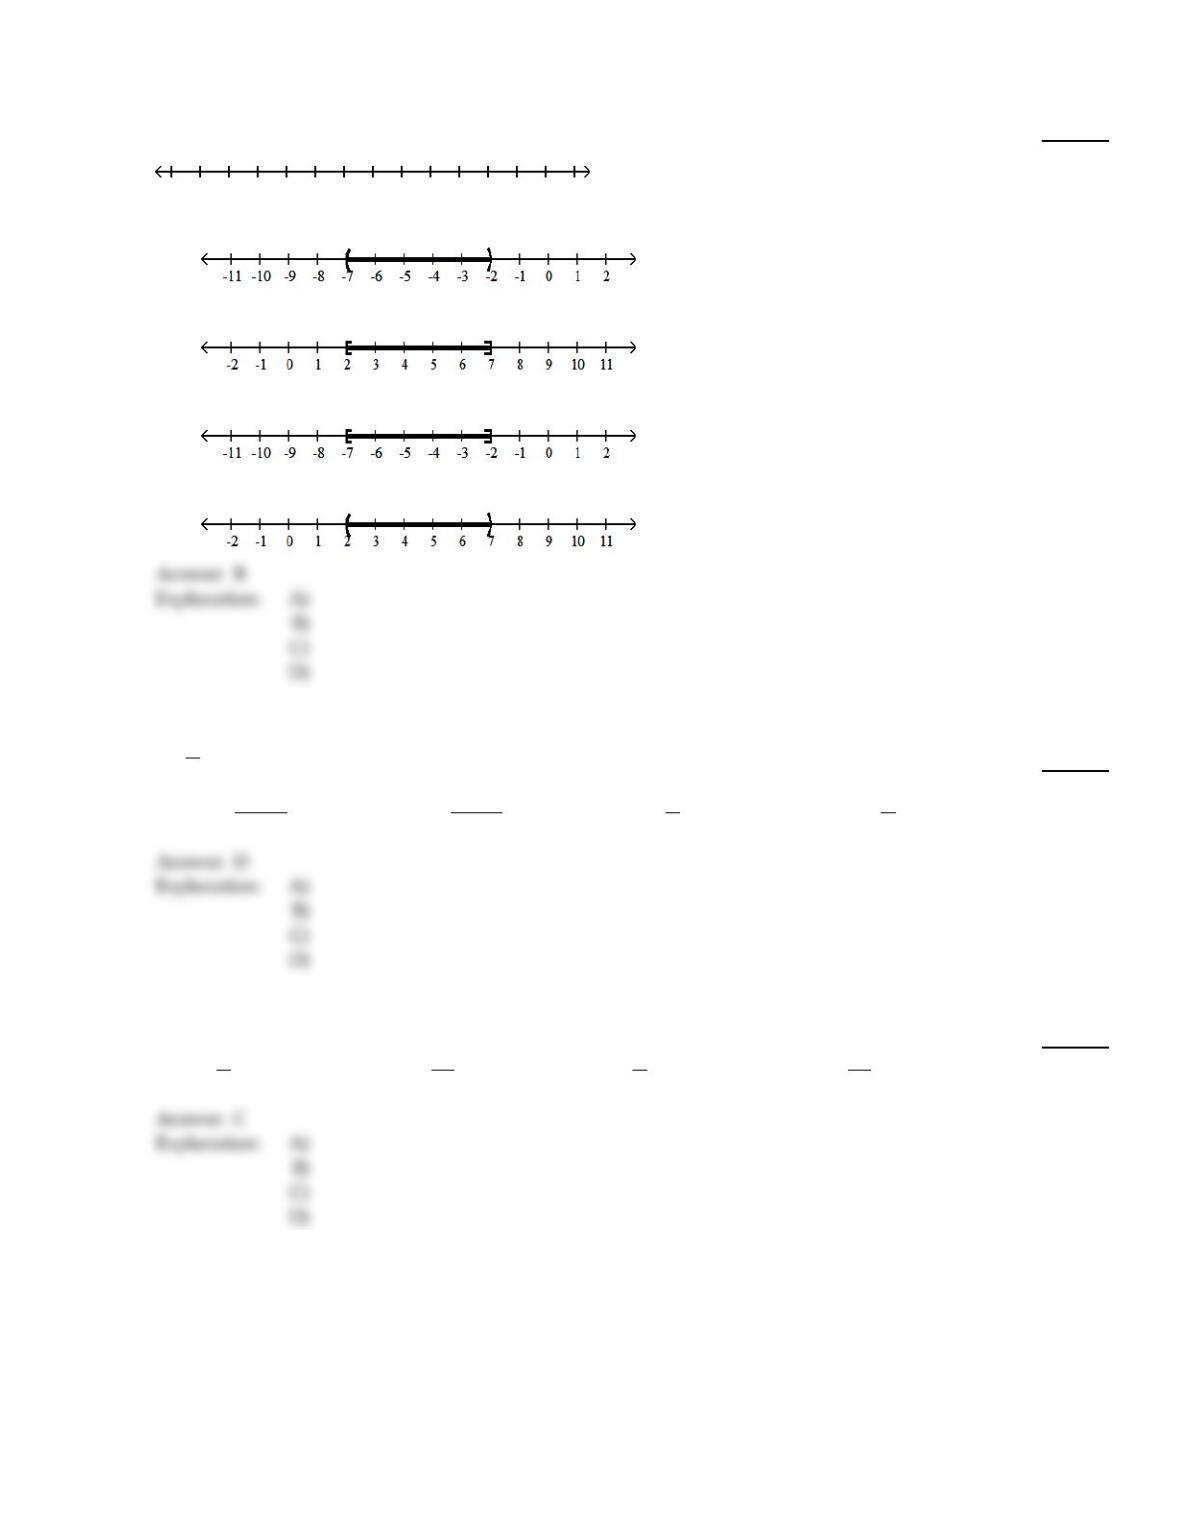
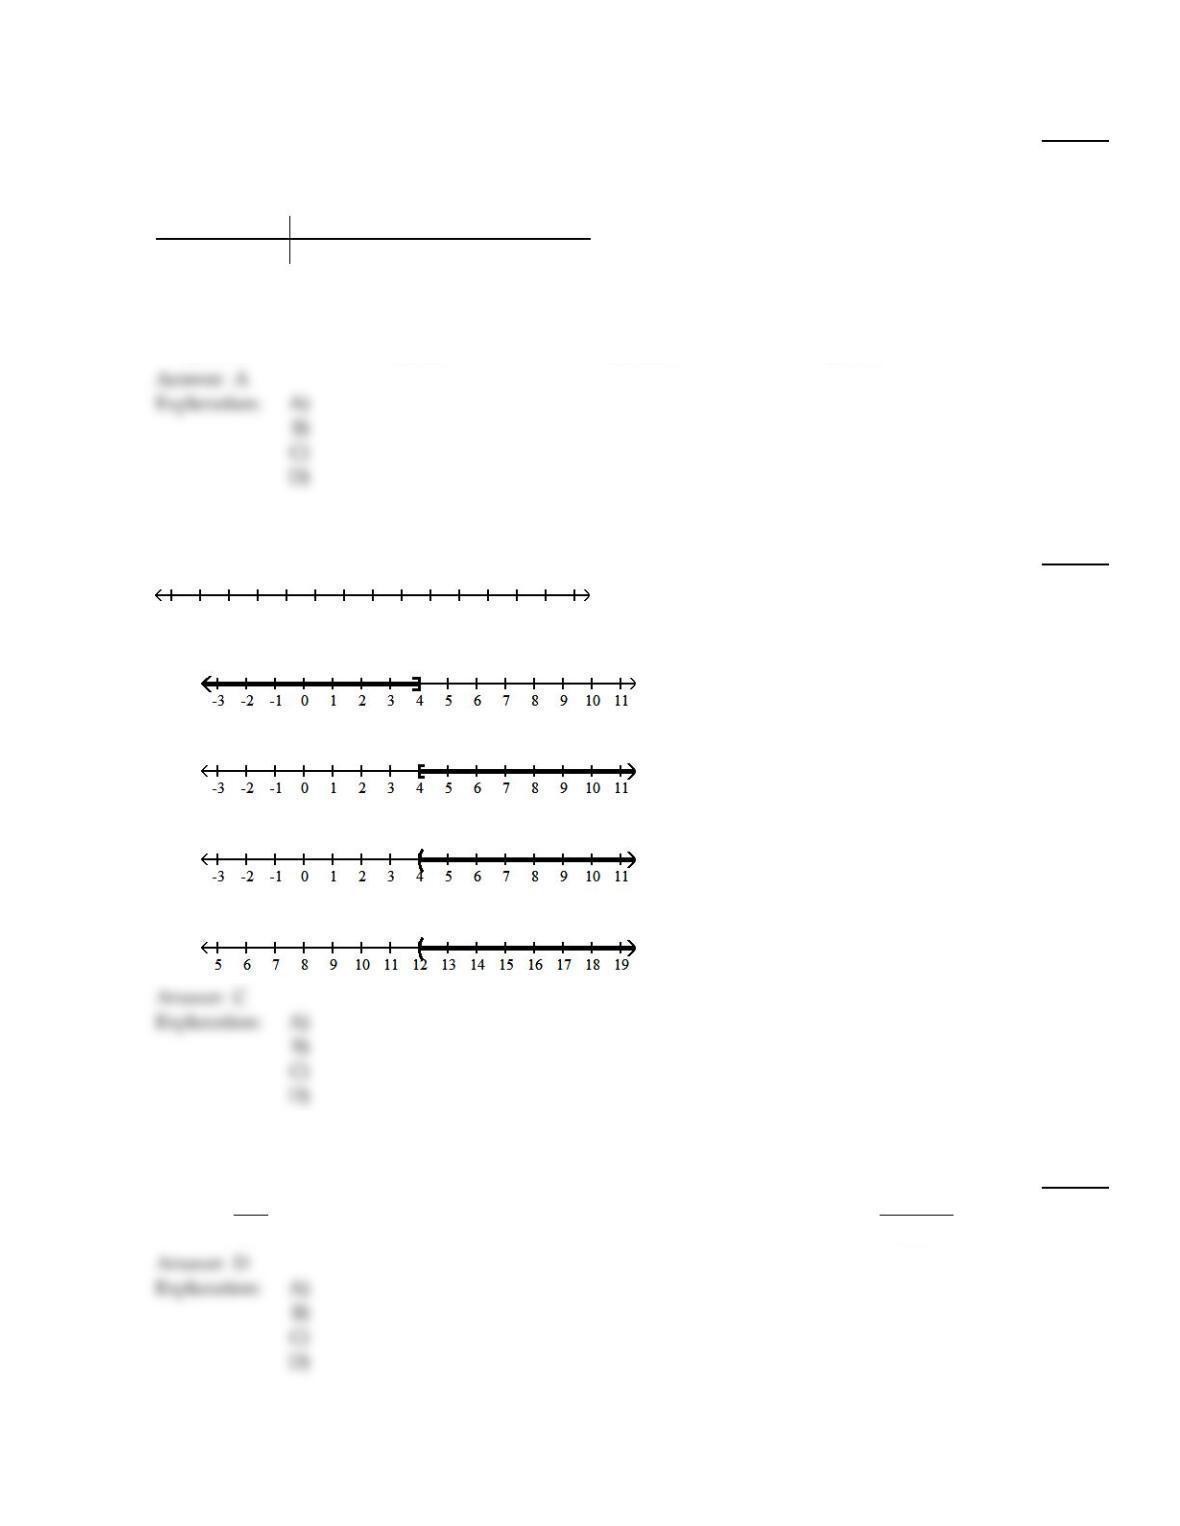
Solve the inequality and graph. Express your answer in interval notation.
25)
-12 -2x + 2 -2
25)
A)
(-7, -2)
B)
[2, 7]
C)
[-7, -2]
D)
(2, 7)
Solve the formula for the specified variable.
26)
F =9
5C + 32 for C
26)
A)
C =5
F – 32
B)
C =F – 32
9
C)
C =9
5(F – 32)
D)
C =5
9(F – 32)
Solve the problem. Express your answer as an integer or simplified fraction.
27)
7x – (5x – 1) = 2
27)
A)
–1
2
B)
–1
12
C)
1
2
D)
1
12
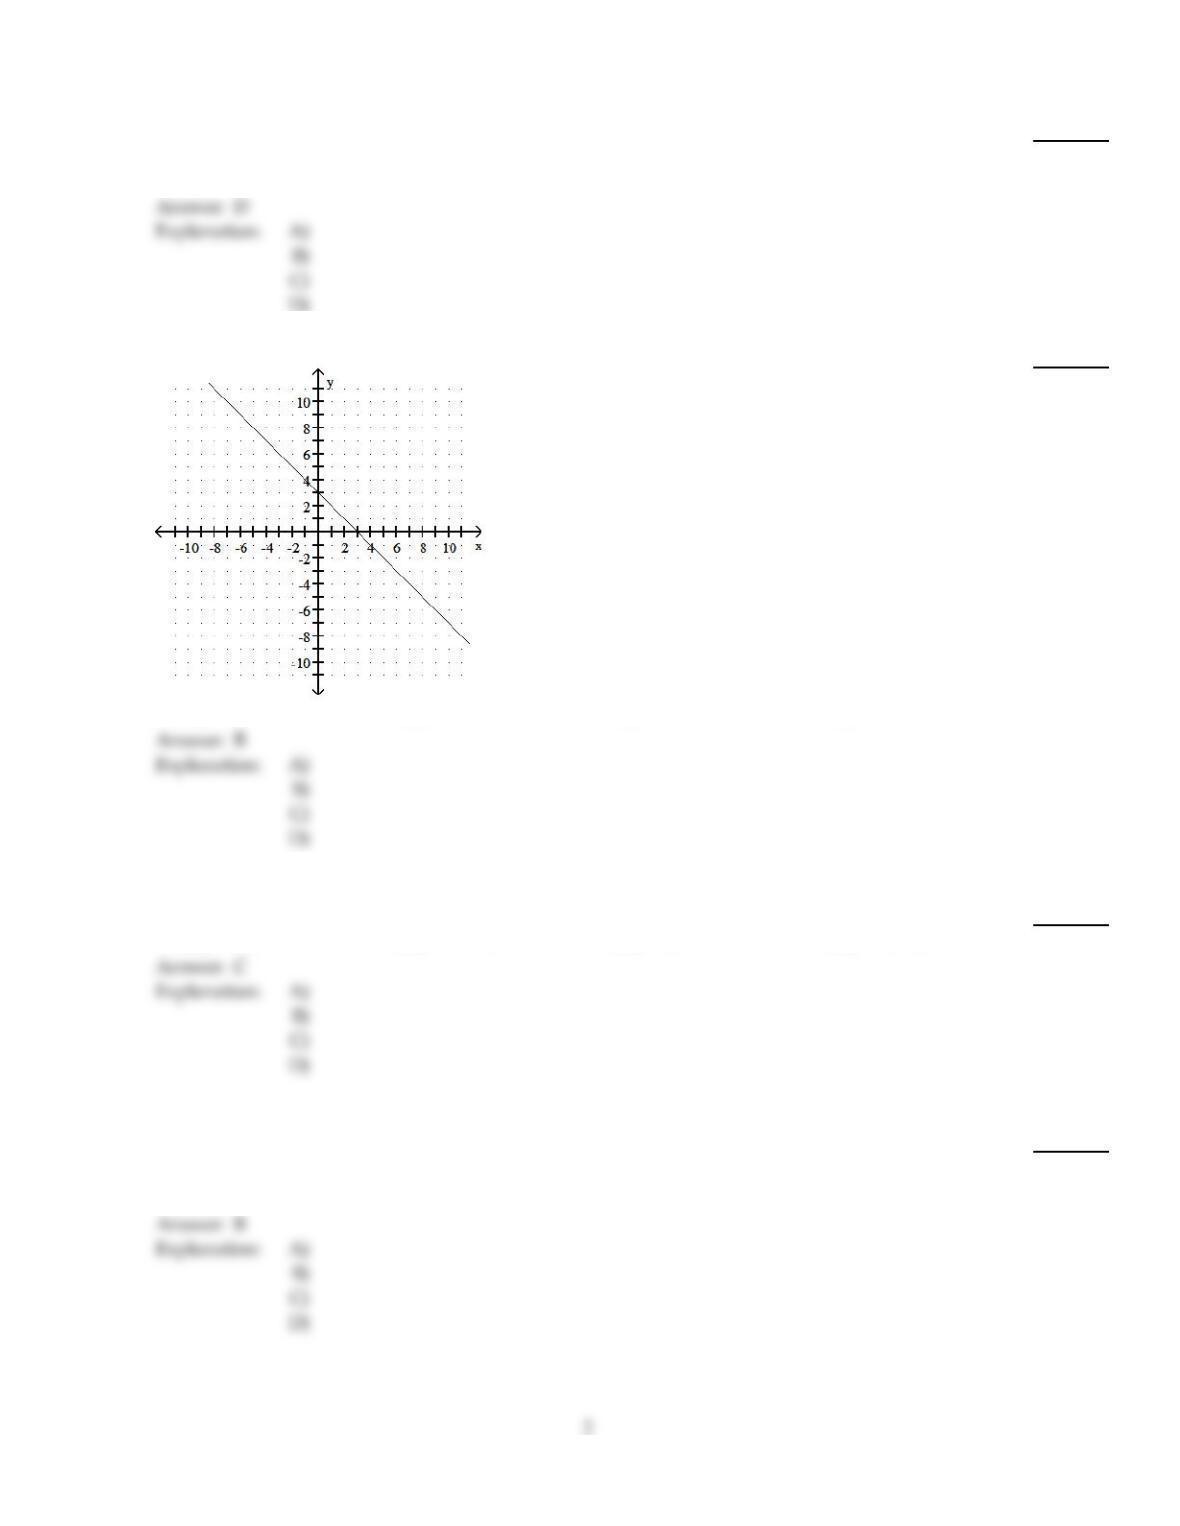
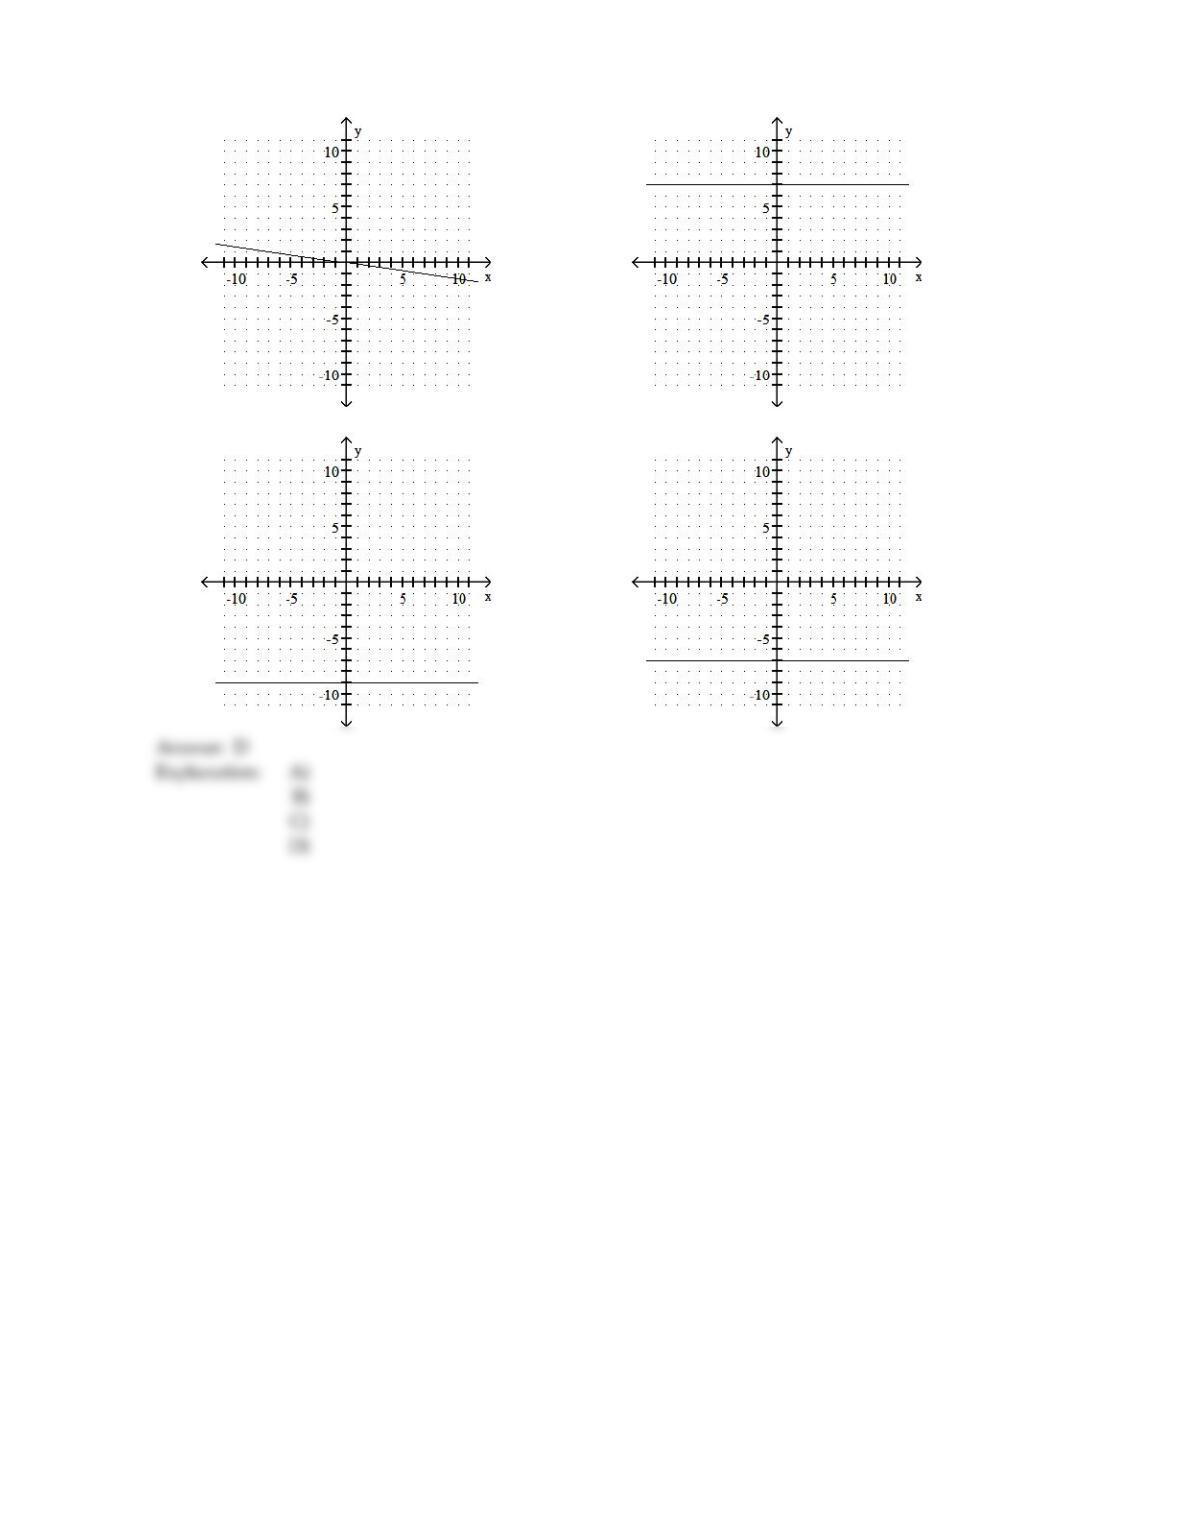
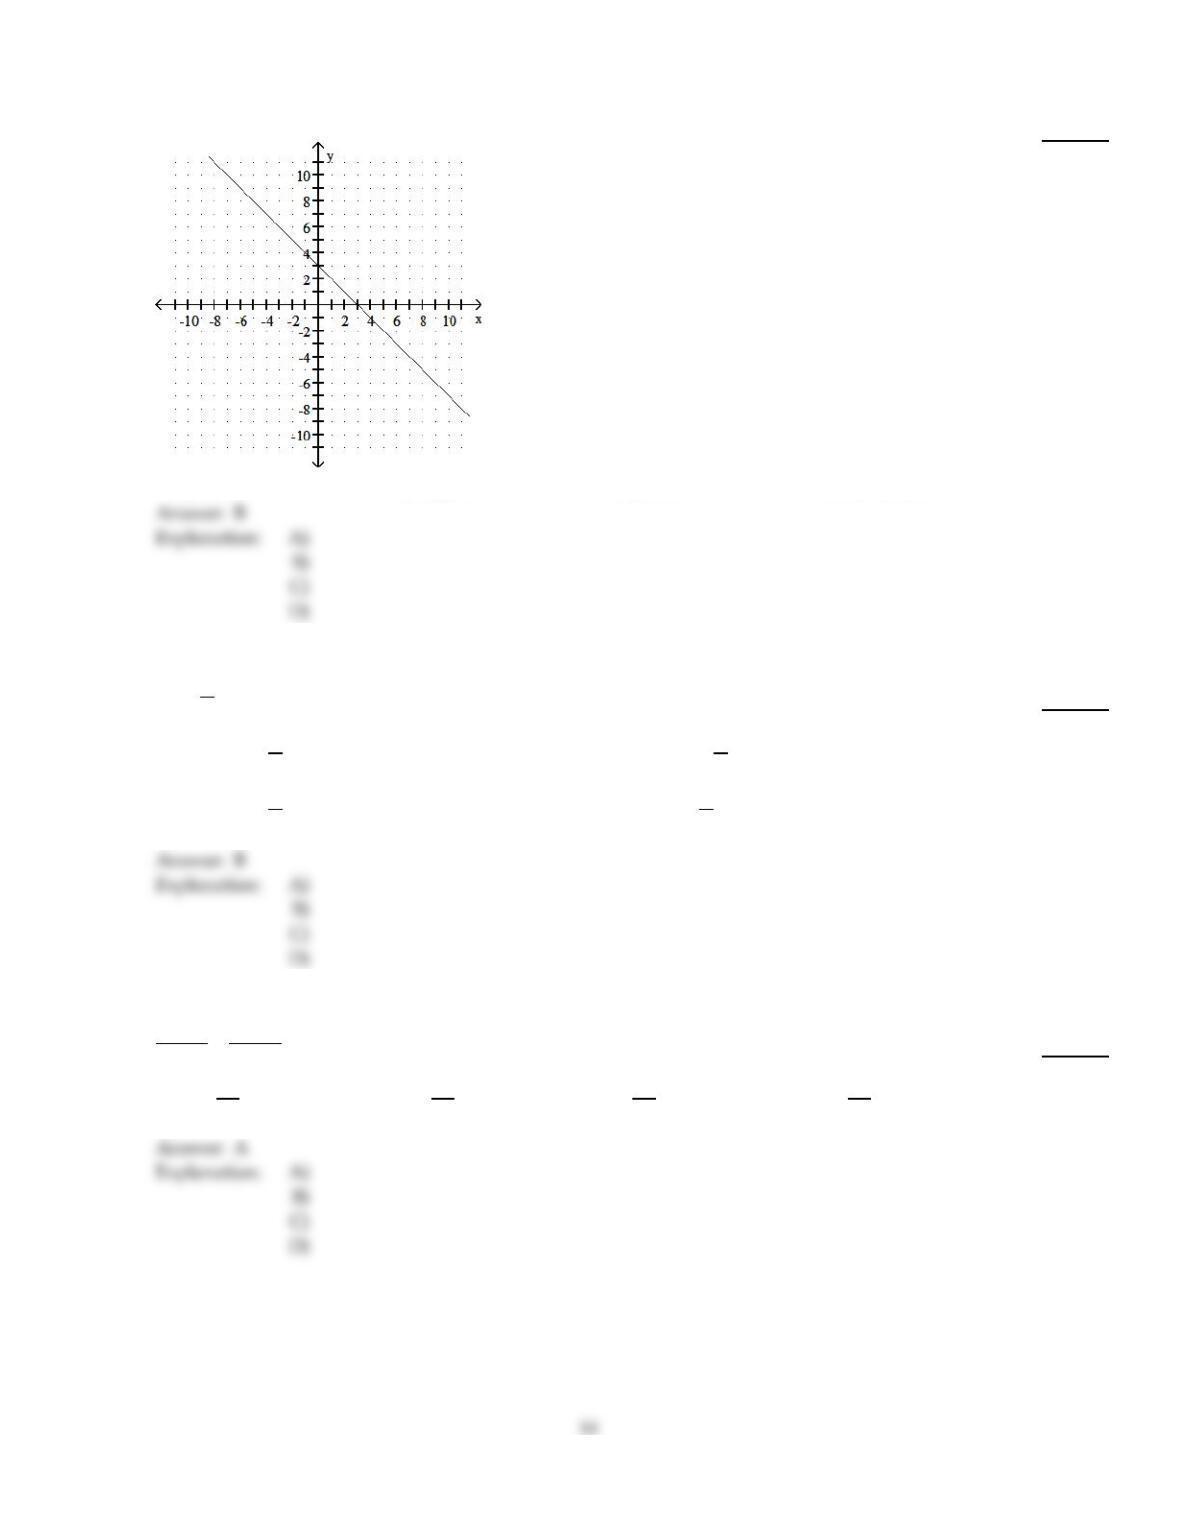
Graph the linear equation and determine its slope, if it exists.
9
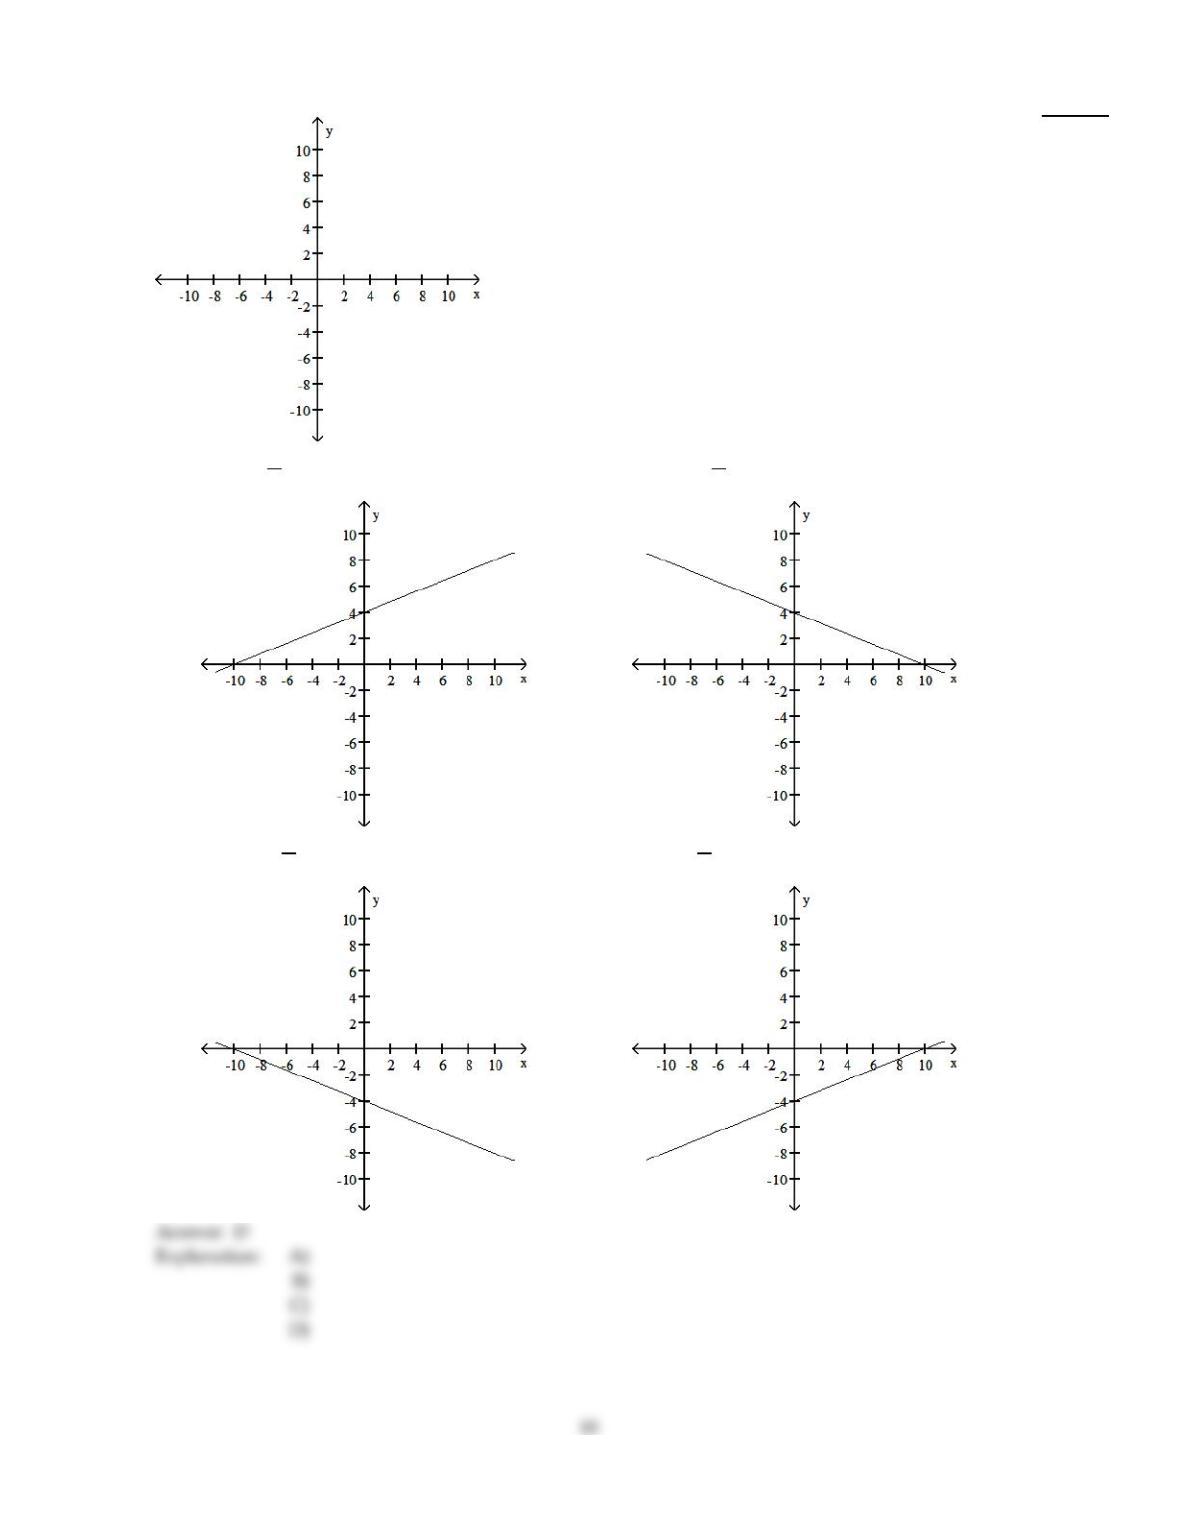
28)
2x – 5y = 20
28)
A)
slope =2
5
B)
slope = – 2
5
C)
slope = – 2
5
D)
slope =2
5
Find the slope and y intercept of the graph of the equation.
29)
y =5
2x –9
2
29)
A)
Slope = – 9
2; y intercept =5
2
B)
Slope =5
2; y intercept =9
2
C)
Slope =5
2; y intercept = – 9
2
D)
Slope =9
2; y intercept =5
2
Solve the problem.
30)
A piece of equipment was purchased by a company for $10,000 and is assumed to have a salvage
value of $3,000 in 10 years. If its value is depreciated linearly from $10,000 to $3,000, find a linear
equation in the form V = mt + b, t time in years, that will give the salvage value at any time t,
0 t 10.
30)
A)
T = – 700V + 10,000
B)
V = – 700t + 10,000
C)
V = – 700t – 10,000
D)
V = 700t + 10,000
Solve the problem. Express your answer as an integer or simplified fraction.
31)
1
9(x + 18) – 1
6(x – 6) = x – 8
31)
A)
126
19
B)
162
19
C)
90
19
D)
198
19
Solve the problem.
32)
Find the Celsius temperature (to the nearest degree) when Fahrenheit temperature is 77° by solving
the equation 77 =9
5C + 32, where F is the Fahrenheit temperature (in degrees) and C is the Celsius
temperature.
32)
A)
145°C
B)
39°C
C)
25°C
D)
171°C
Find the slope and y intercept of the graph of the equation.
33)
y = – x
2+ 1
33)
A)
Slope =1; y intercept = – 1
2
B)
Slope = – 1
2; y intercept =-1
C)
Slope = – 1
2; y intercept =1
D)
Slope =1; y intercept =1
2
Solve the formula for the specified variable.
34)
Solve: D =4
5(mx – mb) for m
34)
A)
m =5D
4(x – b)
B)
m =4D
5(x – b)
C)
m =4D
5(x + b)
D)
m =5D
4(x + b)
Write an equation of the line with the indicated slope and y intercept.
35)
Slope = – 4, y intercept =7
35)
A)
y =4x +7
B)
y =7x –4
C)
y = – 4x +7
D)
y = – 4x –7
Solve the problem. Express your answer as an integer or simplified fraction.
36)
x
6– 4 =x
3– 3
36)
A)
14
B)
– 14
C)
– 6
D)
– 2
Solve the inequality and graph. Express your answer in interval notation.
37)
-5(5x + 4) <-30x + 25
37)
A)
(9, )
B)
[9, )
C)
(–, 9]
D)
(–, 9)
Solve the problem. Express your answer as an integer or simplified fraction.
38)
Solve: x – 2
3–x – 3
6=3 – x
2– 3
38)
A)
3
B)
2
C)
– 3
D)
– 2
Determine whether the slope of the line is positive, negative, zero, or undefined.
39)
39)
A)
zero
B)
negative
C)
positive
D)
undefined
Find the slope and y intercept of the graph of the equation.
40)
y = – 2
3x +6
40)
A)
Slope =2
3; y intercept =4
B)
Slope = – 2
3; y intercept =6
C)
Slope =2
3; y intercept =6
D)
Slope =3
2; y intercept =4
Solve the problem. Express your answer as an integer or simplified fraction.
41)
5x – 7
5=7x + 3
2
41)
A)
–29
25
B)
–1
25
C)
1
45
D)
29
45