Exam
Name___________________________________
SHORT ANSWER. Write the word or phrase that best completes each statement or answers the question.
Provide an appropriate response.
1)
Explain how you divide a decimal number by a power of ten.
1)
2)
Why must decimal points be lined up in division of decimals?
2)
3)
What are the ways to round off a number?
3)
4)
Why don’t you have to line up decimal points in a vertical column when multiplying
decimals?
4)
5)
Explain the difference between terminating and repeating decimals.
5)
6)
Explain why you would use zeros to fill in for missing digits to the right of the decimal
point when adding or subtracting decimals.
6)
7)
Explain how you multiply a decimal number by a power of ten.
7)
MULTIPLE CHOICE. Choose the one alternative that best completes the statement or answers the question.
Divide, dropping zeros from the divisor.
8)
30 480
8)
A)
7
B)
6
C)
17
D)
16
Write the decimal using numbers.
9)
six and thirteen hundredths
9)
A)
6.013
B)
6.13
C)
613
D)
6.0013
Divide.
10)
36 642
10)
A)
17 R30
B)
17
C)
16 R27
D)
15 R7
Solve the problem.
11)
The following chart shows e–Train Company’s expenses by department for each of the first six
months of the year.
Department Jan Feb Mar Apr May Jun Totals
Office $48,607 $25,765 $45,745 $43,099 $37,377 $47,137
Sales $68,991 $68,864 $52,943 $57,940 $52,531 $76,374
Production $21,200 $20,051 $26,462 $27,736 $36,997 $44,574
Totals
11)
A)
Jan Feb Mar Apr May Jun Totals
$200,593
$301,269
$132,446
$138,798 $114,680 $125,150 $128,775 $126,905 $168,085 $634,308
B)
Jan Feb Mar Apr May Jun Totals
$248,730
$378,643
$178,020
$138,798 $114,680 $125,150 $128,775 $126,905 $168,085 $805,393
C)
Jan Feb Mar Apr May Jun Totals
$246,730
$376,643
$176,020
$138,798 $114,680 $125,150 $128,775 $126,905 $168,085 $799,393
D)
Jan Feb Mar Apr May Jun Totals
$247,730
$377,643
$177,020
$138,798 $114,680 $125,150 $128,775 $126,905 $168,085 $802,393
Divide.
12)
262
12)
A)
32
B)
22
C)
31
D)
21
Multiply.
13)
3030
×3700
13)
A)
11,210,000
B)
11,211,000
C)
11,221,000
D)
11,212,000
Perform the indicated operation.
14)
6.6 469 (Round to the nearest thousandths when necessary.)
14)
A)
71.061
B)
7.156
C)
71.561
D)
7.106
Perform the multiplication.
15)
0.804
×0.02
15)
A)
0.01608
B)
1.608
C)
0.0001608
D)
0.001608
Solve the problem.
16)
A bakery sold 24 pies for $3.52 each. What was the total amount of the sale?
16)
A)
$84.49
B)
$84.48
C)
$85.58
D)
$84.58
Express the number in words.
17)
84,305
17)
A)
eighty-four thousand, three hundred five
B)
eighty-four thousand, three hundred fifty
C)
eighty thousand, four hundred thirty five
D)
eighty thousand, three hundred five
Solve the problem.
18)
Jose Ramirez, a salesperson for a chemical company, travelled 1542 miles on Monday, 345 miles on
Tuesday, and 2024 miles on Thursday. Find the total number of miles he travelled during these
three days.
18)
A)
3811 mi
B)
3221 mi
C)
3566 mi
D)
3911 mi
Perform the indicated operation.
19)
1.61 ÷0.048 (Round to the nearest hundredths when necessary.)
19)
A)
34.04
B)
3.4
C)
33.54
D)
3.35
Estimate by using front–end rounding.
20)
77
×24
20)
A)
1600
B)
1850
C)
1848
D)
100
Round the figure to the nearest dollar.
21)
$339.02
21)
A)
$340
B)
$338
C)
$339
D)
$339.10
Perform the subtraction.
22)
6666
– 412
22)
A)
6230
B)
254
C)
6250
D)
6254
Solve the problem.
23)
David’s company has to ship 2750 boxes of sprinklers. If a truck can hold 550 boxes, how many
truckloads does he need to ship all the boxes?
23)
A)
5 truckloads
B)
4 truckloads
C)
3 truckloads
D)
6 truckloads
Round the figure to the nearest dollar.
24)
$7,432,858.41
24)
A)
$7,433,000
B)
$7,432,859
C)
$7,432,858.4
D)
$7,432,858
Solve the problem.
25)
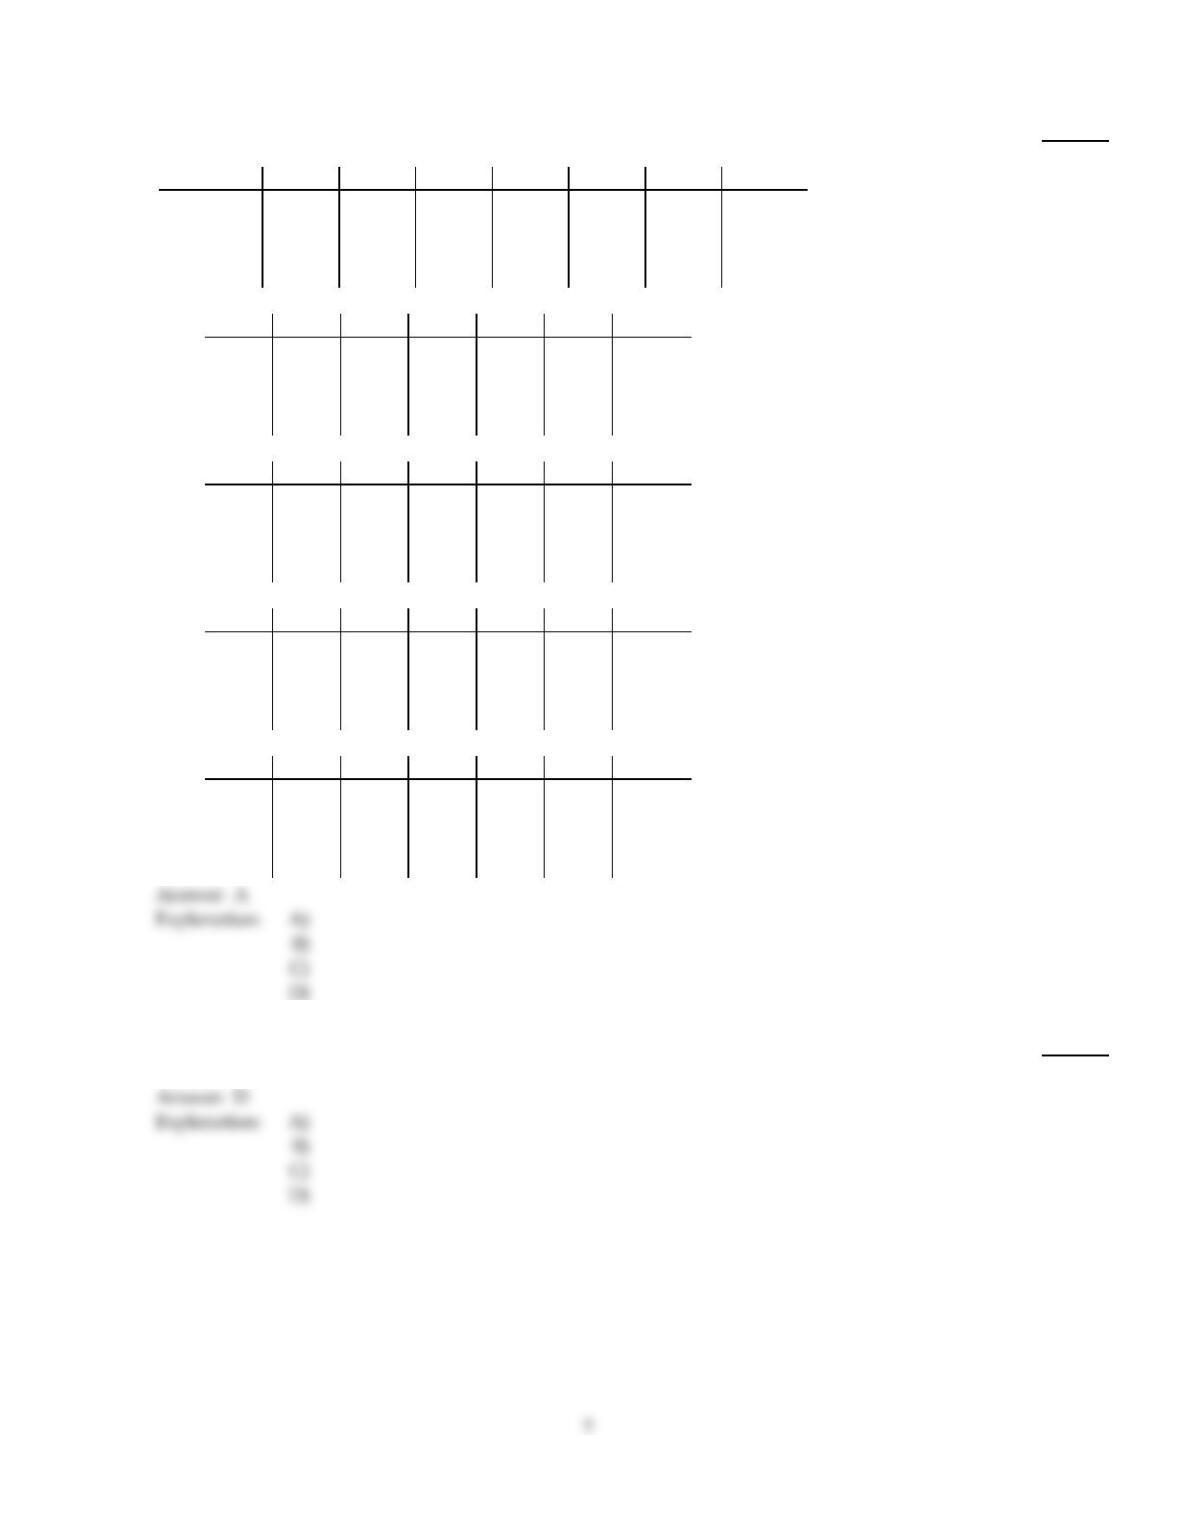
The following chart shows Maid–for–You’s monthly sales by salesperson for each of the first six
months of the year.
Salesperson Jan Feb Mar Apr May Jun Totals
Kathy $24,246 $20,727 $20,828 $23,482 $15,258 $17,346
Brenda $26,631 $28,873 $29,140 $27,473 $29,173 $26,604
Gesela $31,494 $36,752 $34,016 $37,081 $30,079 $39,906
Totals
25)
A)
Jan Feb Mar Apr May Jun Totals
$121,887
$167,894
$209,328
$82,371 $86,352 $83,984 $88,036 $74,510 $83,856 $499,109
B)
Jan Feb Mar Apr May Jun Totals
$122,887
$168,894
$210,328
$82,371 $86,352 $83,984 $88,036 $74,510 $83,856 $502,109
C)
Jan Feb Mar Apr May Jun Totals
$120,887
$166,894
$208,328
$82,371 $86,352 $83,984 $88,036 $74,510 $83,856 $496,109
D)
Jan Feb Mar Apr May Jun Totals
$104,541
$141,290
$169,422
$82,371 $86,352 $83,984 $88,036 $74,510 $83,856 $415,253
26)
If the temperature in the city has risen 3° each day, how much has it risen in 5 days?
26)
A)
18°
B)
8°
C)
25°
D)
15°
D
A
First use front–end rounding to write an estimate of the answer, and then subtract the decimals to obtain an exact answer.
27)
Estimate Problem
–
16.51
–3.17
27)
A)
Estimate: 14, exact: 13.44
B)
Estimate: 17, exact: 13.34
C)
Estimate: 17, exact: 13.46
D)
Estimate: 17, exact: 13.44
Perform the subtraction.
28)
6865
– 1252
28)
A)
6613
B)
5509
C)
5609
D)
5613
Write the decimal using numbers.
29)
seventeen and nine thousandths
29)
A)
17.9
B)
17.09
C)
17.009
D)
17.0009
Perform the multiplication.
30)
0.005
×0.5
30)
A)
0.00025
B)
0.025
C)
0.000025
D)
0.0025
Solve the problem.
31)
If the list price is $133.24 and the discount price is $97.28, how much is saved by buying at
discount?
31)
A)
$36.96
B)
$45.96
C)
$35.96
D)
$46.96
32)
If you save $48.37 off the list price buying from a discount catalog, and the list price is $139.18,
what is the discount price?
32)
A)
$171.00
B)
$90.81
C)
$187.55
D)
$89.81
Perform the indicated operation.
33)
0.576 ÷72
33)
A)
0.009
B)
0.007
C)
0.0079
D)
0.008
Solve the problem.
34)
How much money is saved at a $68.75 discount price rather than a $96.14 list price?
34)
A)
$28.39
B)
$28.49
C)
$27.39
D)
$27.49
Round the amount to the nearest cent.
35)
$5.9494
35)
A)
$5.949
B)
$5.94
C)
$5.95
D)
$6.05
Solve the problem.
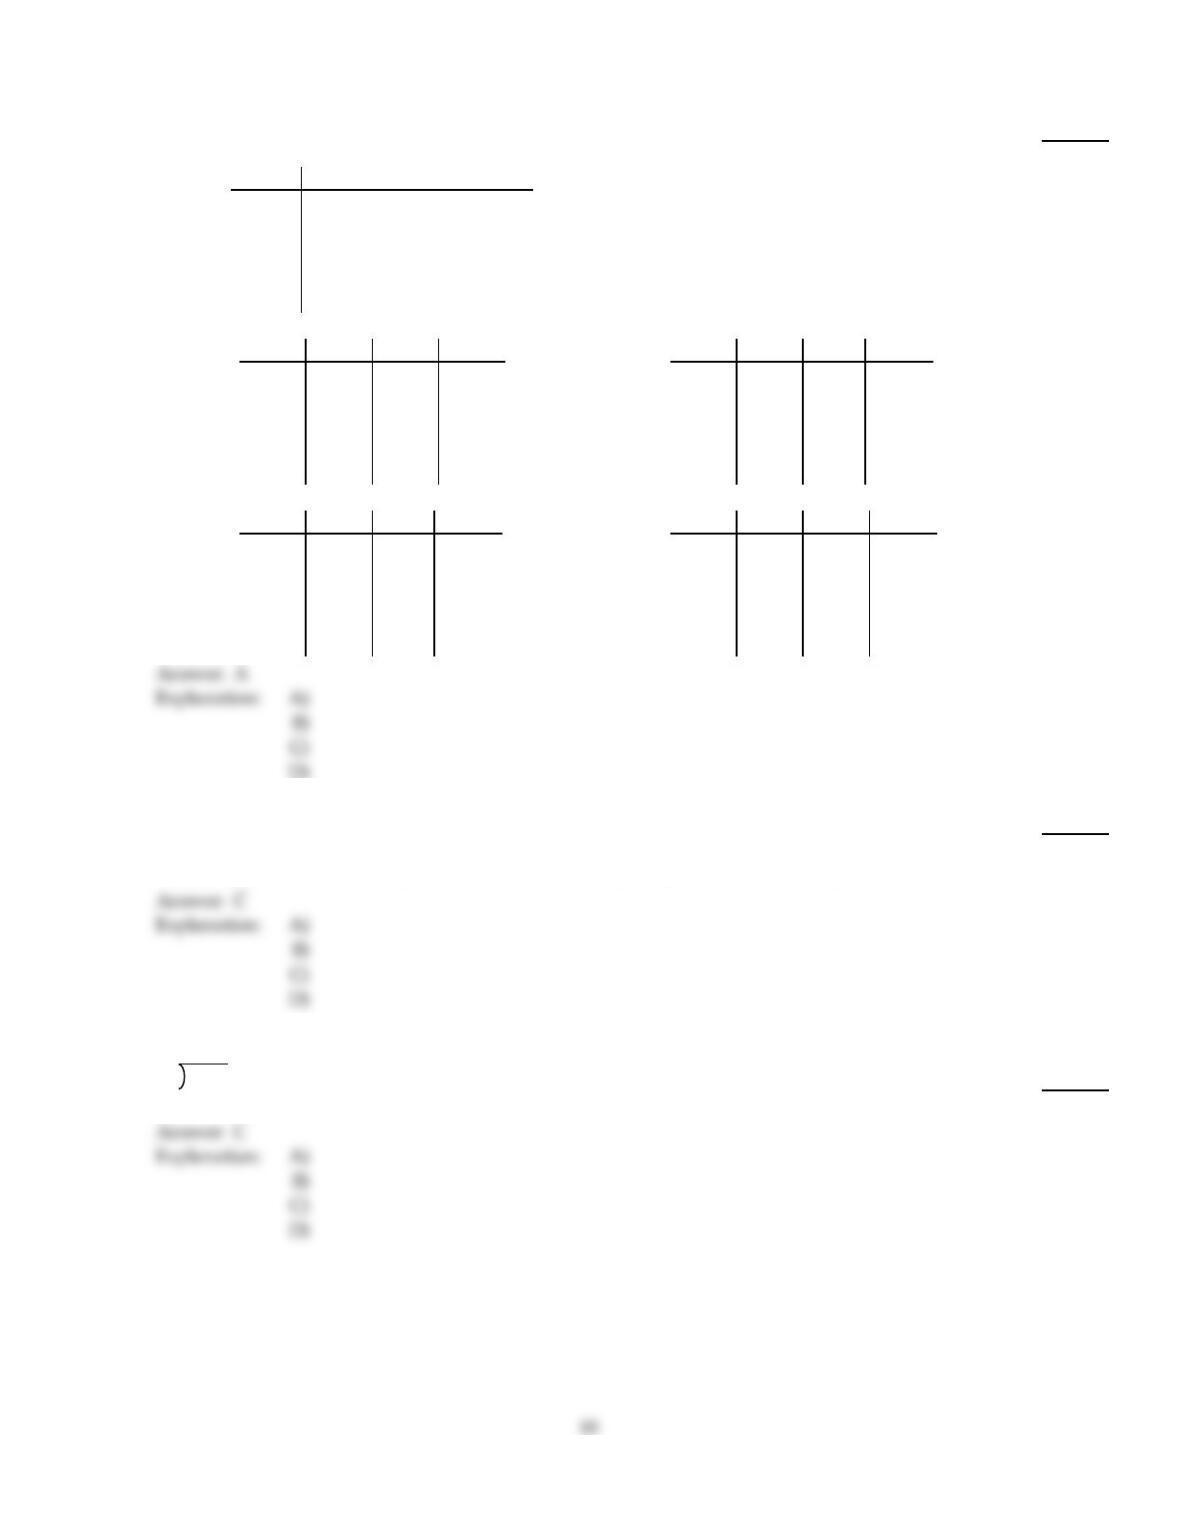
36)
The following chart shows a book publisher’s monthly sales by book category for the first quarter of
the year. Complete the totals by adding horizontally and vertically.
Jan Feb Mar Totals
Math 7529 7013 5007
Science 5103 6639 7859
English 7935 7910 4366
History 7880 4696 5822
Totals
36)
A)
Jan Feb Mar Totals
19,549
19,601
20,211
18,398
28,447 26,258 23,054 77,759
B)
Jan Feb Mar Totals
19,549
19,501
20,211
18,498
28,547 26,158 23,054 77,759
C)
Jan Feb Mar Totals
19,549
19,501
20,211
18,498
28,447 26,158 23,154 77,759
D)
Jan Feb Mar Totals
19,549
19,501
20,211
18,398
28,447 26,158 23,054 77,659
37)
The city bridge has 3 lanes, all carrying equal numbers of cars. If 156 cars drive across the bridge,
how many cars cross in each lane?
37)
A)
55 cars
B)
53 cars
C)
52 cars
D)
159 cars
Divide, dropping zeros from the divisor.
38)
70 5960
38)
A)
86
B)
85
C)
85 R10
D)
85 R60
Perform the indicated operation.
39)
5.95 ÷0.07
39)
A)
8.5
B)
74
C)
86
D)
85
Round the figure to the nearest dollar.
40)
$71,713.94
40)
A)
$71,713.9
B)
$72,000
C)
$71,715
D)
$71,714
Estimate by using front–end rounding.
41)
960
513
493
656
+ 424
41)
A)
3046
B)
3100
C)
3000
D)
3050
Solve the problem.
42)
A television offer advertised a set of knives for $20 down and $7 a month for 12 months. What is
the total cost of the knives?
42)
A)
$94
B)
$104
C)
$84
D)
$114
Divide.
43)
7128
43)
A)
18 R2
B)
18
C)
20
D)
18 R6
Solve the problem.
44)
Gina is buying a used car that has an advertised price of $2500. She is buying the car on credit and
must make a down payment of $1200 and 18 monthly payments of $106. What is the total cost of
the car?
44)
A)
$3214
B)
$3108
C)
$2606
D)
$3002
45)
Alicia sold $3918 of paintings at the art fair. If she sold 6 paintings total, and they all sold for the
same amount, what was the price of one painting?
45)
A)
$689
B)
$636
C)
$653
D)
$553
Perform the subtraction.
46)
889
– 14
46)
A)
903
B)
875
C)
775
D)
867
Express the number in words.
47)
87,000,923
47)
A)
eighty-seven million, nine thousand, twenty-three
B)
eighty-seven thousand, nine hundred twenty-three
C)
eight million, seven hundred thousand, nine hundred twenty-three
D)
eighty-seven million, nine hundred twenty-three
Round the number as requested.
48)
972 to the nearest thousand
48)
A)
1000
B)
100
C)
100,000
D)
10,000
Perform the multiplication.
49)
0.027
× 7.5
49)
A)
0
B)
7
C)
0.2025
D)
7.527
Round the number to the nearest thousandth, nearest hundredth, and nearest tenth. Remember to round from the original
number.
50)
955.847
50)
A)
955.85, 955.8, 955
B)
955.847, 955.84, 956
C)
955.847, 955.85, 955.8
D)
955.847, 955.85, 955
Solve the problem.
51)
During one year 13 new employees started working at McIntosh Manufacturing Company. At the
beginning of the year there are 324 employees in the factory and 41 employees in the office. What is
the total number of employees at the end of the year?
51)
A)
352 employees
B)
365 employees
C)
54 employees
D)
378 employees
Perform the subtraction.
52)
75,887
–1313
52)
A)
75,574
B)
74,568
C)
74,574
D)
74,548
Write the decimal in words.
53)
2.5
53)
A)
two and five thousandths
B)
two and five tenths
C)
two and five hundredths
D)
two and five millionths
Solve the problem.
54)
Sales at Andrea’s Formal Wear Shop were $915 this week. This is $175 less than the sales last week.
What were last week’s sales?
54)
A)
$740
B)
$1101
C)
$1079
D)
$1090
D
55)
Carla’s gross pay is $138 a week. $13 was withheld for federal income tax, $10 for FICA tax, and $5
for other deductions. How much of her pay is left?
55)
A)
$28
B)
$110
C)
$120
D)
$166
B
Multiply, omitting zeros in the calculation and then replacing them at the right of the product to obtain the final answer.
56)
1400
×500
56)
A)
699,000
B)
699,501
C)
700,000
D)
701,000
C
Divide.
57)
7417
57)
A)
63
B)
59 R6
C)
59
D)
59 R4
D
B
Perform the indicated operation.
58)
17 124.413 (Round to the nearest hundredths when necessary.)
58)
A)
7.82
B)
0.78
C)
7.32
D)
0.73
Solve the problem.
59)
Gina is buying a used car that has an advertised price of $4500. She is buying the car on credit and
must make a down payment of $500 and 24 monthly payments of $113. What is the total cost of the
car?
59)
A)
$2712
B)
$3202
C)
$2812
D)
$3212
Perform the multiplication.
60)
4.3
×708
60)
A)
3044.51
B)
3044.5
C)
3045.5
D)
3044.4
Write the unit cost, rounded to the nearest cent.
61)
If 218 candy bars cost $309.86, then one candy bar costs $1.4214.
61)
A)
$1.32
B)
$1.52
C)
$309.86
D)
$1.42
Round the number to the nearest thousandth, nearest hundredth, and nearest tenth. Remember to round from the original
number.
62)
0.9077
62)
A)
0.907, 0.90, 0.9
B)
0.9077, 0.907, 0.90
C)
0.908, 0.90, 1
D)
0.908, 0.91, 0.9
First use front–end rounding to write an estimate of the answer, and then add the decimals to obtain an exact answer.
63)
Estimate Problem
+
8.2
2.5228
+ 5.5295
63)
A)
Estimate: 17, exact: 16.2523
B)
Estimate: 15, exact: 15.2523
C)
Estimate: 15, exact: 15.2423
D)
Estimate: 16, exact: 16.2423
Solve the problem.
64)
A salesperson earned $325 a week plus a bonus of $21 for each service contract sold. What is the
weekly pay if 6 service contracts were sold?
64)
A)
$451
B)
$325
C)
$126
D)
$551
65)
A grocer sold 23 bags of potatoes for $1.13 each. What was the total amount of the sale?
65)
A)
$26
B)
$26.09
C)
$25.99
D)
$27.09
66)
If the list price is $25.57 and if $13.38 is saved by buying from a discount catalog, what is the
discount price for the item?
66)
A)
$37.95
B)
$12.19
C)
$38.95
D)
$12.29
Round the figure to the nearest dollar.
67)
$593.36
67)
A)
$593
B)
$593.40
C)
$593.36
D)
$594
Solve the problem.
68)
A manager of a local restaurant had a bank balance of $3958.68 on October 1. During October, the
manager deposited $56,534.29 received from sales, $2141.98 received as credits from suppliers, and
$78.76 as a county tax refund. He paid out $24,026.08 to suppliers, $4341.38 for rent and utilities,
and $10,345.81 for salaries. How much did the manager deposit in October? How much did the
manager pay out?
68)
A)
Deposits: $58,755.03
Paid out: $34,754.59
B)
Deposits: $62,713.71
Paid out: $34,754.59
C)
Deposits: $62,713.71
Paid out: $38,713.27
D)
Deposits: $58,755.03
Paid out: $38,713.27
D)
Perform the addition.
69)
13.52 + 10.224
69)
A)
-3.296
B)
23.744
C)
3.296
D)
23.844
D)
17
Solve the problem.
70)
The following chart shows HealthTech’s monthly sales by region for each of the first six months of
the year.
Region Jan Feb Mar Apr May Jun Totals
East $89,608 $60,927 $75,873 $64,066 $68,331 $81,440
Midwest $50,638 $39,776 $56,977 $57,120 $49,908 $48,487
West $62,368 $56,067 $68,417 $52,135 $56,934 $56,816
Totals
70)
A)
Jan Feb Mar Apr May Jun Totals
$440,245
$302,906
$352,737
$202,614 $156,770 $201,267 $173,321 $175,173 $186,743 $1,095,888
B)
Jan Feb Mar Apr May Jun Totals
$358,805
$254,419
$295,921
$202,614 $156,770 $201,267 $173,321 $175,173 $186,743 $909,145
C)
Jan Feb Mar Apr May Jun Totals
$441,245
$303,906
$353,737
$202,614 $156,770 $201,267 $173,321 $175,173 $186,743 $1,098,888
D)
Jan Feb Mar Apr May Jun Totals
$439,245
$301,906
$351,737
$202,614 $156,770 $201,267 $173,321 $175,173 $186,743 $1,092,888
Write the decimal using numbers.
71)
eleven and one tenths
71)
A)
11.001
B)
11.1
C)
11.01
D)
0.111
Express the number in words.
72)
7240
72)
A)
seven thousand, two hundred four
B)
seven thousand, two hundred forty
C)
seventy two thousand, forty
D)
seventy two hundred four
Round the number as requested.
73)
5438 to the nearest thousand
73)
A)
5000
B)
5100
C)
4900
D)
6000
Round the figure to the nearest dollar.
74)
$9555.93
74)
A)
$9555
B)
$9556
C)
$9555.93
D)
$9555.9
Solve the problem.
75)
BT&T charges $0.34 for the first minute and $0.22 for each additional minute for a long–distance
call. How much will a 10 minute long–distance call cost?
75)
A)
$2.32
B)
$2.20
C)
$2.54
D)
$3.40
76)
A stockbroker bought 25 shares of stock for $45.31 each. What was the total amount of the
purchase?
76)
A)
$1132.86
B)
$1132.65
C)
$1132.75
D)
$1132.85
First use front–end rounding to write an estimate of the answer, and then multiply fully to obtain an exact answer.
77)
Estimate Problem
×
54.84
×32.21
77)
A)
Estimate: 150, exact: 176.63964
B)
Estimate: 1500, exact: 1766.3964
C)
Estimate: 150, exact: 17,663.964
D)
Estimate: 1510, exact: 1765.3964
Estimate by using front–end rounding.
78)
87
– 53
78)
A)
140
B)
30
C)
40
D)
34
C
Write the decimal in words.
79)
6.709
79)
A)
six and seven hundred nine thousandths
B)
six and seventy tenths and nine thousandths
C)
six and seventy thousand nine hundredths
D)
six and seventy-nine thousandths
A
Write the decimal using numbers.
80)
seven hundred eleven ten–thousandths
80)
A)
0.0711
B)
700.011
C)
700.0011
D)
0.711
A
B