Exam
Name___________________________________
SHORT ANSWER. Write the word or phrase that best completes each statement or answers the question.
Provide an appropriate response.
1)
If a company decides to make a new product, there are fixed costs and variable costs
associated with this new product. Explain the differences of the two types of costs and
why they occur. Use an example to illustrate your point.
1)
2)
Can an equation of a vertical line be written in slope–intercept form? Explain.
2)
3)
Show that the points P1(2,4), P2(5,2), and P3(7,5) are the vertices of a right triangle.
3)
4)
Why is the slope of a horizontal line equal to zero? Give an example.
4)
5)
The total number of reported cases of AIDS in the United States has risen from 372 in 1981
to 100,000 in 1989 and 200,000 in 1992. Does a linear equation fit this data? Explain.
5)
6)
John has been a teacher at West Side High School for the past 12 years. His salary during
that time can be modeled by the linear equation y = 800x + 33,000 where x is the number of
years since he began teaching at West Side and y is his salary in dollars. Explain what the
slope, 800, represents in this context.
6)
7)
Why is the slope of a vertical line undefined?
7)
8)
Explain what is wrong with the statement “The line has no slope.”
8)
9)
Give a definition or an example of the word or phrase: Zero slope
9)
MULTIPLE CHOICE. Choose the one alternative that best completes the statement or answers the question.
Find the slope of the line passing through the given pair of points.
10)
(7, –7) and (7, –2)
10)
A)
–9
14
B)
–5
14
C)
Not defined
D)
0
C
Solve the problem.
11)
In a lab experiment 14 grams of acid were produced in 16 minutes and 19 grams in 23 minutes. Let
y be the grams produced in x minutes. Write a linear equation for grams produced.
11)
A)
y =7
5x –18
7
B)
y =5
7x –18
7
C)
y =5
7x +18
7
D)
y = – 5
7x –18
7
C
Find an equation in slope–intercept form (where possible) for the line.
12)
Through (2, –4) and (2, –9)
12)
A)
–9
4x – 4y = 0
B)
–4
9x – 9y = 0
C)
y = – 4
D)
x =2
13)
Through (–2, –8), perpendicular to –8x – 3y =40
13)
A)
y =3
8x
B)
y = – 3
8x +29
4
C)
y =8
3x– 58
D)
y =3
8x –29
4
14)
Through (–4, 4), m = – 3
14)
A)
y =3x + 16
B)
y = – 3x – 8
C)
y = – 3x + 16
D)
y =3x – 8
Solve the problem.
15)
After two years on the job, an engineer’s salary was $45,000. After seven years on the job, her salary
was $57,500. Let y represent her salary after x years on the job. Assuming that the change in her
salary over time can be approximated by a straight line, give an equation for this line in the form y
= mx + b.
15)
A)
y =12,500x +45,000
B)
y =2500x +40,000
C)
y =2500x +45,000
D)
y =12,500x +20,000
Find an equation in slope–intercept form (where possible) for the line.
16)
Through (–8, 6), with undefined slope
16)
A)
x = – 8
B)
y =6
C)
3
4x – 8y = 0
D)
4
3x + 6y = 0
Solve the problem.
17)
A toilet manufacturer has decided to come out with a new and improved toilet. The fixed cost for
the production of this new toilet line is $16,600 and the variable costs are $69 per toilet. The
company expects to sell the toilets for $156. Formulate a function P(x) for the total profit from the
production and sale of x toilets.
17)
A)
P(x) =87x + 16600
B)
P(x) =87x – 16600
C)
P(x) =156x – 16600
D)
P(x) =87x
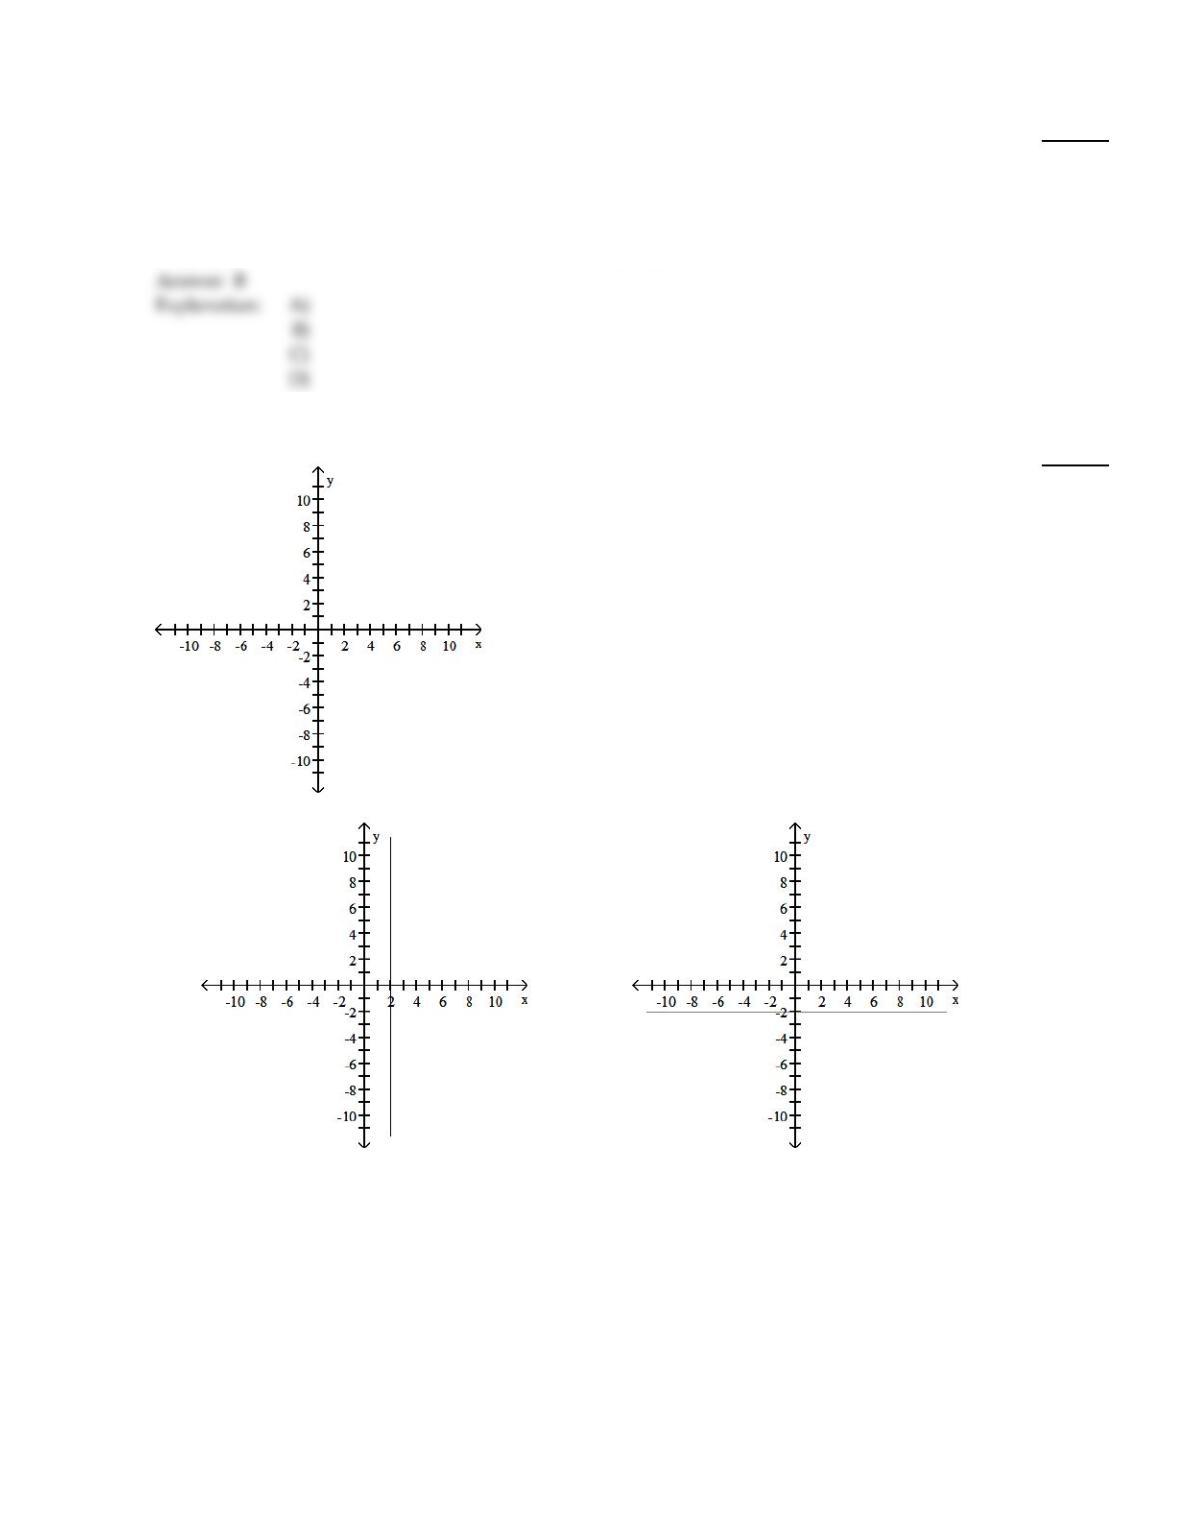
Graph the equation.
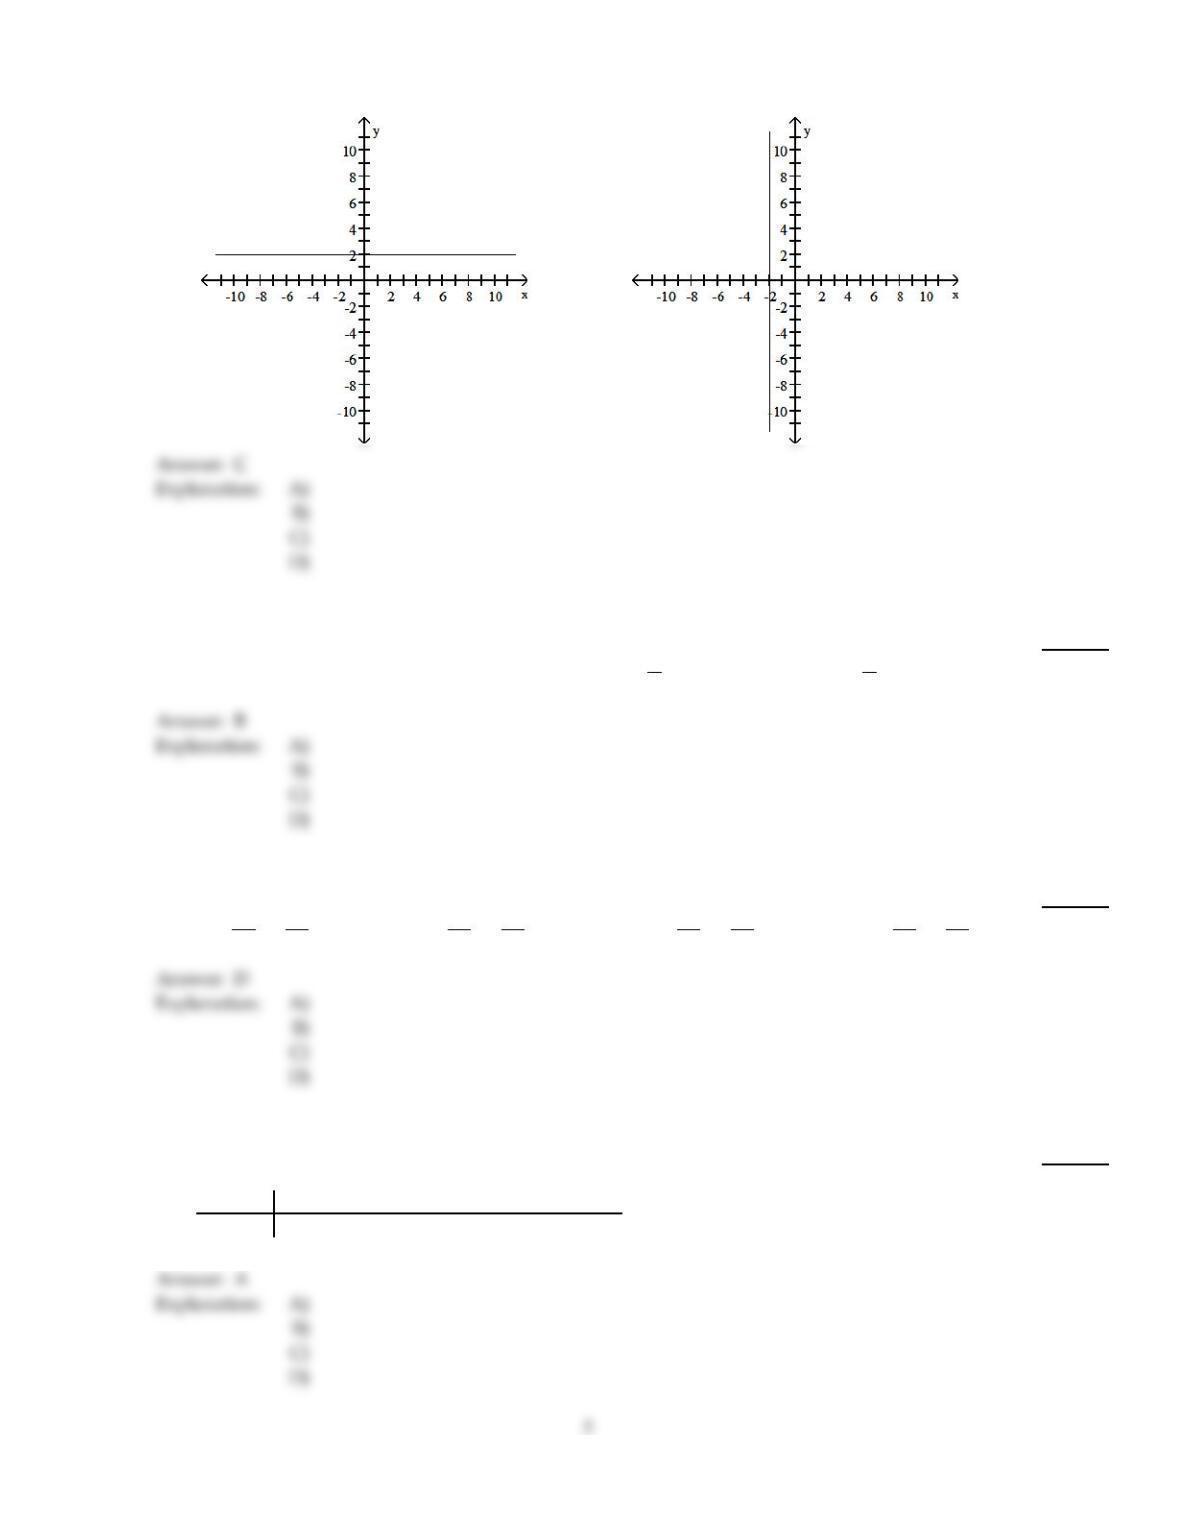
18)
y =2
18)
A)
B)
4
C)
D)
Find the slope of the line passing through the given pair of points.
19)
(4, –5) and (5, –10)
19)
A)
5
B)
– 5
C)
–5
3
D)
–1
5
B
Find an equation in slope–intercept form (where possible) for the line.
20)
Through (–5, 8) and (3, –9)
20)
A)
y =13
12 x –23
4
B)
y =17
8x –21
8
C)
y = – 13
12 x –23
4
D)
y = – 17
8x –21
8
D
Find the correlation coefficient.
21)
The following are costs of advertising (in thousands of dollars) and the number of products sold (in
thousands):
Cost 9 2 3 4 2 5 9 10
Number 85 52 55 68 67 86 83 73
21)
A)
0.7077
B)
0.2456
C)
–0.0707
D)
0.2353
A
C
Solve the problem.
22)
A study was conducted to compare the average time spent in the lab each week versus course
grade for computer students. The results are recorded in the table below. Use the equation of the
least squares line to predict the grade of a student who spends 7 hours in the lab.
Number of hours spent in lab (x) Grade (percent) (y)
10 96
11 51
16 62
9 58
7 89
15 81
16 46
10 51
22)
A)
81.6%
B)
71.6%
C)
75.6%
D)
77.0%
23)
Find an equation for the least squares line representing weight, in pounds, as a function of height,
in inches, of men. Then, predict the weight of a man who is 68 inches tall to the nearest tenth of a
pound. The following data are the (height, weight) pairs for 8 men: (66, 150), (68, 160), (69, 166),
(70, 175), (71, 181), (72, 191), (73, 198), (74, 206).
23)
A)
165.1 pounds
B)
160.0 pounds
C)
161.2 pounds
D)
151.4 pounds
24)
In the table below, x represents the number of years since 2000 and y represents annual sales (in
thousands of dollars) for a clothing company. Use the least squares regression equation to estimate
sales in the year 2006. Round to the nearest thousand dollars.
Year (x) 1 2 3 4 5
Sales (y) 30 40 60 90 130
24)
A)
$147,000
B)
$140,000
C)
$142,000
D)
$145,000
Write a cost function for the problem. Assume that the relationship is linear.
25)
A cab company charges a base rate of $1.50 plus 15 cents per minute. Let C(x) be the cost in dollars
of using the cab for x minutes.
25)
A)
C(x) =1.50x – 0.15
B)
C(x) =0.15x – 1.50
C)
C(x) =0.15x + 1.50
D)
C(x) =1.50x + 0.15
Solve the problem.
26)
In a certain city, the cost of a taxi ride is computed as follows: There is a fixed charge of $2.45 as
soon as you get in the taxi, to which a charge of $2.30 per mile is added. Find a linear equation that
can be used to determine the cost, C, of an x–mile taxi ride.
26)
A)
C =3.25x
B)
C =2.30x +2.45
C)
C =2.45x +2.30
D)
C =4.75x
27)
Given the supply and demand functions below, find the price when the demand is 145.
S(p) = 9p + 12
D(p) = 280 – 9p
27)
A)
$1317
B)
$47
C)
$292
D)
$15
Provide an appropriate response.
28)
Find k so that the line through (3, k) and (1, –2) is parallel to 4x – 2y =5. Find k so that the line is
perpendicular to 2x +3y =6.
28)
A)
6; – 5
B)
2; 1
C)
2; – 5
D)
6; 1
Solve the problem.
29)
Find the temperature at which the Celsius and Fahrenheit scales coincide.
29)
A)
39°
B)
0°
C)
–40°
D)
–25°
30)
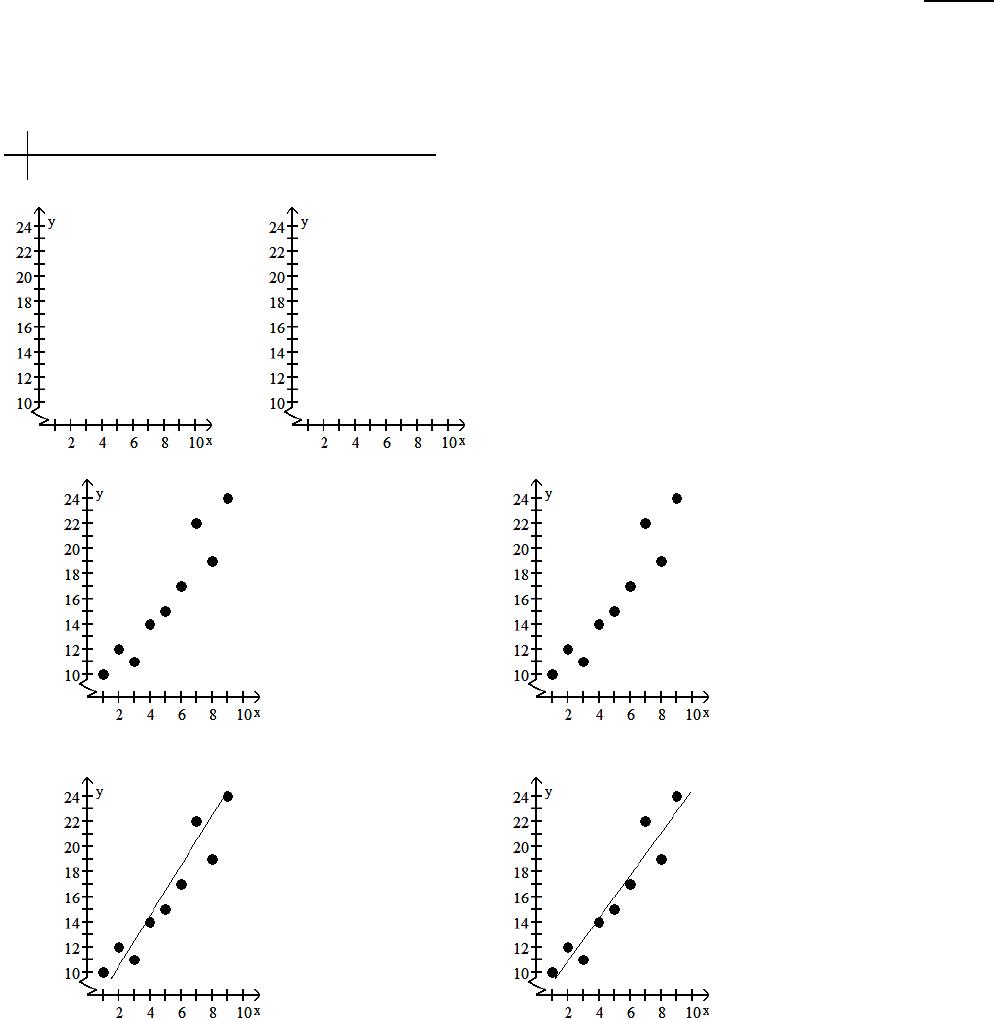
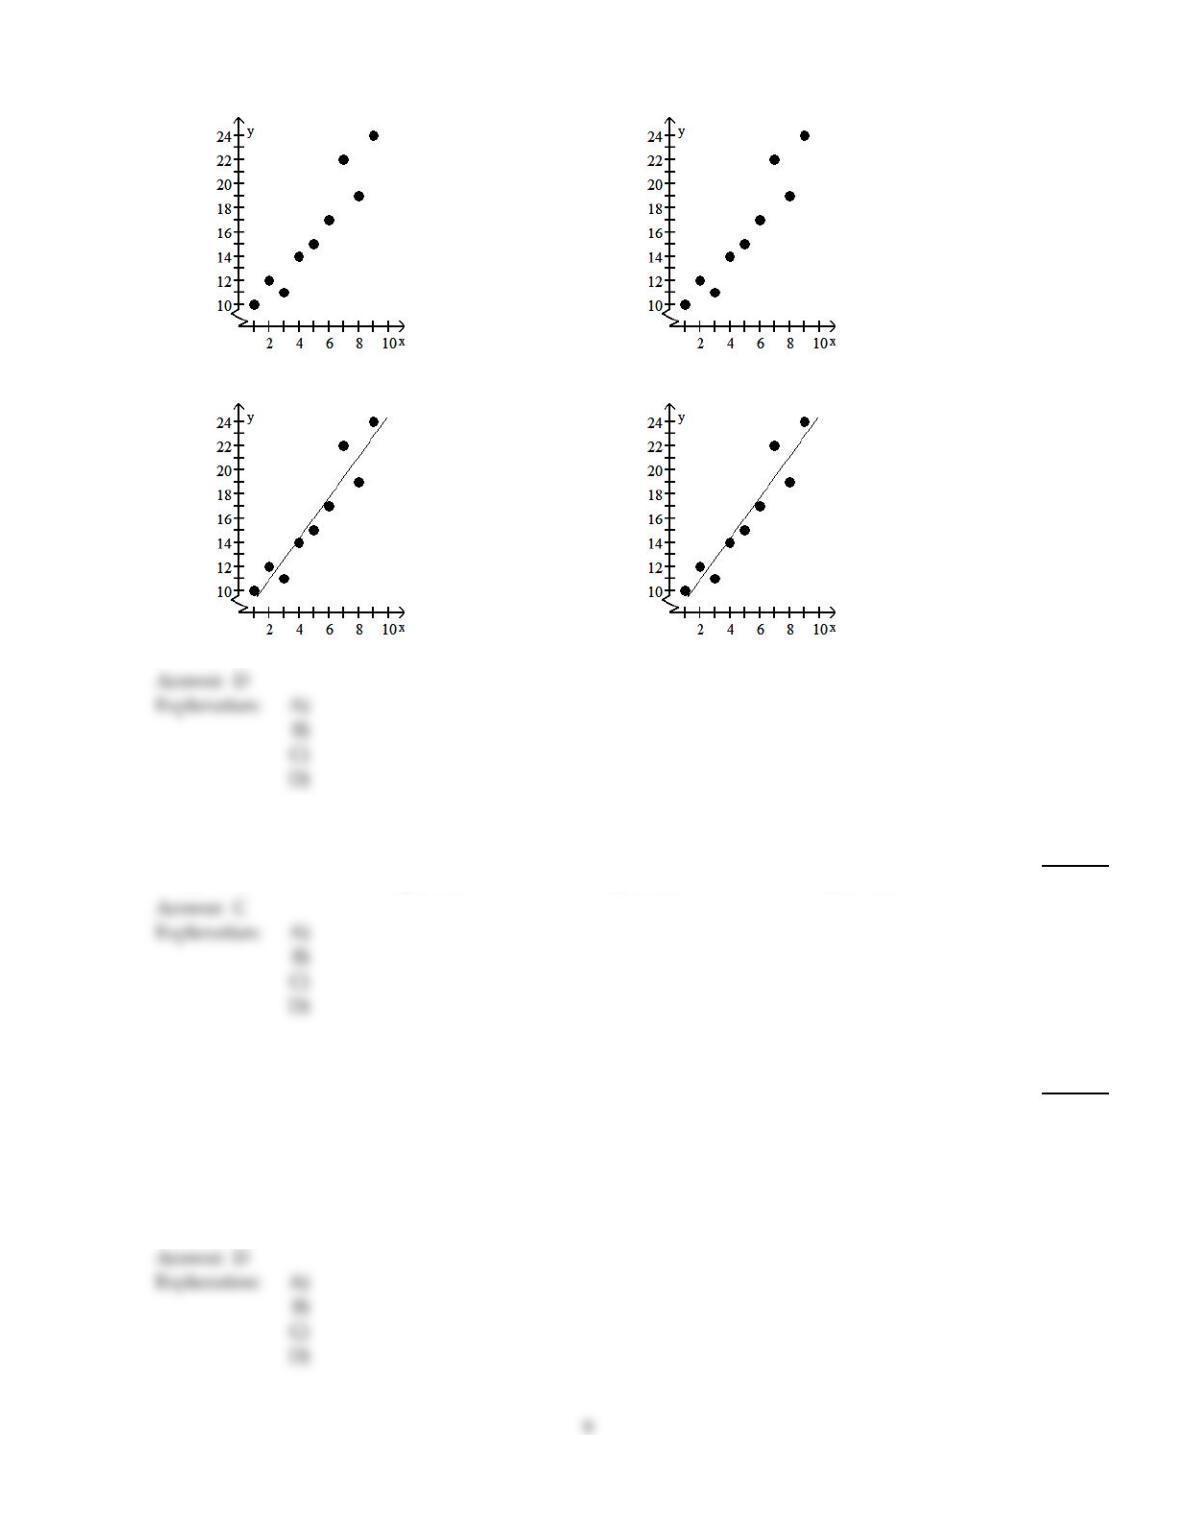
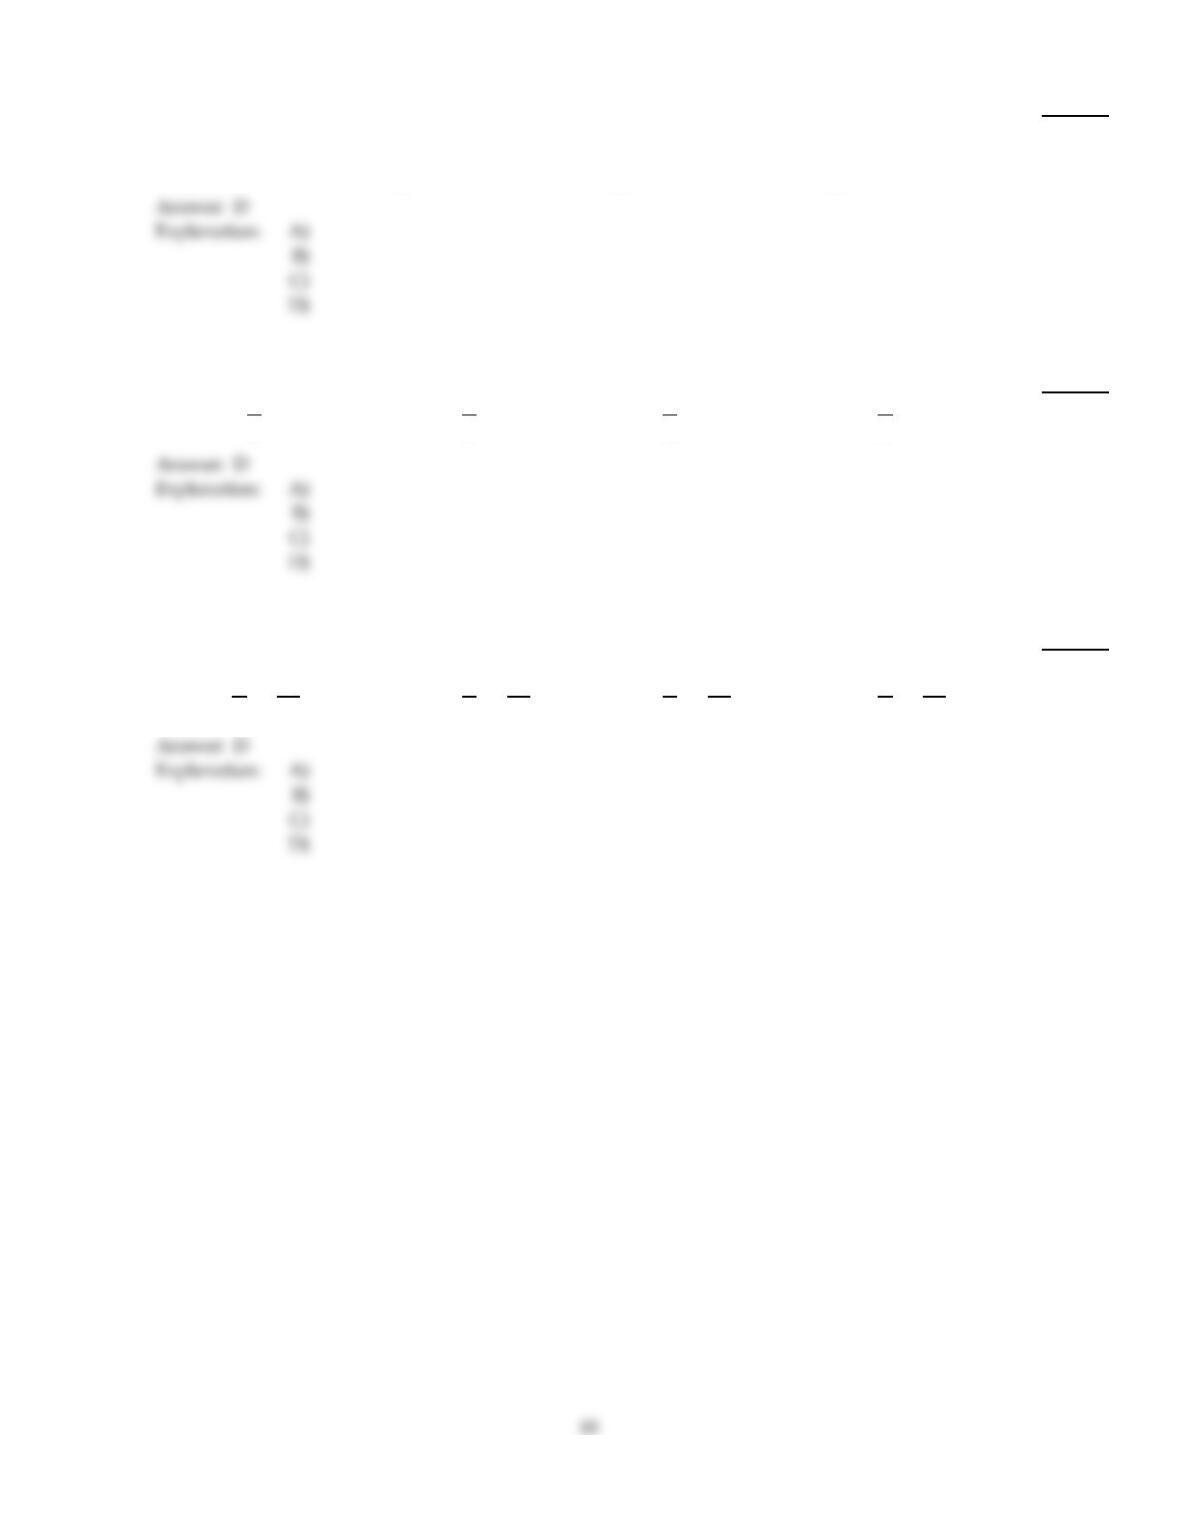
For the following table of data,
a. Draw a scatterplot.
b. Calculate the correlation coefficient.
c. Calculate the least squares line and graph it on the scatterplot.
d. Predict the y–value when x is 19.
x 1 2 3 4 5 6 7 8 9
y 10 12 11 14 15 17 22 19 24
30)
A)
a.
b. 0.903
c. Y = 2x + 6.5
d. 44.5
B)
a.
b. 0.950
c. Y = 1.7x
d. 32.3
8
C)
a.
b. 0.950
c. Y = 1.7x + 8.5
d. 40.8
D)
a.
b. 0.950
c. Y = 1.7x + 7.5
d. 39.8
Evaluate the function as indicated.
31)
Find f(–r) when f(x) =5–2x.
31)
A)
r –2x
B)
5+ rx
C)
5+2r
D)
5–2r
Solve the problem.
32)
Suppose that the population of a certain town, in thousands, was 105 in 1990 and 141 in 2002.
Assume that the population growth can be approximated by a straight line. Find the equation of a
line which will estimate the population of the town, in thousands, in any given year since 1990.
32)
A)
y = 2.5x + 105 where x is the number of years since 1990
B)
y = 4.25x + 90 where x is the number of years since 1990
C)
y = – 3x + 177 where x is the number of years since 1990
D)
y = 3x + 105 where x is the number of years since 1990
33)
Given the supply and demand functions below, find the demand when p = $12.
S(p) = 5p
D(p) = 120 – 4p
33)
A)
132
B)
48
C)
60
D)
72
Find an equation in slope–intercept form (where possible) for the line.
34)
Through (5, 2) and (0, –2)
34)
A)
y = – 3
2x – 2
B)
y = – 4
5x – 2
C)
y =3
2x – 2
D)
y =4
5x – 2
Solve the problem.
35)
A biologist recorded 12 snakes on 41 acres in one area and 18 snakes on 45 acres in another area.
Let y be the number of snakes in x acres. Write a linear equation for the number of snakes.
35)
A)
y =3
2x +99
2
B)
y = – 3
2x +99
2
C)
y =2
3x +99
2
D)
y =3
2x –99
2
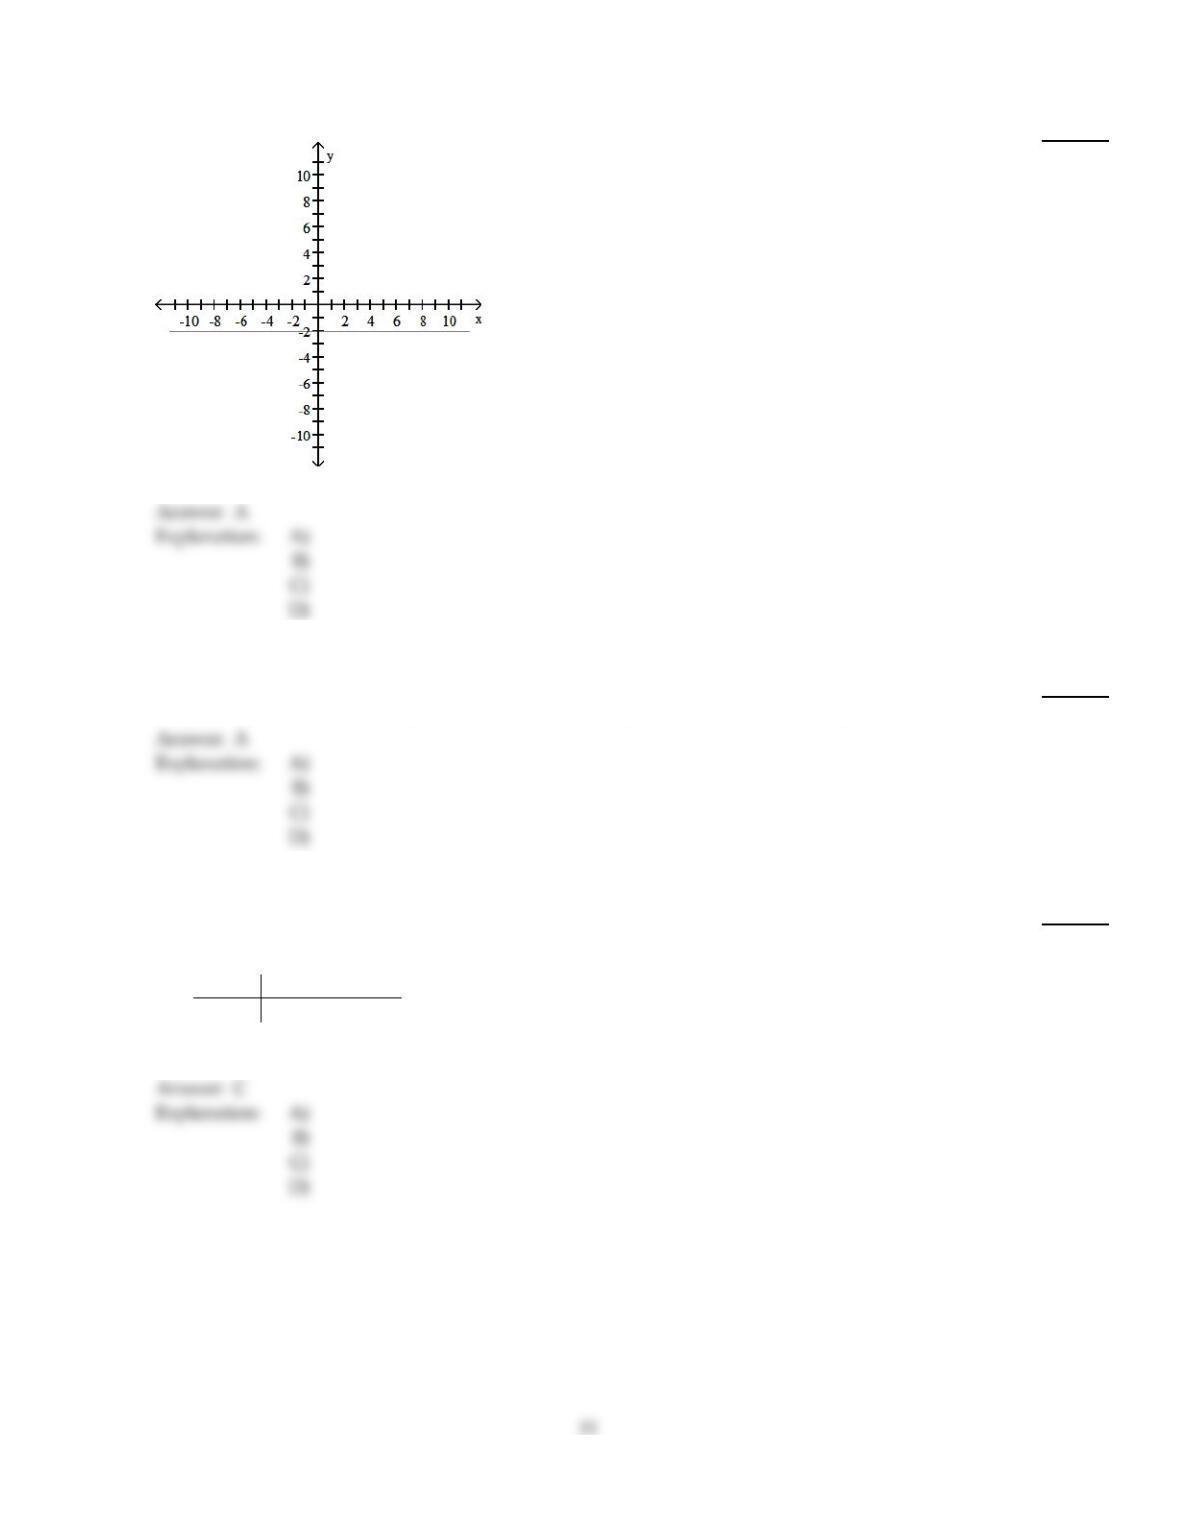
Find the slope of the line.
36)
36)
A)
0
B)
–2
C)
undefined
D)
2
Evaluate the function as indicated.
37)
Find f(–4) when f(x) = – 3x + 6.
37)
A)
18
B)
6
C)
–12
D)
3
Find the equation of the least squares line.
38)
In the table below, x represents the number of years since 2000 and y represents annual sales (in
thousands of dollars) for a clothing company.
Year x 0 1 3 5
Sales y 21 30 35 39
38)
A)
y = 5.18x + 20.6
B)
y = 4.37x + 21.7
C)
y = 3.31x + 23.8
D)
y = 2.61x + 25.9
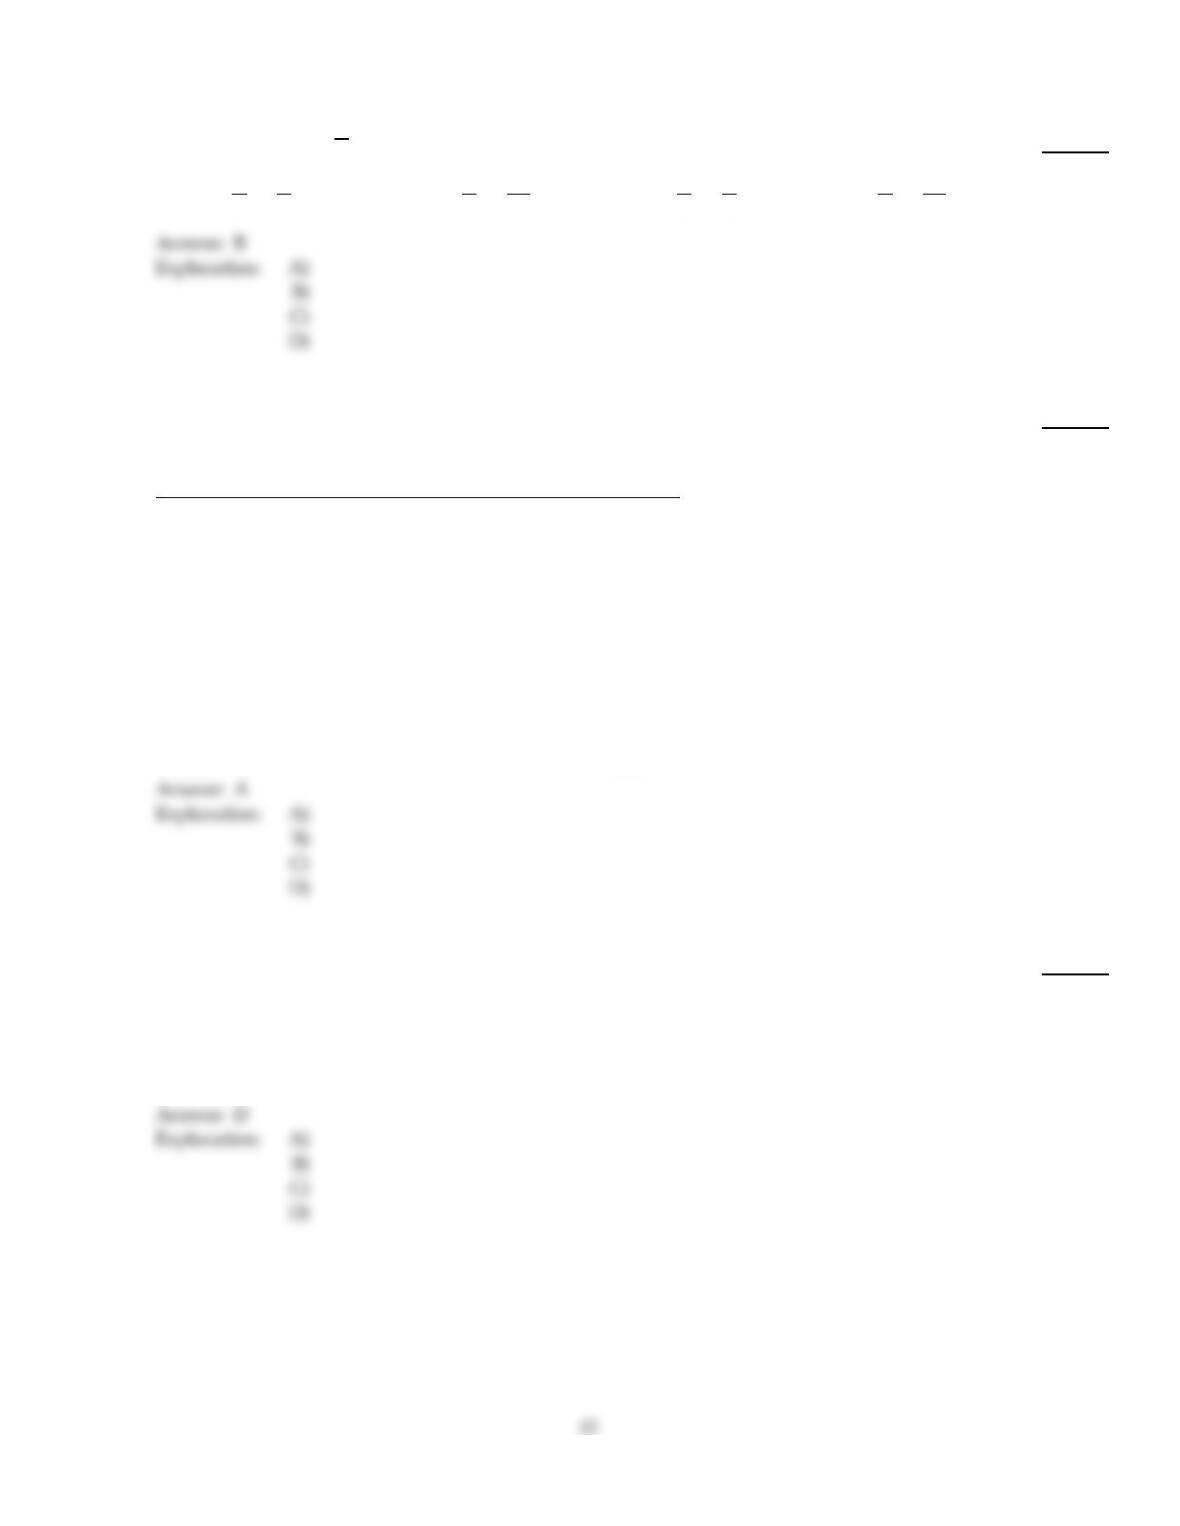
Find an equation in slope–intercept form (where possible) for the line.
39)
Through (3, 2), m = – 5
9
39)
A)
y =5
9x +5
3
B)
y = – 5
9x +11
3
C)
y = – 5
9x +5
3
D)
y =5
9x –11
3
Find the equation of the least squares line.
40)
A study was conducted to compare the average time spent in the lab each week versus course
grade for computer students. The results are recorded in the table below.
Number of hours spent in lab (x) Grade (percent)(y)
10 96
11 51
16 62
9 58
7 89
15 81
16 46
10 51
40)
A)
y = 88.6 – 1.86x
B)
y = 44.3 + 0.930x
C)
y = 1.86 + 88.6x
D)
y = 0.930 + 44.3x
Solve the problem.
41)
In deciding whether or not to set up a new manufacturing plant, analysts for a popcorn company
have decided that a linear function is a reasonable estimation for the total cost C(x) in dollars to
produce x bags of microwave popcorn. They estimate the cost to produce 10,000 bags as $5430 and
the cost to produce 15,000 bags as $7920. Find the marginal cost of the bags of microwave popcorn
to be produced in this plant.
41)
A)
$49.80
B)
$4.98
C)
$2490.00
D)
$0.50
Find the slope of the line.
42)
y =2x –8
42)
A)
0
B)
2
C)
1
D)
–2
Solve the problem.
43)
Let the demand and supply functions be represented by D(p) and S(p), where p is the price in
dollars. Find the equilibrium price and equilibrium quantity for the given functions.
D(p) =4800 – 40p
S(p) =160p
43)
A)
$24; 3840
B)
$120; 0
C)
$120; 3840
D)
$30; 3600
Evaluate the function as indicated.
44)
Find g(a – 1) when g(x) =4x – 5.
44)
A)
4a + 1
B)
4a – 9
C)
4a – 5
D)
1
4a – 5
Find the correlation coefficient.
45)
Consider the data points with the following coordinates:
x 16.8 30.8 20.6 22.4 10.6
y 3 5 10 9 4
45)
A)
0.2591
B)
0.2911
C)
–0.2911
D)
0
Find the slope of the line.
46)
4x + 5y = – 8
46)
A)
–4
5
B)
5
4
C)
–8
5
D)
4
5
13
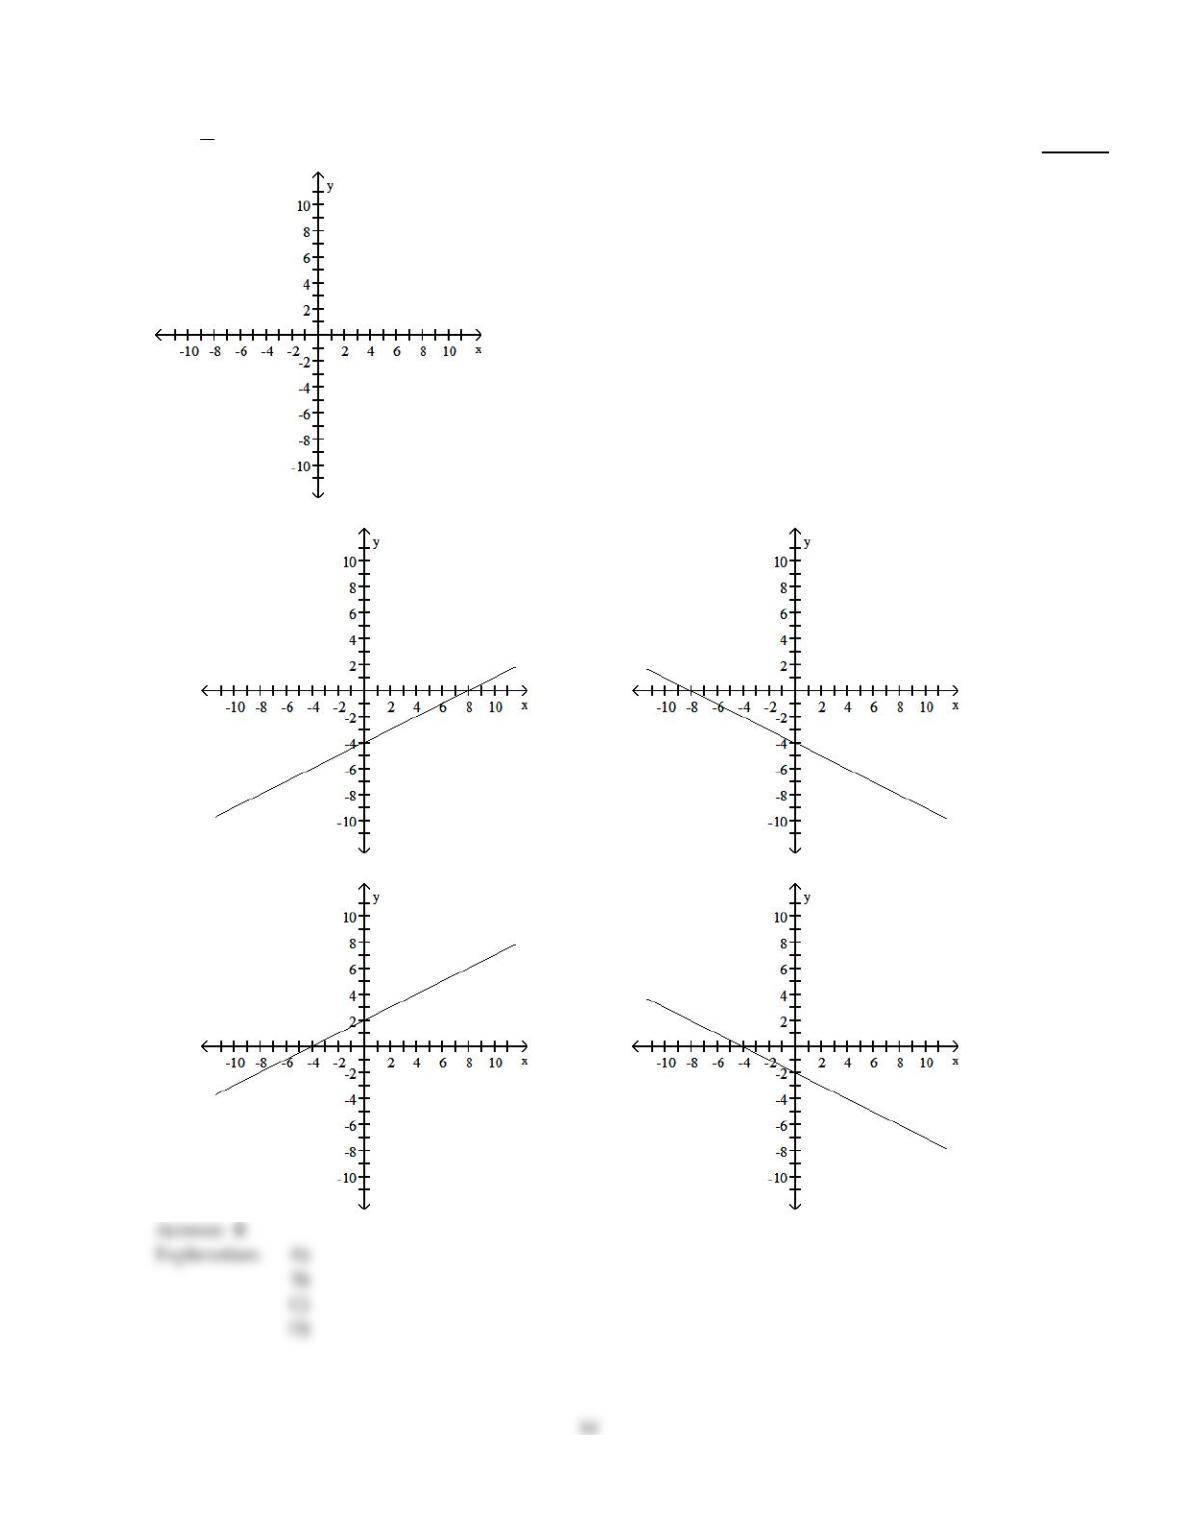
Graph the equation.
47)
y = – 1
2x – 4
47)
A)
B)
C)
D)
Solve the problem.
48)
The temperature of water in a certain lake on a day in October can be determined by using the
model y = 15.2 – 0.537x where x is the number of feet down from the surface of the lake and y is the
Celsius temperature of the water at that depth. Based on this model, how deep in the lake is the
water 13 degrees? (Round to the nearest foot.)
48)
A)
4 feet
B)
23 feet
C)
53 feet
D)
60 feet
49)
Suppose that the price and supply for a certain model of graphing calculator are related by
p = S(q) =2q, where p is the price (in dollars) and q is the supply (in hundreds) of calculators. Find
the supply if the price is $105. Round to the nearest whole number if necessary.
49)
A)
525 calculators
B)
1313 calculators
C)
5250 calculators
D)
2625 calculators
50)
Through (–1, –12), parallel to –5x – 4y =41
50)
A)
y = – 4
5x +12
5
B)
y = – 5
4x –53
4
C)
y = – 1
4x –41
4
D)
y =5
4x +53
4
Solve the problem.
51)
When going more than 38 miles per hour, the gas mileage of a certain car fits the model
y = 43.81 – 0.395x where x is the speed of the car in miles per hour and y is the miles per gallon of
gasoline. Based on this model, at what speed will the car average 15 miles per gallon? (Round to
nearest whole number.)
51)
A)
98 miles per hour
B)
48 miles per hour
C)
73 miles per hour
D)
149 miles per hour
52)
For the following table of data,
a. Draw a scatterplot.
b. Calculate the correlation coefficient.
c. Calculate the least squares line and graph it on the scatterplot.
d. Predict the y–value when x is –23.
52)
15
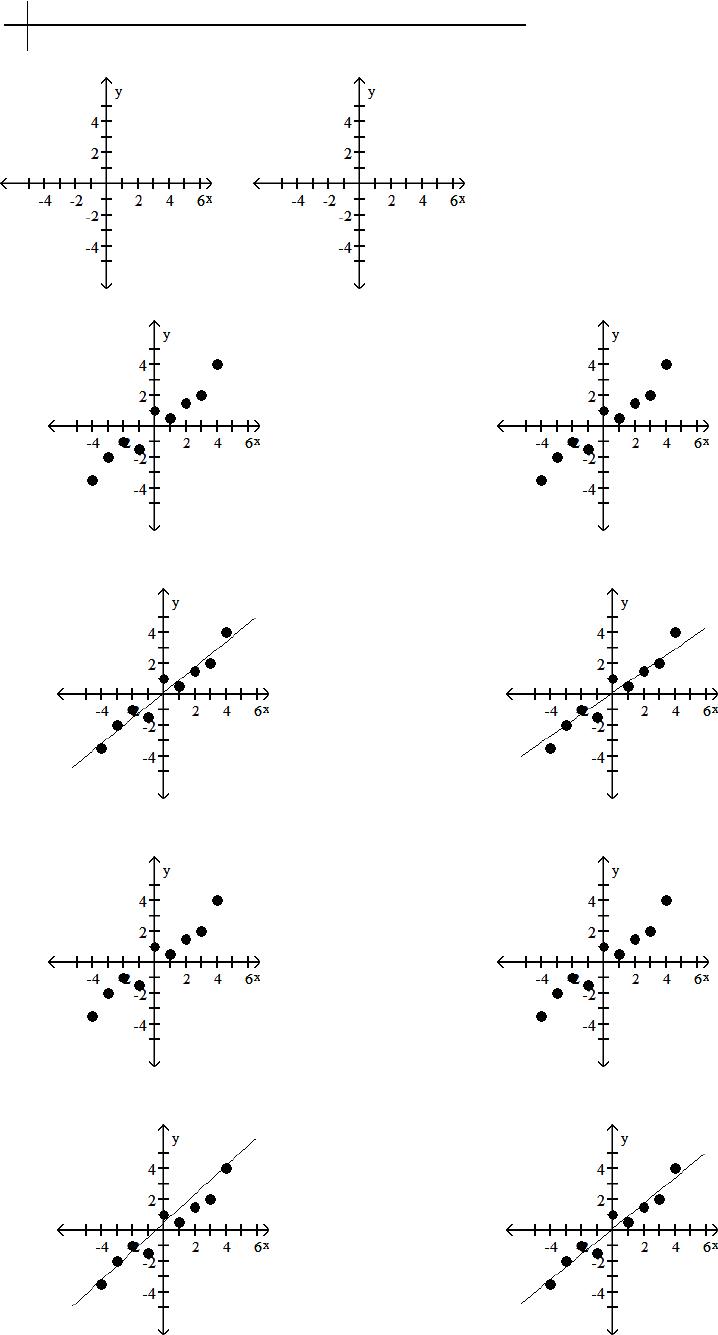
x –4–3–2–1 0 1 2 3 4
y –3.5 –2–1–1.5 1 0.5 1.5 2 4
A)
a.
b. 0.966
c. Y = 0.82x + 0.11
d. –18.75
B)
a.
b. –0.966
c. Y = – 0.82x – 0.11
d. 18.75
C)
a.
b. 0.966
c. Y = 0.82x – 0.11
d. –18.97
D)
a.
b. –0.966
c. Y = 0.82x + 0.11
d. –18.97
16
53)
If an object is dropped from a tower, then the velocity, V (in feet per second), of the object after t
seconds can be obtained by multiplying t by 32 and adding 10 to the result. Write an equation
expressing the velocity, V, in terms of the number of seconds, t. Use this function to predict the
velocity of the object at time t =4.5 seconds.
53)
A)
154 feet per second
B)
153.3 feet per second
C)
152 feet per second
D)
155.3 feet per second
Find the slope of the line.
54)
y =5
6x
54)
A)
6
5
B)
5
6
C)
0
D)
1
Solve the problem.
55)
The paired data below consist of the costs of advertising (in thousands of dollars) and the number
of products sold (in thousands). Use the equation of the least squares line to predict the number of
products sold if the cost of advertising is $11,000.
Cost (x) 9 2 3 4 2 5 9 10
Number (y) 85 52 55 68 67 86 83 73
55)
A)
83.49 products sold
B)
93.19 products sold
C)
30,745.8 products sold
D)
86.49 products sold
56)
Midtown Delivery Service delivers packages which cost $2.30 per package to deliver. The fixed cost
to run the delivery truck is $352 per day. If the company charges $6.30 per package, how many
packages must be delivered daily to make a profit of $64?
56)
A)
88 packages
B)
40 packages
C)
153 packages
D)
104 packages
Evaluate the function as indicated.
57)
Find f(3.2) when f(x) =1.0x – 9.
57)
A)
–5.8
B)
2.3
C)
12.2
D)
–12.2
Solve the problem.
58)
In order to receive a B in a course, it is necessary to get an average of 80% correct on two one–hour
exams of 100 points each, on one midterm exam of 200 points, and on one final exam of 500 points.
If a student scores 92, and 83 on the one–hour exams, and 140 on the midterm exam, what is the
minimum score on the final exam that the person can get and still earn a B?
58)
A)
315
B)
405
C)
450
D)
585
Find the slope of the line.
59)
A line perpendicular to 8x – 3y = – 11
59)
A)
–8
3
B)
8
C)
3
8
D)
–3
8
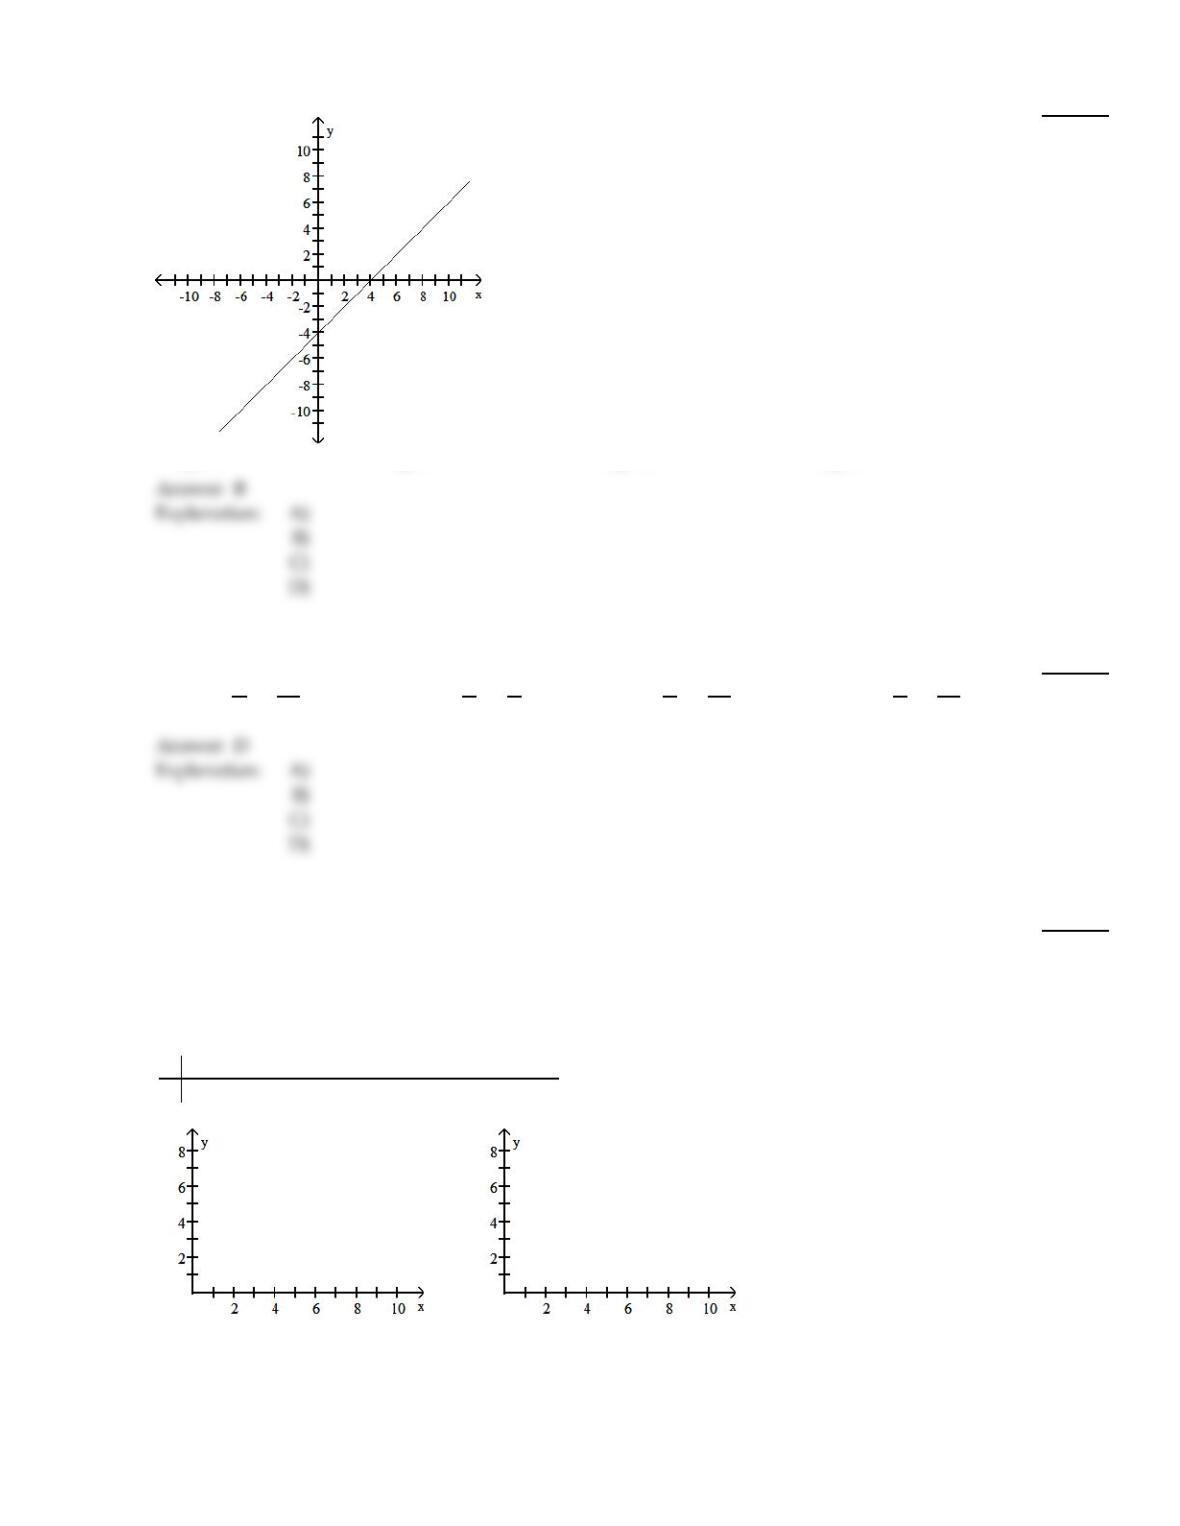
60)
60)
A)
–1
B)
1
C)
–4
D)
4
Find an equation in slope–intercept form (where possible) for the line.
61)
Through (–4, –3), perpendicular to 9x – 5y = – 51
61)
A)
y =5
9x –47
9
B)
y = – 9
5x –9
5
C)
y =4
5x –51
5
D)
y = – 5
9x –47
9
Solve the problem.
62)
For the following table of data,
a. Draw a scatterplot.
b. Calculate the correlation coefficient.
c. Calculate the least squares line and graph it on the scatterplot.
d. Predict the y–value when x is 15.
x 1 2 3 4 5 6 7 8 9
y 5 4.5 4 4 3 3.5 2.5 2 1
62)
19
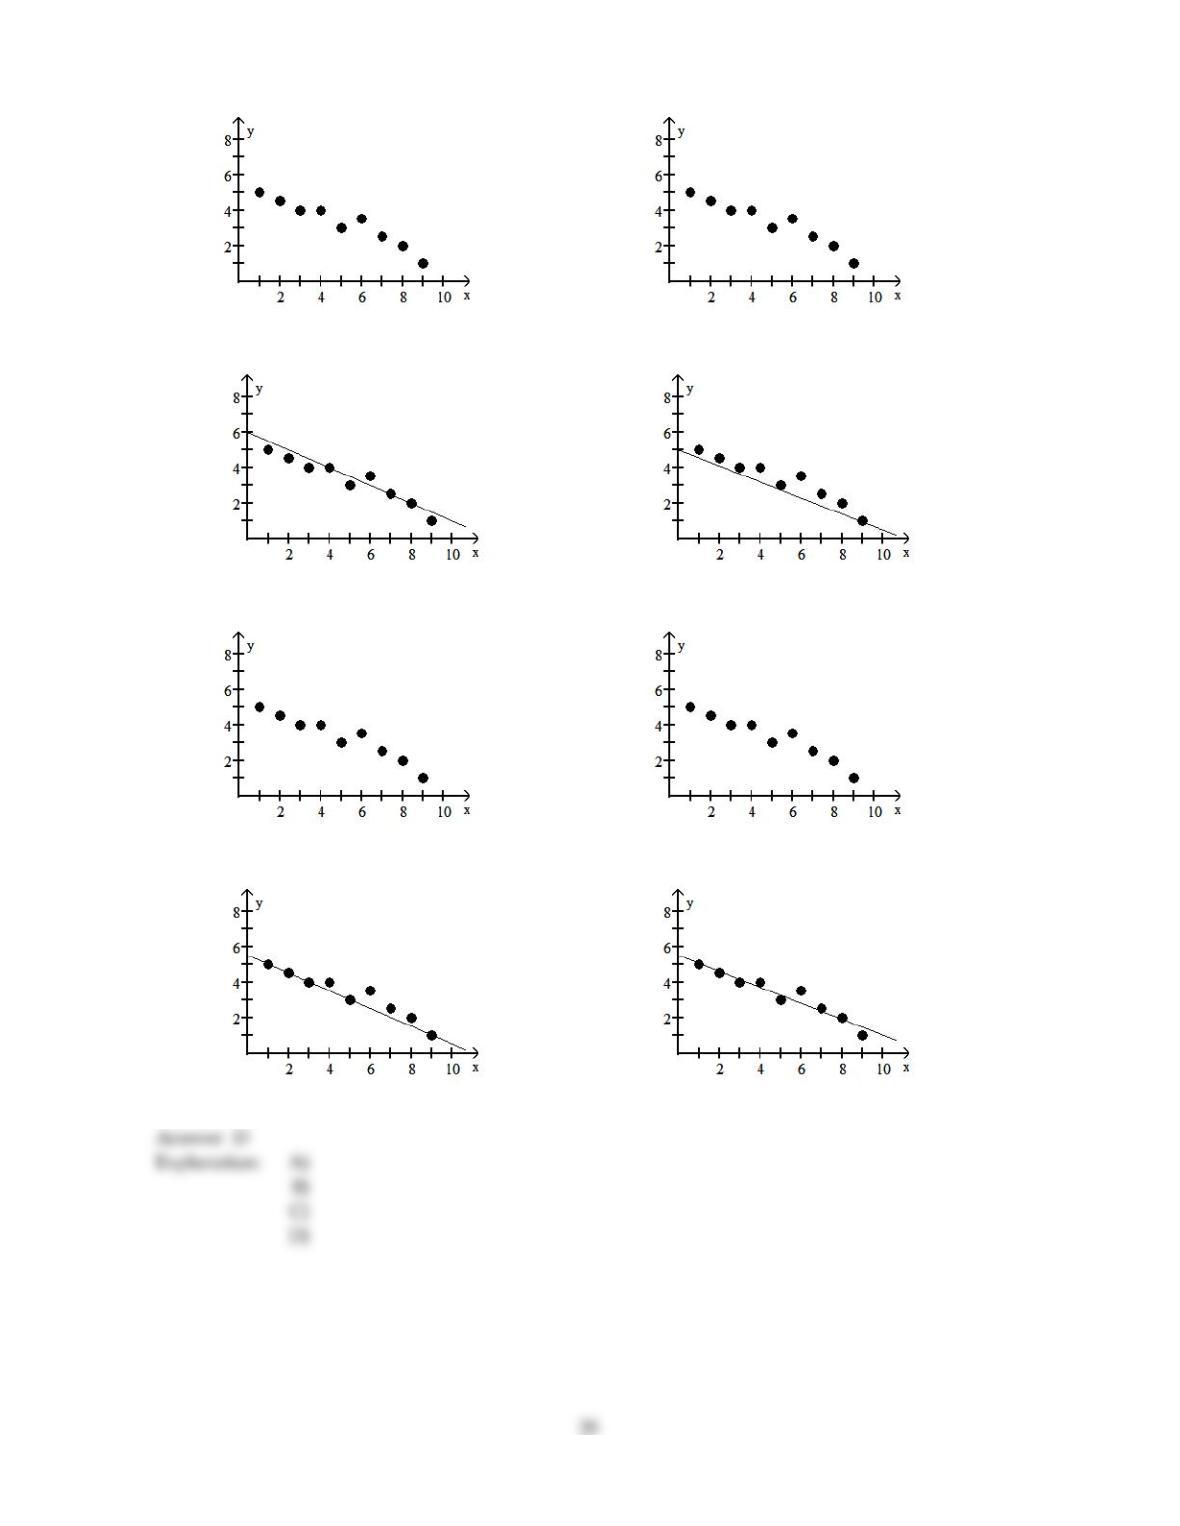
A)
a.
b. 0.965
c. Y = 0.45x – 5.53
d. 1.22
B)
a.
b. –0.965
c. Y = – 0.45x – 5.53
d. –12.28
C)
a.
b. 0.965
c. Y = – 0.45x + 5.53
d. –1.22
D)
a.
b. –0.965
c. Y = – 0.45x + 5.53
d. –1.22