Elements of Ecology, 9e (Smith)
Chapter 9 Population Growth
9.1 Short Answer Questions
1) Population ________ refers to the rate at which the number of individuals in a population
increases or decreases with time.
2) Movement in and out of a population occurs in a(n) ________ population.
3) There is no change in population size when the instantaneous per capita rate of growth (r) is
equal to ________.
4) Populations inhabiting favorable environments at low population densities typically
experience ________ population growth, resulting in a continuously accelerating rate of
population increase.
5) A group of individuals born in the same period of time is called a(n) ________.
6) Life ________ refers to the average number of years that an individual is expected to live
from the time of his or her birth.
7) Ecologists develop a(n) ________ life table to follow the fate of a group of individuals, who
were all born at a given time, from birth to death.
8) A(n) ________ life table is constructed by sampling the population to obtain a distribution of
age classes during a single time period.
9) A(n)________ curve plots the probability at birth of surviving to any given age (lx) against
time or age class (x).
10) A type ________ survivorship curve is typical of populations in which individuals tend to
live out their physiological life span.
11) Rodents typically exhibit a type ________ survivorship curve.
12) ________ is the study of populations.
13) The ________ birthrate is expressed as the births per 1000 individuals per unit of time.
14) The net reproductive rate (R0) is equal to ________ when females, on average, replace
themselves in a population.
15) A(n) ________ distribution refers to the proportion of individuals in the various age classes
for any one year.
16) ________ stochasticity is the random variation in birth and death rates that occurs in
populations from year to year.
17) ________ stochasticity is the random variation in birth and death rates that occurs in
populations from year to year as a result of natural disasters and other annual variations in the
environment.
18) A population eventually becomes ________ when its population growth (r) remains negative
without reversing.
9.2 Multiple-Choice Questions
1) A population that is increasing in size has an intrinsic rate of population growth (r) that is
A) < 0.
B) = 0.
C) > 0.
D) > 1.
2) When the conditions are favorable for a population at low density, such as when a species
colonizes a new environment, population growth is typically
A) exponential.
B) logistic.
C) tangential.
D) dynamic.
3) Which of the following equations reflects the exponential model of population growth?
A) N(t) = b – d
B) s = ΔN / Δt
C) N(t) = N(0)ert
D) dN / dt = rN
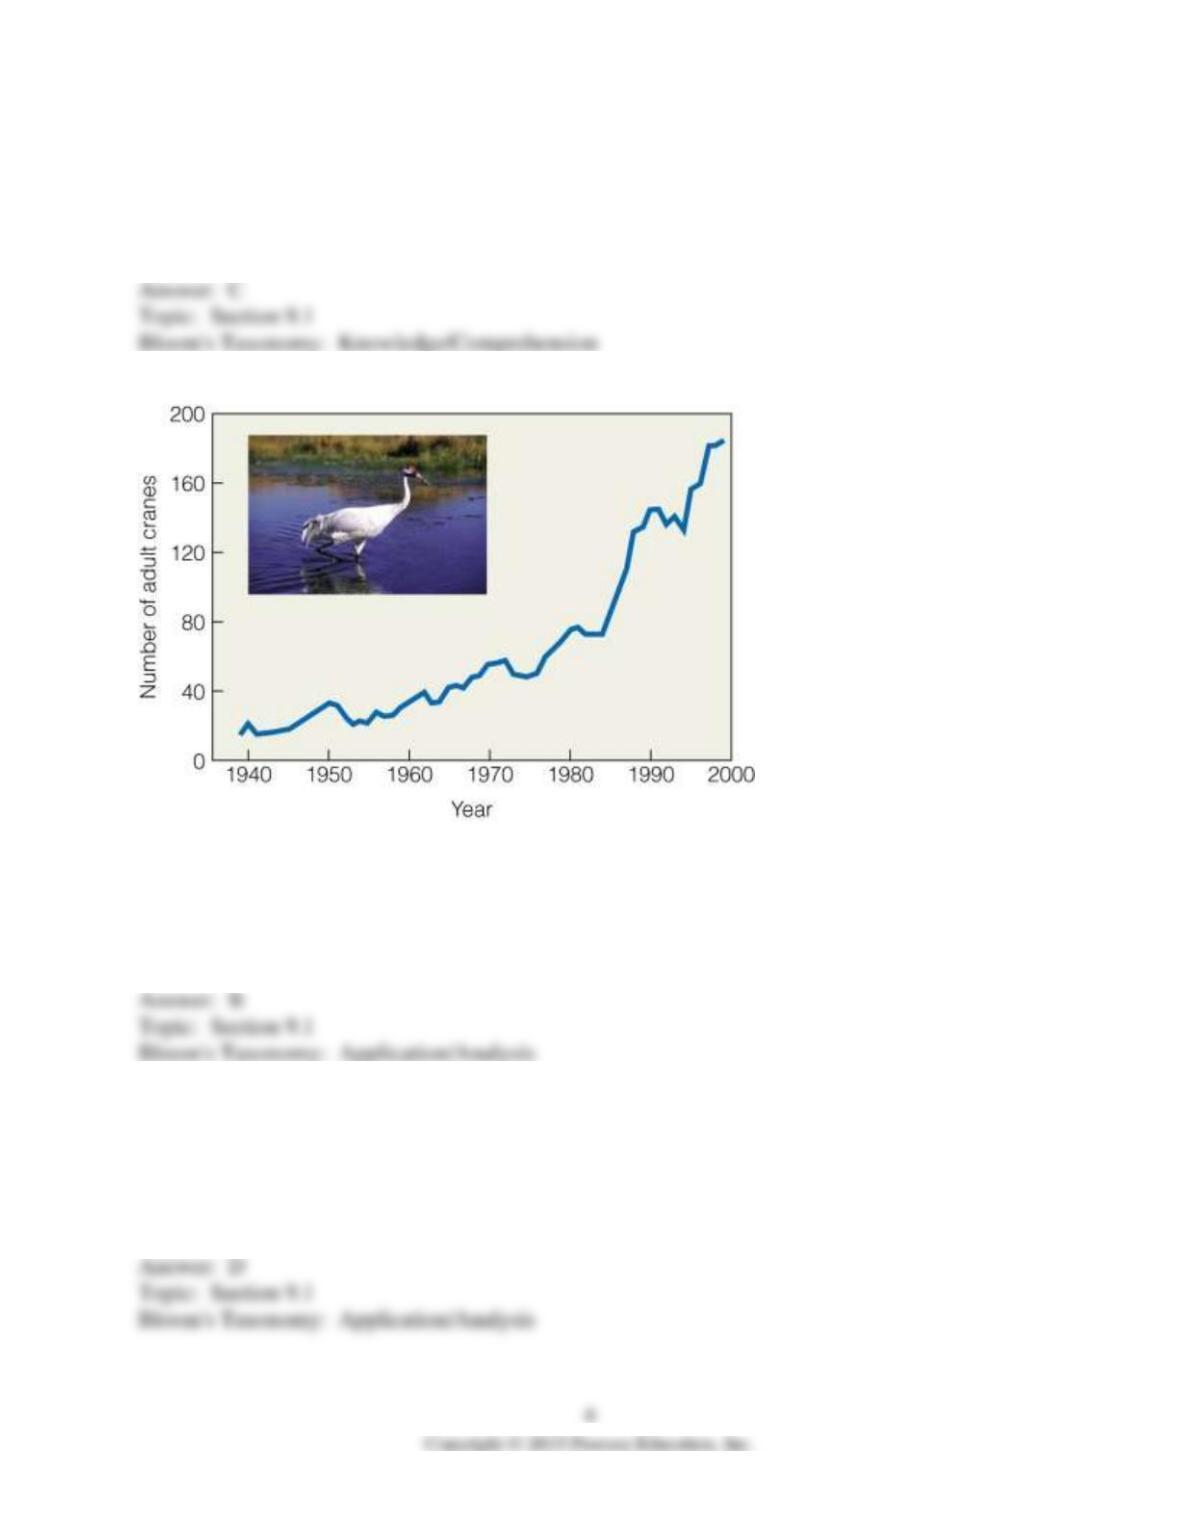
4)
The pattern shown in figure 9.6 best resembles
A) a survivorship curve.
B) exponential growth.
C) R0= 0.
D) r < 0.
5) Which model of population growth would you employ if reproduction occurs in discrete time
periods rather than being continuous?
A) exponential
B) reciprocal
C) logarithmic
D) geometric
6) qx =
A) nx/dx.
B) nx/lx.
C) dx/nx.
D) Tx/nx.
7) A systematic compilation of mortality and survival data for a population is called a(n)
A) age pyramid.
B) life table.
C) cohort group.
D) probability summary.
8) Age-specific mortality is defined as the
A) difference between the number of individuals alive for any age class and the next older age
class.
B) number of individuals that died during any given time interval divided by the number alive at
the beginning of that interval.
C) number of individuals from the original cohort who are alive at the specified age.
D) probability at birth of surviving to any given age.
9) Calculate L1, given n1 = 100, n2 = 50, and n3 = 10.
A) 90
B) 50
C) 75
D) 10
10) Which stage has the longest life expectancy?
A) ex = 0
B) ex = 1
C) ex = 2
D) ex = 0.5
11) Most life tables have been constructed for
A) short-lived plants.
B) insects.
C) short-lived vertebrates.
D) long-lived mammals.
12) A time-specific life table is constructed by sampling the
A) fate of a group of individuals born at a given time from birth to death.
B) fate of a group of individuals born over several time periods from birth to death.
C) population to obtain a distribution of age classes during a single time period.
D) population to obtain a distribution of age classes during multiple time periods.
13) A dynamic composite life table is different from a dynamic life table it that it uses
individuals
A) born over several time periods.
B) born in a single time period.
C) from several different locations.
D) from several different life tables.
14) What value do mortality rate curves end on?
A) 0
B) 1.0
C) however many individuals are dead
D) the percentage of the population that dies in the last time period
15) If survival rates do not vary with age, as in many species of perennial plants, reptiles, adult
birds, and rodents, survivorship curves are typically
A) type I.
B) type II.
C) type III.
D) type IV.
16) Survivorship curves plot ________ against x.
A) dx
B) lx
C) log lx
D) qx
17)
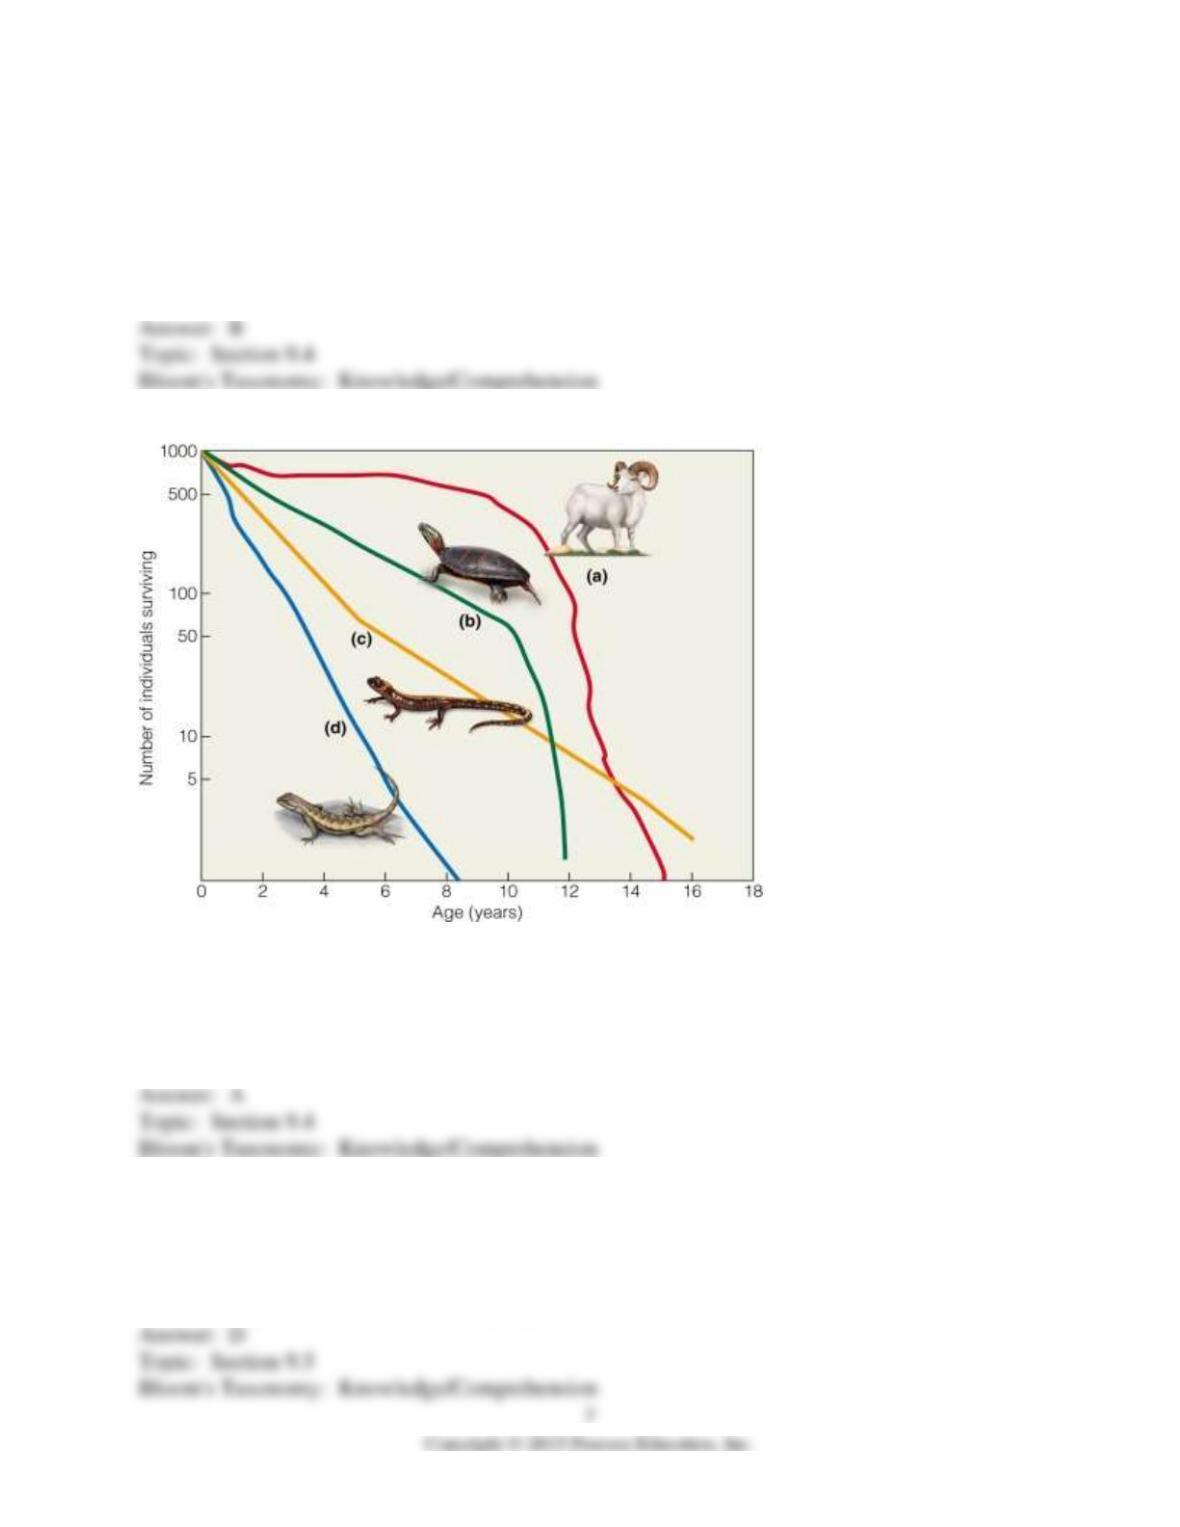
The Dall sheep (a) curve represents which type of survivorship curve?
A) Type I
B) Type II
C) Type III
D) Type IV
18) The gross reproductive rate is
A) the total number of offspring born to a population.
B) the total number of offspring born to a population each year.
C) the average number of female offspring born in a year.
D) the average number of female offspring born to her over her lifetime.
19) The number of births per female of age x is referred to as the
A) crude birthrate.
B) age-specific birthrate.
C) gross reproductive rate.
D) net reproductive rate.
20) The average number of female offspring born to a female over her lifetime is referred to as
the
A) crude birthrate.
B) age-specific birthrate.
C) gross reproductive rate.
D) net reproductive rate.
21) Why is the b0 = 0 at time period x0 for some species?
A) The birthrate always starts at 0.
B) Some species do not reproduce during the first time period.
C) All individuals are dead at x0.
D) This is the case because m0 times 0 always = 0.
22) The net reproductive rate is the sum of what column?
A) lxbx
B) bx
C) lx
D) x
23) A fecundity table is constructed for a gray squirrel as follows.
________________________
x lx bx lxbx
0 1.0 0.0 0.00
1 0.3 2.0 0.60
2 0.15 3.0 0.45
3 0.09 3.0 0.27
4 0.04 2.0 0.08
5 0.01 0.0 0.00
On the basis of these calculations, the net reproductive rate (R0) is equal to
A) 1.4.
B) 1.59.
C) 10.
D) 15.
24) A population that is growing has a net reproductive rate (R0) that is
A) = 0.
B) > 0 and < 1.
C) = 1.
D) > 1.
25) A population reaches a stable-age distribution when the
A) population stops growing.
B) birthrate is less than the death rate.
C) net reproductive rate (R0) is zero.
D) proportion of individuals in each age group remains the same.
26) If N(0) = 30 and λ = 1.20, what is the population size for year one?
A) 25
B) 28.8
C) 30
D) 36
27) When females form the reproductive unit of a population, what would the population be
when one calculates a population of 50 from a life table?
A) 100
B) 25
C) 50
D) 200
28) Given λ = 2, what would the intrinsic rate of reproduction (r) be?
A) 4
B) 0.69
C) 1
D) 0
29) A flood wiping out a population would be an example of
A) exponential growth.
B) survivorship curve.
C) demographic stochasticity.
D) environmental stochasticity.
30) In a population projection matrix, S34 would represent
A) the probability an individual in stage class 3 would move to 4.
B) the probability an individual in stage class 4 would revert to 3.
C) the time it takes an individual to move from 3 to 4.
D) the average amount of growth that occurs from stage class 3 to 4.
31) Why are population projection matrices so complicated?
A) because plant sizes are fixed over time
B) because larger populations require more sophistication
C) because fecundity is high in some species
D) because some species can move back and forth between life stages
32) The leading cause of current species extinctions is
A) global warming.
B) habitat destruction.
C) hunting.
D) diseases.
33) Which populations are at greatest risk for extinction?
A) very small ones
B) very large ones
C) ones with specific niches
D) ones with extensive habitat ranges
34) According to the latest data, which region has the highest number of species recently gone
extinct?
A) North America
B) South America
C) Africa
D) Australia
35) What is one of the most damaging issues in freshwater systems that has caused the highest
number of declines in fish?
A) pollution
B) dams
C) climate change
D) ozone depletion
9.3 True/False Questions
1) Immigration and emigration occur within a closed population.
2) Exponential growth is characteristic of populations that inhabit favorable environments at low
densities.
3) The instantaneous per capita rate of growth (r) of a growing population is greater than zero.
4) Exponential population growth does not occur in natural populations.
5) In a given life table, qx represents the age-specific mortality rate.
6) A time-specific life table follows a group of individuals born at a given time from birth to
death.
7) Species with type III survivorship curves experience extremely high mortality rates in early
life.
8) The probability of survival and death usually varies with age.
9) The gross reproductive rate represents the number of births per 1000 population per unit of
time.
10) The net reproductive rate (R0) refers to the average number of females that will be produced
during a lifetime by a newborn female.
11) A population in which λ equals one has reached a stable-age distribution.
12) Environmental stochasticity refers to random variations in birth and death rates occurring in
populations from year to year.
13) The introduction of a novel organism into an ecosystem can lead to the extinction of species.
9.4 Essay Questions
1) Describe and illustrate exponential population growth. Under what conditions would
exponential growth be expected to occur?
2) Explain why ecologists construct life tables and describe what information is required to
develop them.
3) Compare and contrast the two basic types of life tables. Discuss the advantages and
disadvantages of each.
4) Illustrate three types of survivorship curves and give examples of each. What factors cause the
three different types to appear in nature?
5) Define four types of birthrates and reproductive rates. How are these related to the age of
individuals and the growth rate of populations?
6) Discuss two stochastic processes and describe how each influences population dynamics.
7) Discuss five factors known to cause extinction. Which factor is considered the leading cause
of current extinctions and why?