Environment: Science Behind the Stories, 2e Cdn. Ed. (Withgott)
Chapter 6 Human Population
6.1 Graph and Figure Interpretation Questions
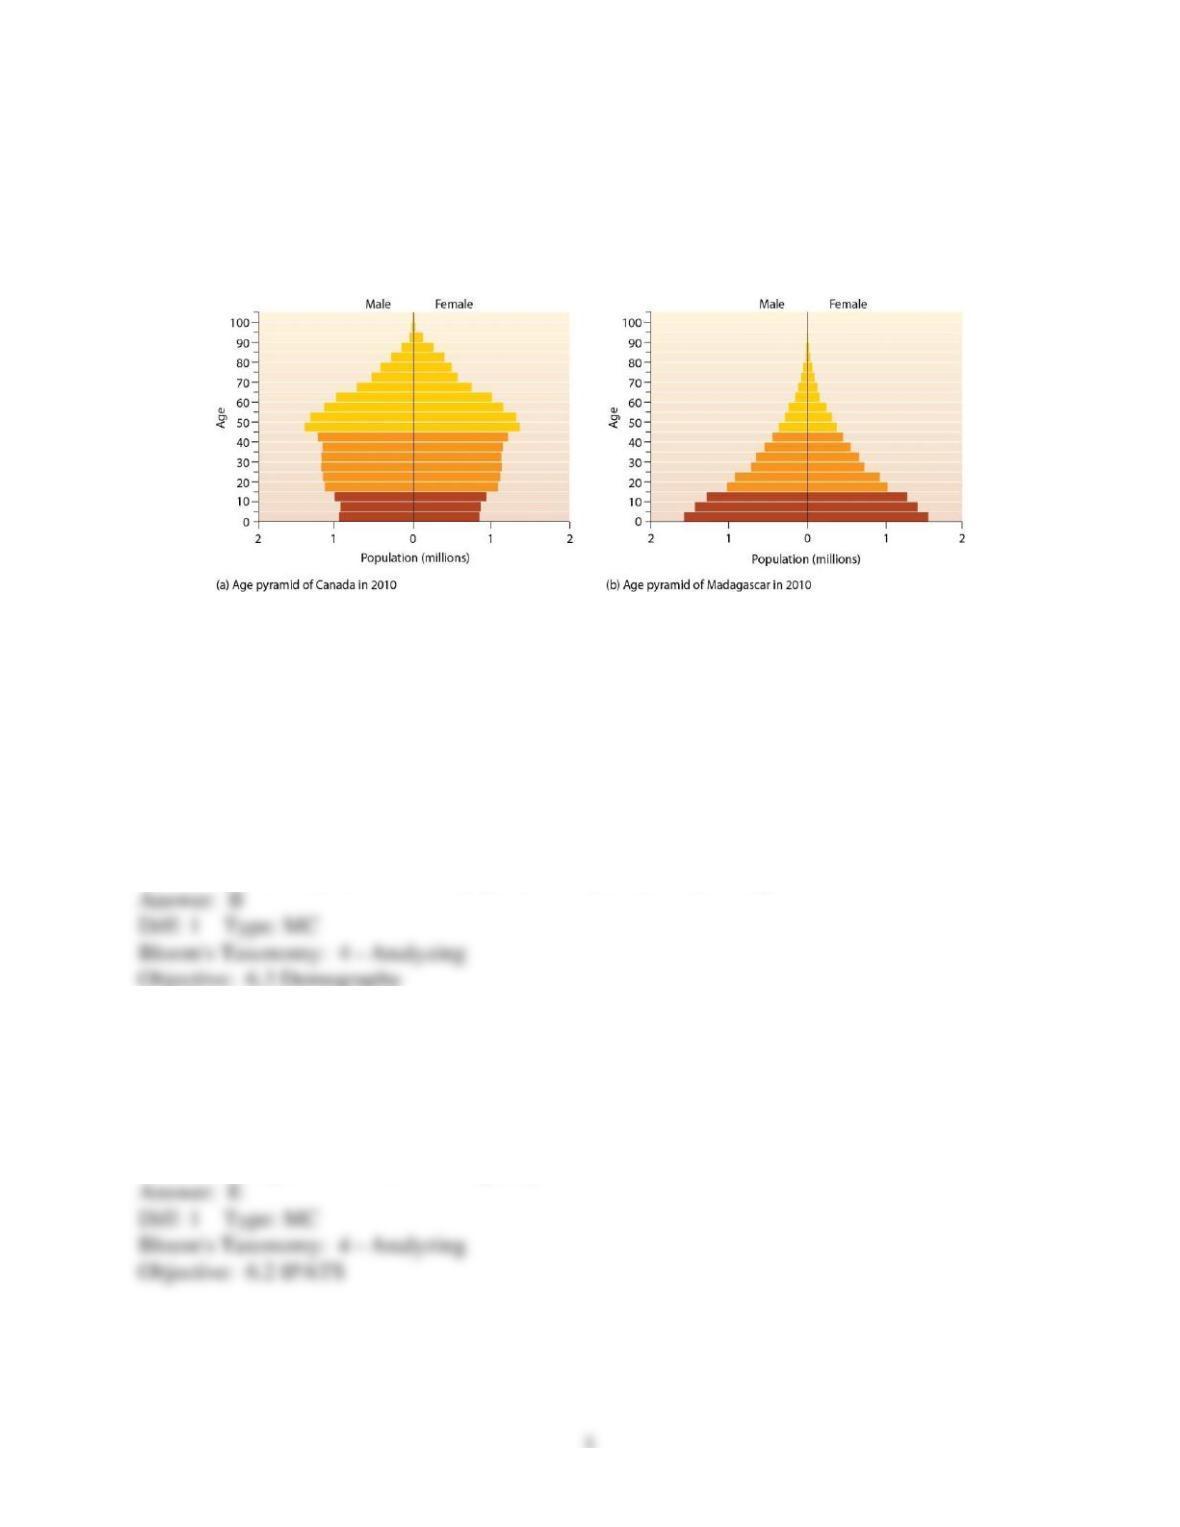
Figure 6.1
Use Figure 6.1 to answer the following questions.
1) Refer to Figure 6.1. Looking at the figure, you are able to determine that ________.
A) the population in part (a) is growing rapidly
B) the population in part (b) is growing rapidly
C) the population in part (b) has many more males than females
D) the population in part (b) is aging rapidly
E) there was a “baby boom” in the population in part (b) 30 years ago
2) Refer to Figure 6.1. What is the population in part (b) likely to experience soon?
A) more single males
B) fewer households
C) lack of economic growth
D) more senior citizens
E) resource depletion and decreased quality of life

3) Refer to Figure 6.1. What is the population in part (a) likely to experience soon?
A) more single males
B) exponential population growth
C) government institution of a population control policy
D) more senior citizens
E) resource depletion and decreased quality of life

3
6.2 Matching Questions
Match the following.
A) Malthus
B) Canada
C) Japan
D) 120
E) Latin America and the Caribbean
F) 80
G) African nations
H) European nations
I) Indonesia
J) Argentina
K) United States
L) Cornucopians
1) This region has been hit the hardest by the HIV/AIDS epidemic
2) Of the two nations, the one with the larger population size
3) The 1994 genocide in Rwanda supports the theories of
4) TFR is 2.4 in this region
5) Of the two nations, the one with a higher percentage of women holding national parliamentary
seats
6) Number of newborn girls in China per 100 newborn boys
Diff: 1 Type: MA
Bloom’s Taxonomy: 2 – Understanding
Objective: 6.5 Poverty, women and population growth
6.3 Short Answer Questions
1) What specific population characteristics do demographers study? Why is it important to study
these things?
2) Briefly explain how the status of women affects population growth.
3) What factors determine whether a population of humans grows, shrinks, or remains stable?
4) Briefly explain the advantages and disadvantages to China’s policy on population control.
5) Which regions of the Earth have appropriated the largest percentage of the natural net primary
production (NPP)?
6) Name the four historic major social transitions (revolutions) that dramatically increased
Earth’s carrying capacity for humans, and identify one or two main inventions that created each
transition.
7) Explain demographic fatigue.
8) Lifestyle changes brought about by ________ and ________ have decreased the economic
need for children.
9) The application of population ecology principles to the study of statistical change in human
populations is the focus of the social science of ________.
10) During which stage of the demographic transition does most of the increase in population
size happen and why?
6.4 Multiple-Choice Questions
1) The human population is approximately ________.
A) 1.5 million
B) 6.5 million
C) 1.5 billion
D) 7 billion
E) 10 billion
2) During which time period did the world’s population more than double?
A) 1750–1800
B) 1800–1850
C) 1850–1900
D) 1900–1950
E) 1950–2000
3) If a population roughly doubles in the course of 50 years, its growth rate would be close to
________%.
A) 1.5
B) 2
C) 0.2
D) 20
E) 1

4) ________ is the world’s most populous nation, home to ________ of the people living on
Earth.
A) China; one-fourth
B) China; one-fifth
C) The United States; one-fourth
D) India; one-fourth
E) India; one-fifth
5) Which of the following is NOT one of the world’s top seven most populous nations?
A) Vietnam
B) Brazil
C) Indonesia
D) Bangladesh
E) Pakistan
6) Replacement fertility ________.
A) restores population size after a catastrophic event
B) is a contraceptive technique
C) is below 2.0 in Latin America and the Caribbean
D) is equal to 2.0 in stable populations
E) is equal to 2.1 in stable populations
7) If there is ________, population growth rates will increase.
A) increased immigration
B) increased emigration
C) decreased immigration
D) increased urbanization
E) increased industrialization

8) Currently, the highest TFRs are in ________.
A) Africa
B) Asia
C) Latin America
D) Oceania
E) Europe (including Russia)
9) Declining death rates on account of increased food production and improved medical care
while birth rates remain high is characteristic of the ________ stage.
A) pre-industrial
B) stabilization
C) transitional
D) post-industrial
E) revolutionary
10) Areas with the least dense human populations are in ________.
A) agricultural areas
B) temperate areas
C) Europe
D) Mexico
E) the suburbs
11) Which of the following countries has the highest TFR?
A) Egypt
B) Colombia
C) Ethiopia
D) Jamaica
E) South Africa

9
12) Which of the following factors drives TFR down?
A) rural lifestyle
B) social and economic security
C) sexism
D) history and tradition
E) high infant mortality
13) The transitional stage in Frank Notestein’s demographic model is initiated by ________.
A) government intervention
B) the increased use of contraceptives
C) epidemics
D) industrialization
E) resource depletion
14) The richest one-fifth of the world’s population possess approximately ________ times the
income of the poorest one-fifth, and the richest one-fifth use more than 86% of the world’s
resources.
A) 10
B) 20
C) 40
D) 60
E) 80
15) If global fertility rates remain at 2010 levels, the United Nations predicts that the world
population will be approximately ________ billion in 2050.
A) 11
B) 9
C) 7
D) 8
E) 6
16) In the textbook’s graph showing TFR as a function of GDP per capita (Figure 6.18), the

10
fertility rate declines as the GDP per capita increases. There are two outliers though: Saudi
Arabia and Israel have much higher fertility rates than other countries with comparable GDP per
capita. The likely reason for this is that ________.
A) contraceptives are unavailable
B) the population statistics from these two countries are not reliable
C) cultural factors outweighed economic and social tendencies of declining TFR
D) the demographic transition has reversed in these two countries
E) these are random fluctuations
17) A country with ________ is not expected to grow quickly in the near future.
A) a pyramid–shaped age–structure diagram
B) high female literacy
C) a female to male ratio of 1.2 to 1
D) growing industrialization
E) many developing regions
18) In a country in which the age pyramid has a very wide base and then rapidly narrows with
increasing age, which of the following is NOT likely to happen in the next 30 years?
A) The number of households will increase.
B) The consumption will be stable.
C) The birth rates will increase.
D) The society will have to provide for the large number of people in the post-productive age.
E) The population size will increase.
19) Which is NOT true about the HIV/AIDS epidemics in sub-Saharan Africa?
A) The average life expectancy fell from 65 to 59 years.
B) Infant mortality increased.
C) Many teachers died, creating problems in the education systems.
D) Income declined.
E) Food production declined.
20) The demographic effects of AIDS are most significant because ________.

11
A) AIDS strikes affluent people more than poor people
B) it is caused by a virus
C) it is not known who is resistant to AIDS
D) AIDS leaves behind orphans
E) AIDS sickens and kills the youngest and most productive members of society
21) Canada’s age–structure diagram ________.
A) looks like a pyramid
B) reflects unequal distribution of males and females at all age groups
C) reflects a “baby boom” in the early 1980s
D) reflects an aging population
E) reflects a population with a high growth rate
22) If the current growth rate of ________% per year continued, Earth’s population would double
in less than 60 years.
A) 1.6
B) 1
C) 2
D) 1.2
E) There is not enough information to answer this question.
23) According to the IPAT model, the introduction of industrialized fisheries that use big
trawlers, satellite navigation, and sonars to locate the fish ________.
A) increases environmental impact
B) decreases environmental impact
C) increases population
D) increases sensitivity
E) decreases sensitivity
24) The cornucopian view held by many economists suggests that resource depletion caused by
greater numbers of people ________.
A) is not a problem if new resources can be found to replace depleted ones