Larson_Calculus_10e ch00sec04
MULTIPLE CHOICE
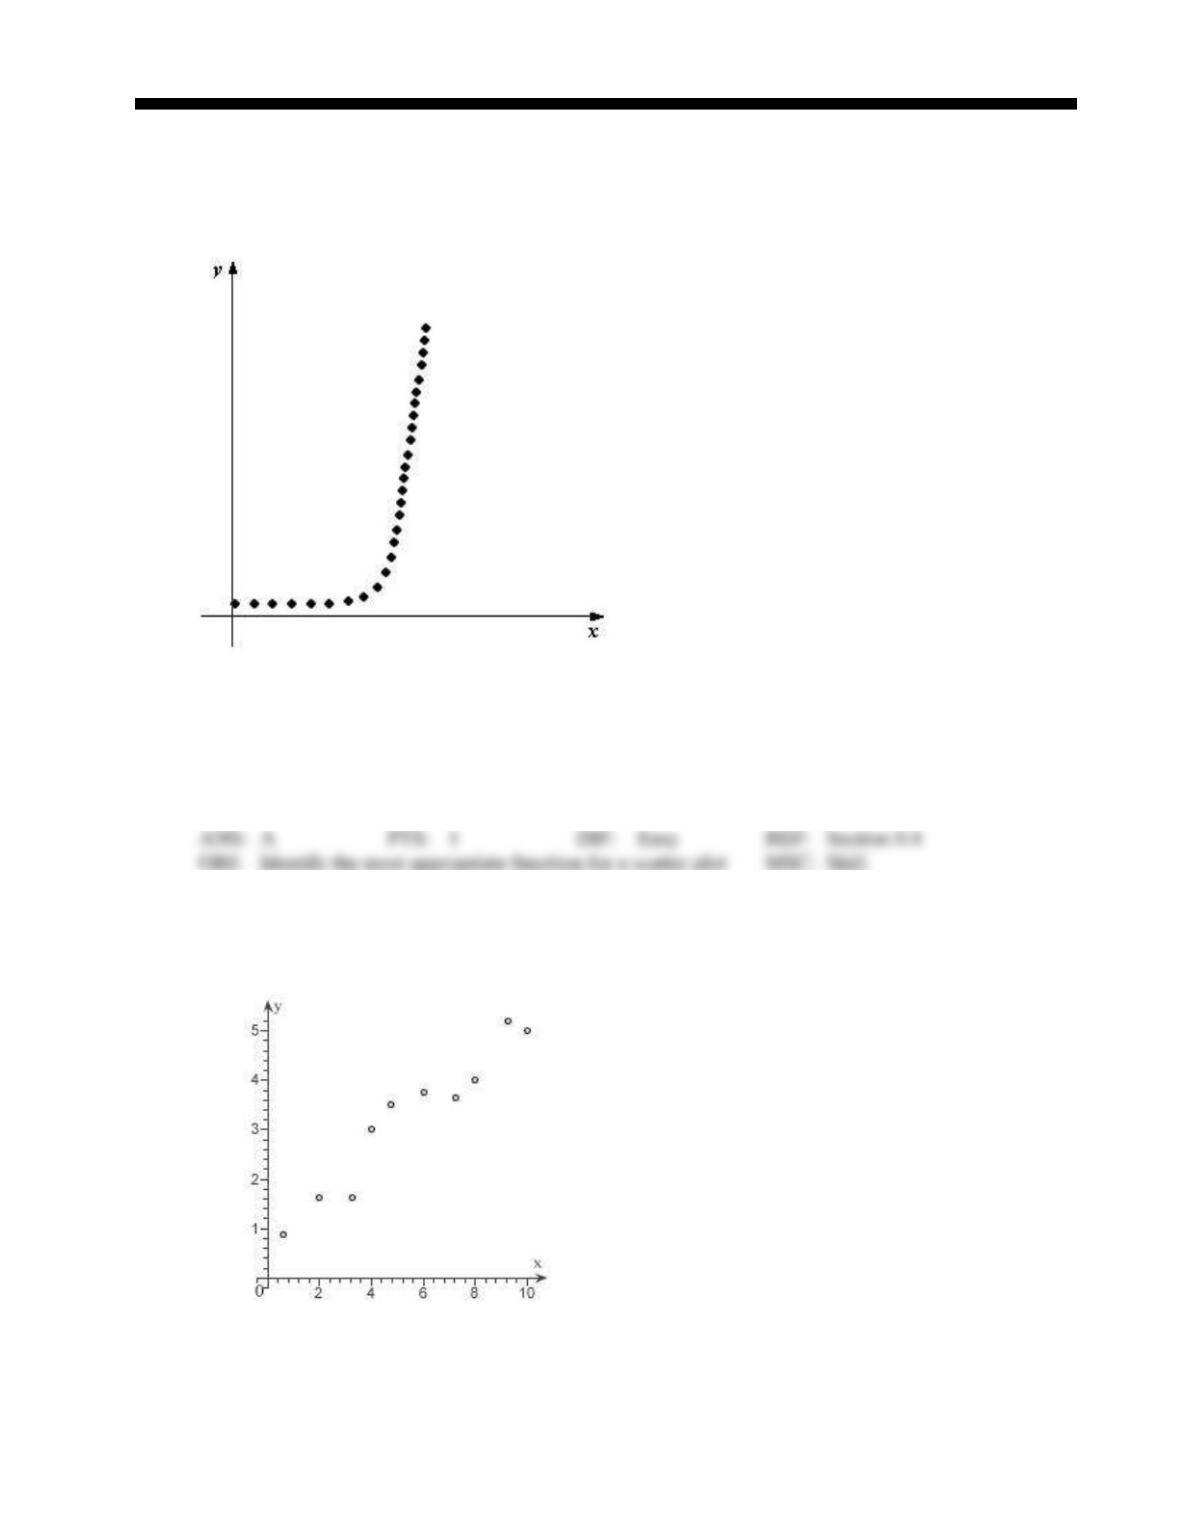
1. Determine which type of function would be most appropriate to fit the given data.
a.
exponential
b.
linear
c.
quadratic
d.
no relationship
e.
trigonometric
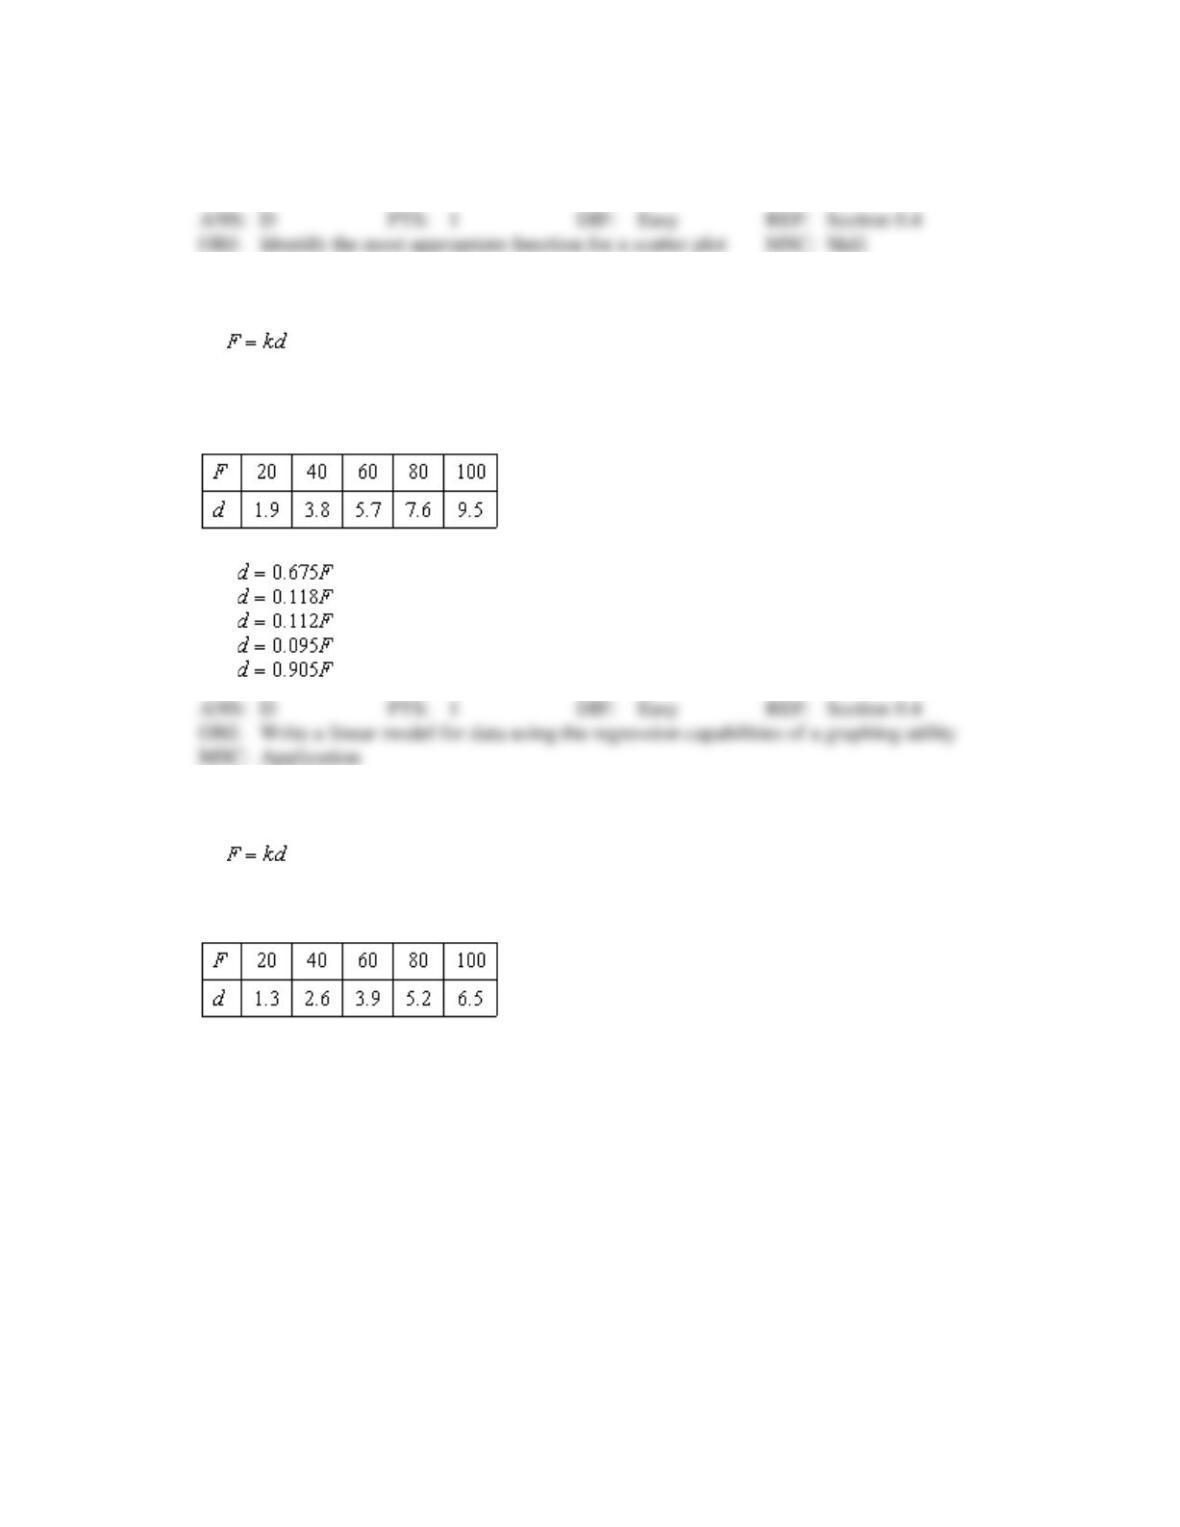
2. Which function below would be most appropriate model for the given data?
a.
no apparent relationship between x and y
b.
trigonometric
c.
quadratic
d.
linear
3. Hooke’s Law states that the force F required to compress or stretch a spring (within its elastic limits) is
proportional to the distance d that the spring is compressed or stretched from its original length. That
is, where k is a measure of the stiffness of the spring and is called the spring constant. The
table shows the elongation d in centimeters of a spring when a force of F newtons is applied. Use the
regression capabilities of a graphing utility to find a linear model for the data. Round the numerical
values in your answer to three decimal places.
a.
b.
c.
d.
e.
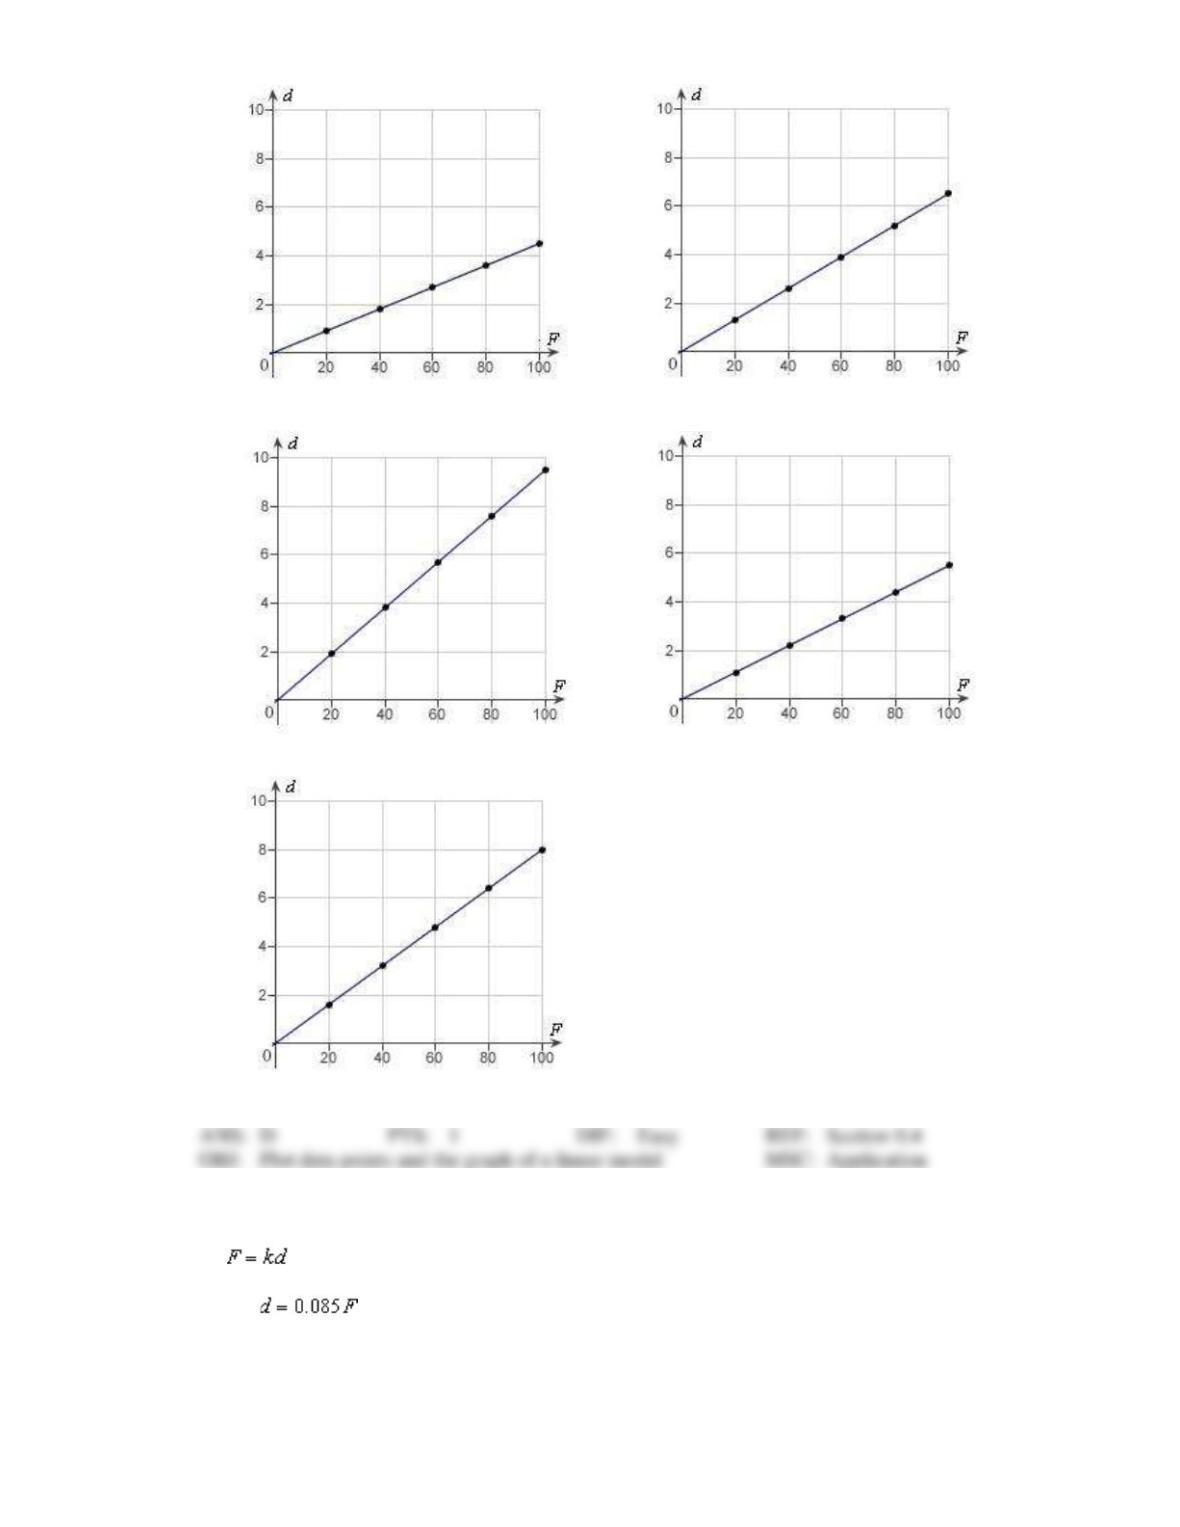
4. Hooke’s Law states that the force F required to compress or stretch a spring (within its elastic limits) is
proportional to the distance d that the spring is compressed or stretched from its original length. That
is, where k is a measure of the stiffness of the spring and is called the spring constant. The
table shows the elongation d in centimeters of a spring when a force of F newtons is applied. Use a
graphing utility to plot the data and graph the linear model.
a.
d.
b.
e.
c.
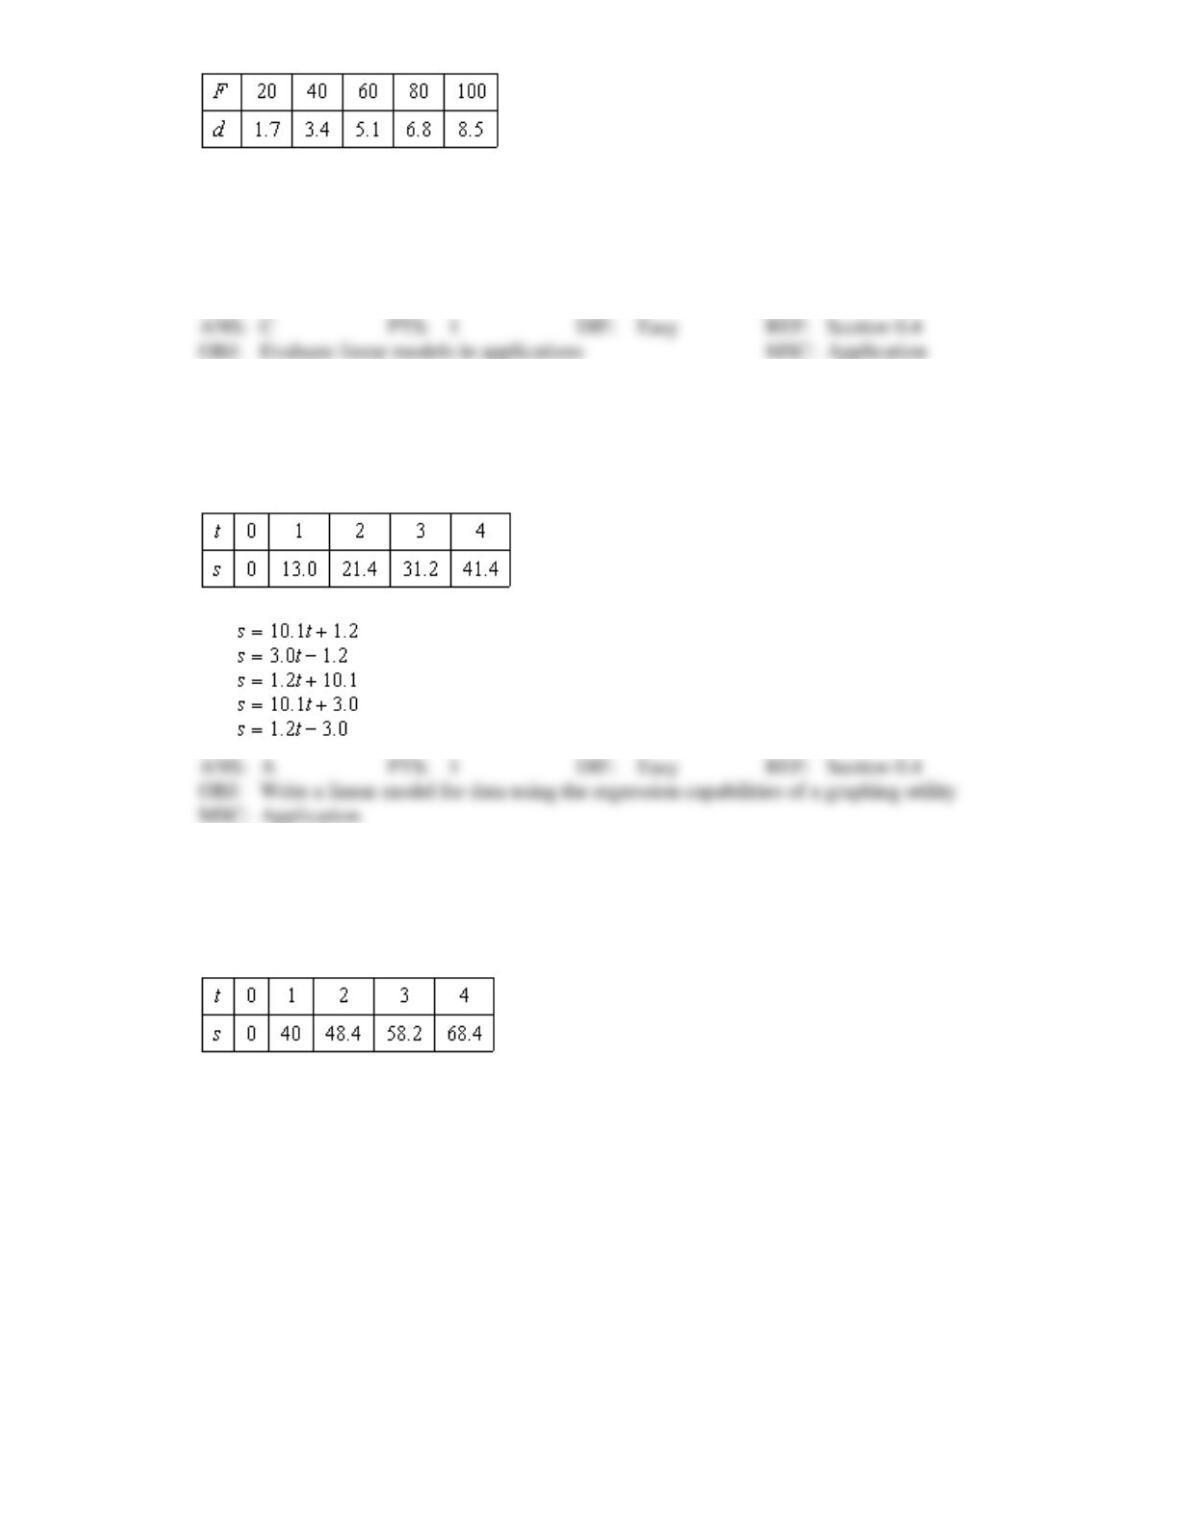
5. Hooke’s Law states that the force F required to compress or stretch a spring (within its elastic limits) is
proportional to the distance d that the spring is compressed or stretched from its original length. That
is, where k is a measure of the stiffness of the spring and is called the spring constant. The
table shows the elongation d in centimeters of a spring when a force of F newtons is applied. Use the
model to estimate the elongation of the spring when a force of 55 newtons is applied.
Round your answer to two decimal places.
a.
8.08 cm
b.
6.38 cm
c.
4.68 cm
d.
2.98 cm
e.
9.78 cm
6. In an experiment, students measured the speed s (in meters per second) of a falling object t seconds
after it was released. The results are shown in the table below. Use the regression capabilities of a
graphing utility to find a linear model for the data. Round all numerical values in your answer to one
decimal place.
a.
b.
c.
d.
e.
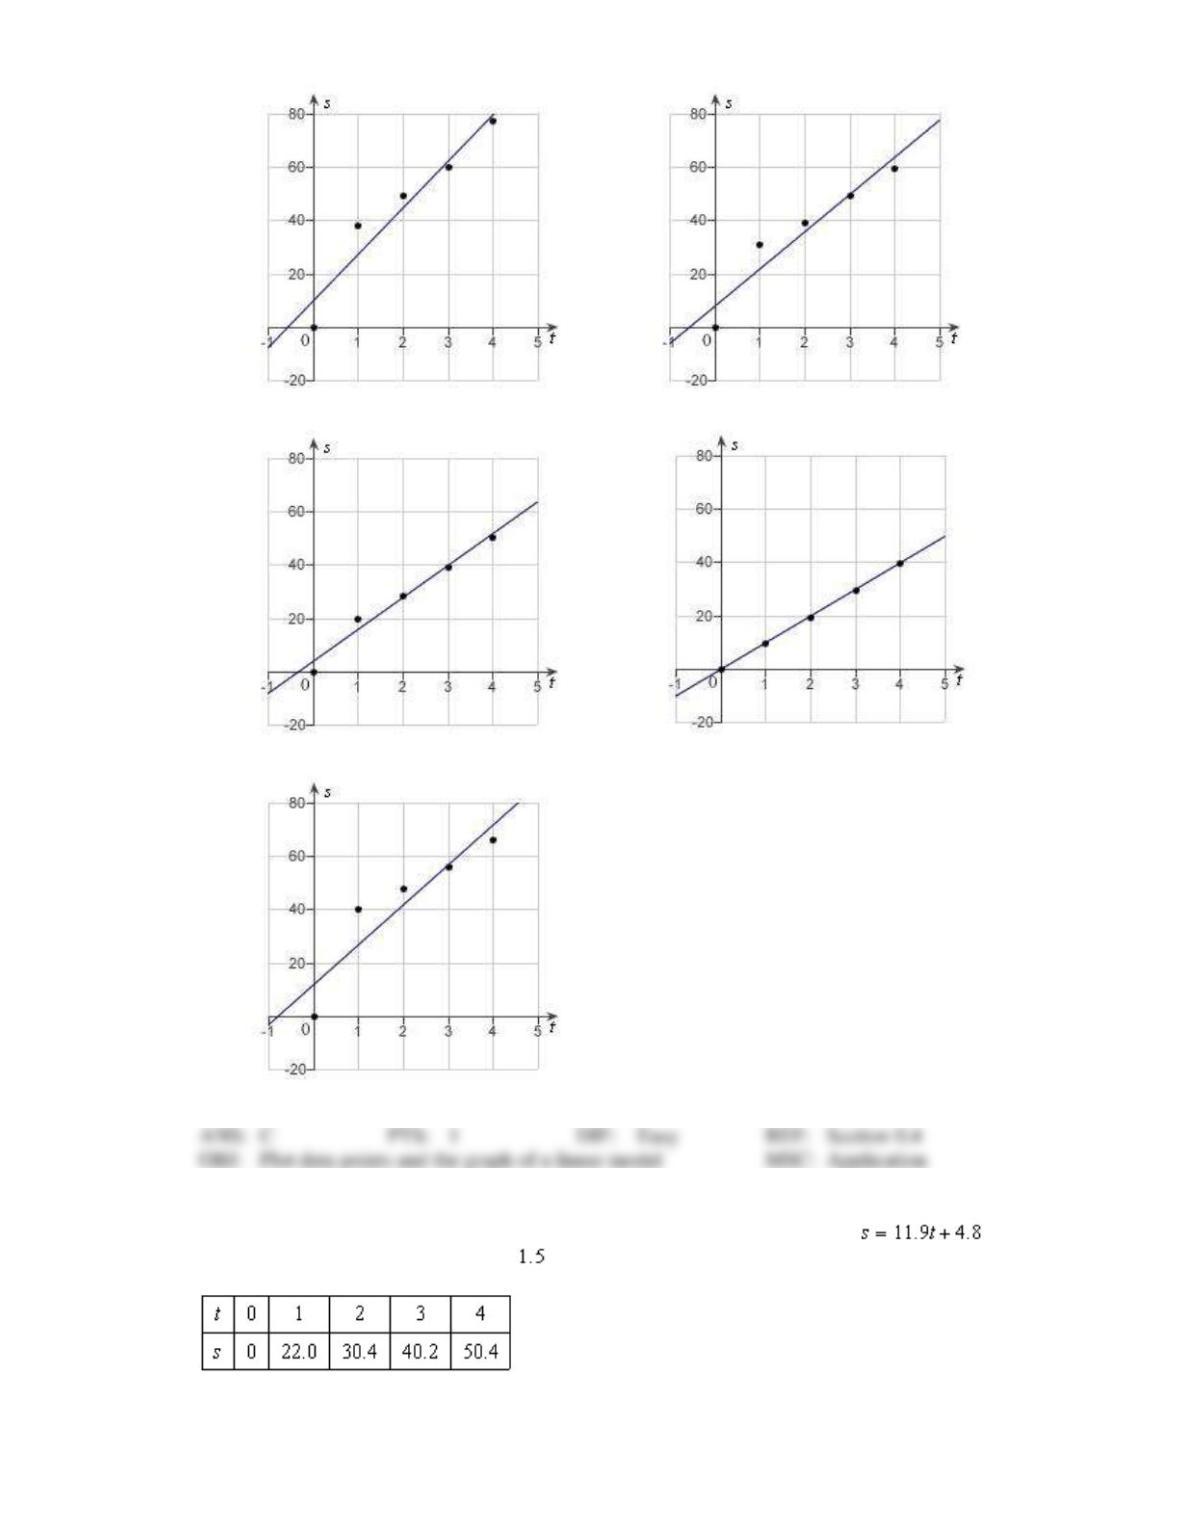
7. In an experiment, students measured the speed s (in meters per second) of a falling object t seconds
after it was released. The results are shown in the table below. Use the regression capabilities of a
graphing utility to find a linear model for the data. Round all numerical values in your answer to one
decimal place.
a.
d.
b.
e.
c.
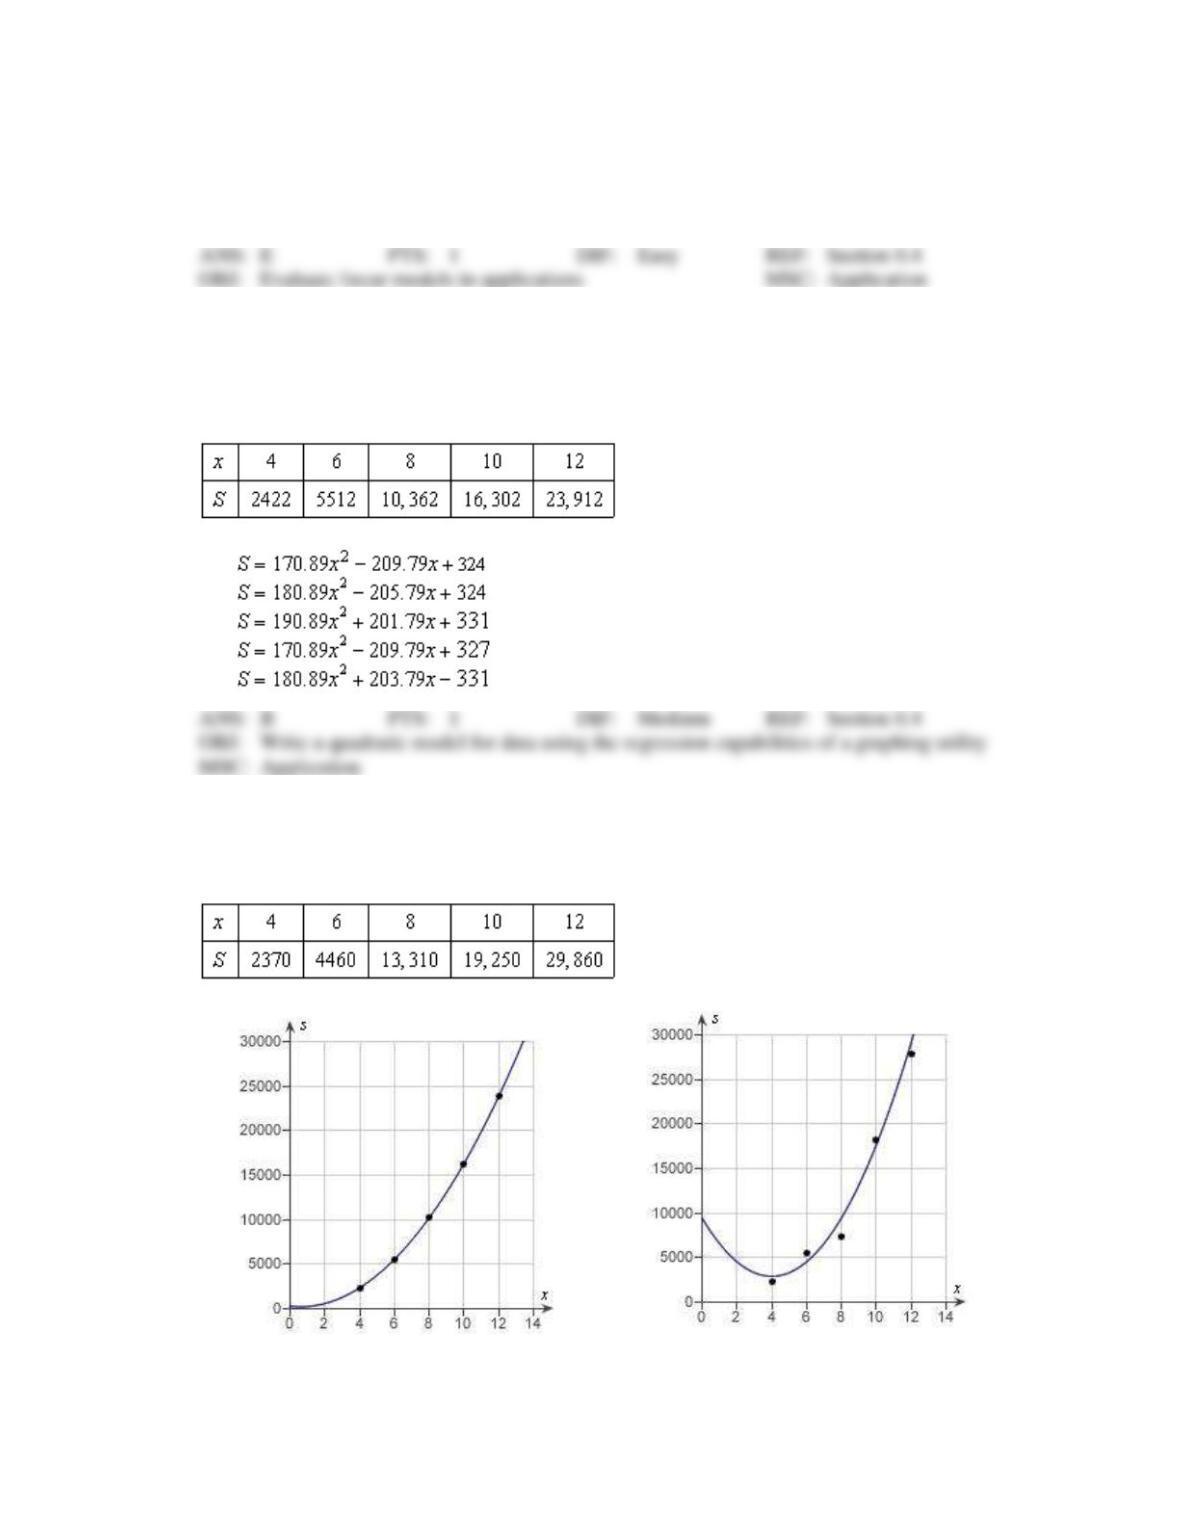
8. In an experiment, students measured the speed s (in meters per second) of a falling object t seconds
after it was released. The results are shown in the table below. Use the model to
estimate the speed of the object after seconds. Round your answer to two decimal places.
a.
21.05 meters/second
b.
20.95 meters/second
c.
24.25 meters/second
d.
23.55 meters/second
e.
22.65 meters/second
9. Students in a lab measured the breaking strength S (in pounds) of wood 2 inches thick, x inches high,
and 12 inches long. The results are shown in the table below. Use the regression capabilities of a
graphing utility to fit a quadratic model to the data. Round the numerical values in your answer to two
decimal places, where applicable.
a.
b.
c.
d.
e.
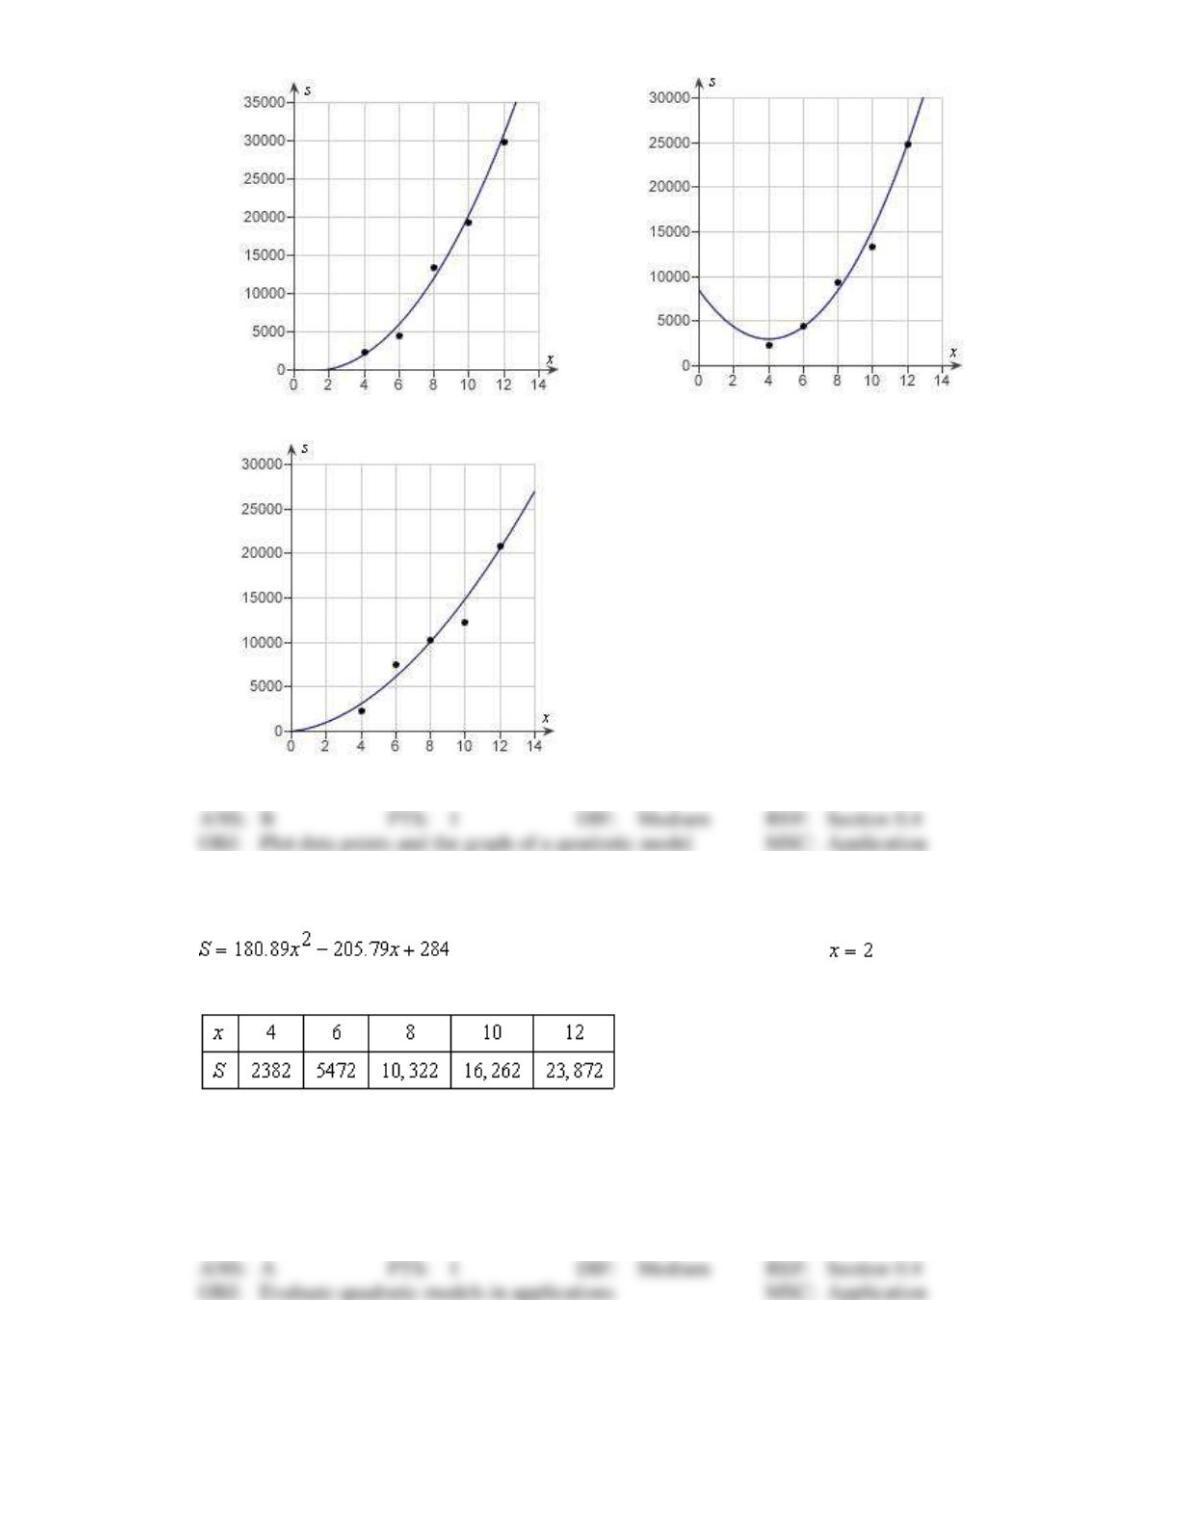
10. Students in a lab measured the breaking strength S (in pounds) of wood 2 inches thick, x inches high,
and 12 inches long. The results are shown in the table below. Use a graphing utility to plot the data and
graph the quadratic model.
a.
d.
b.
e.
c.
11. Students in a lab measured the breaking strength S (in pounds) of wood 2 inches thick, x inches high,
and 12 inches long. The results are shown in the table below. Use the model
to approximate the breaking strength when . Round your answer to
two decimal places.
a.
595.98 pounds
b.
390.19 pounds
c.
957.76 pounds
d.
801.77 pounds
e.
751.97 pounds
12. A V8 car engine is coupled to a dynamometer and the horsepower y is measured at different engine
speeds x (in thousands of revolutions per minute). The results are shown in the table below. Use the
regression capabilities of a graphing utility to find a cubic model for the data. Round the numerical
values in your answer to three decimal places, where applicable.
a.
b.
c.
d.
e.
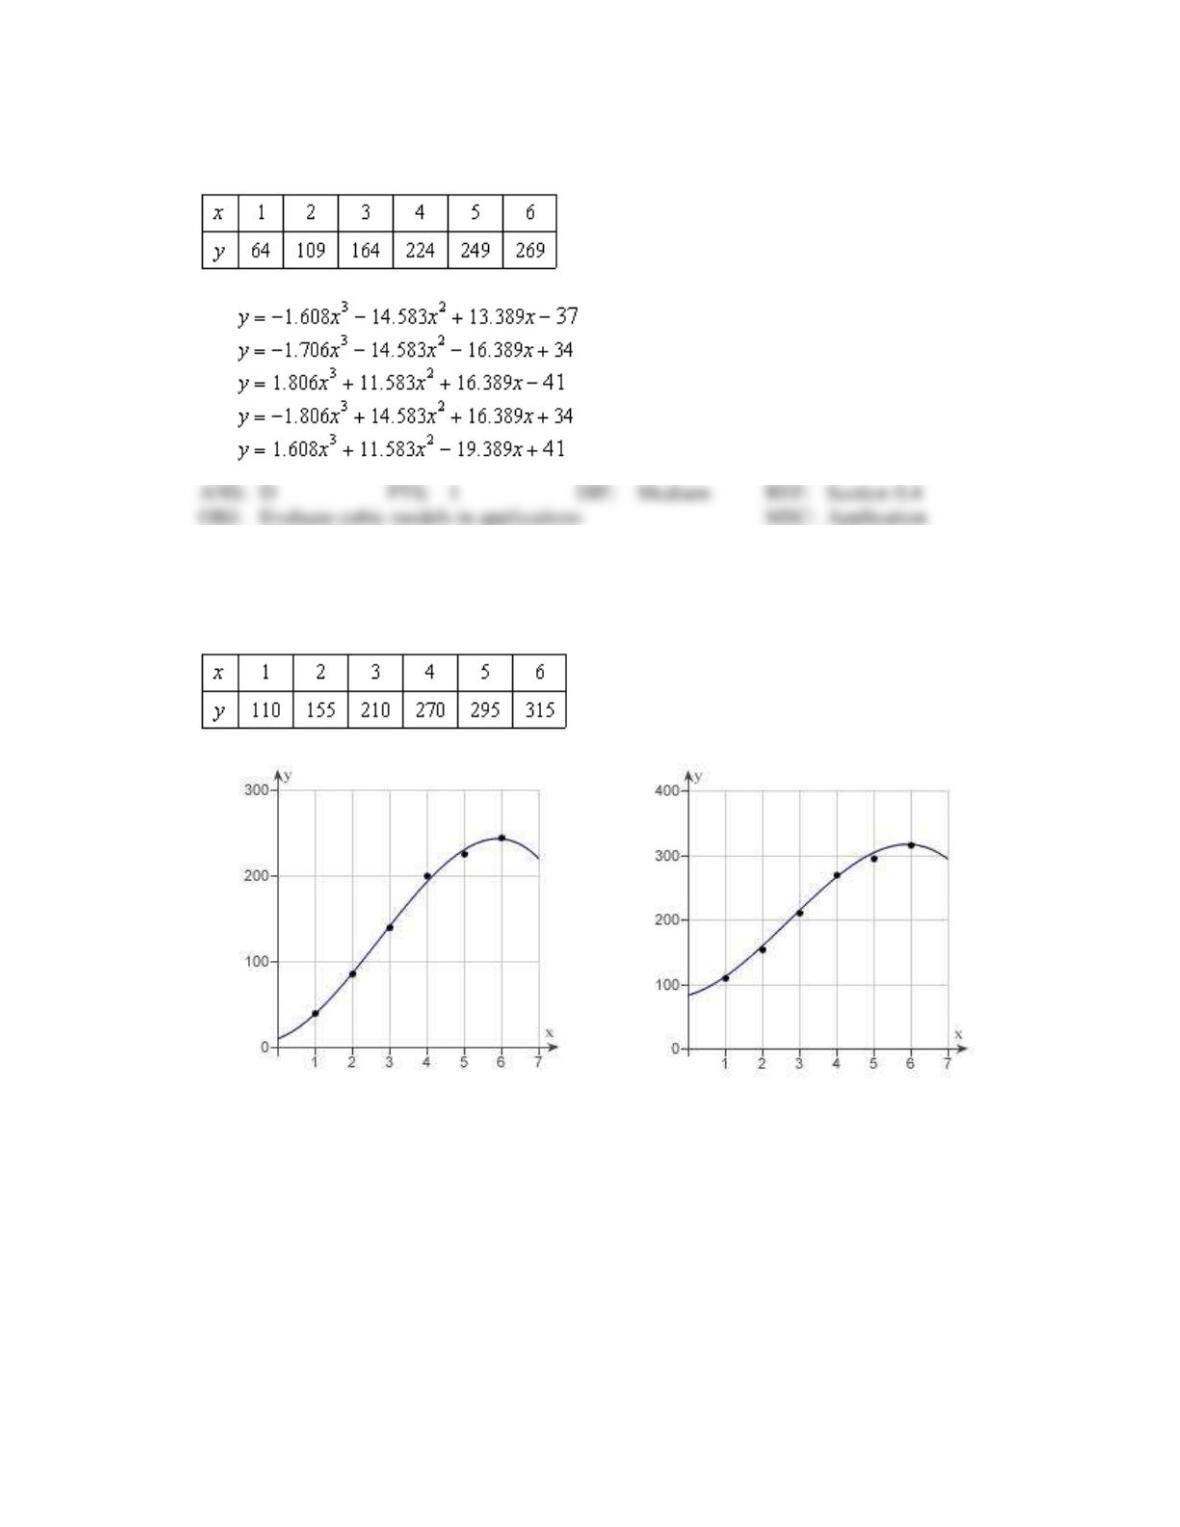
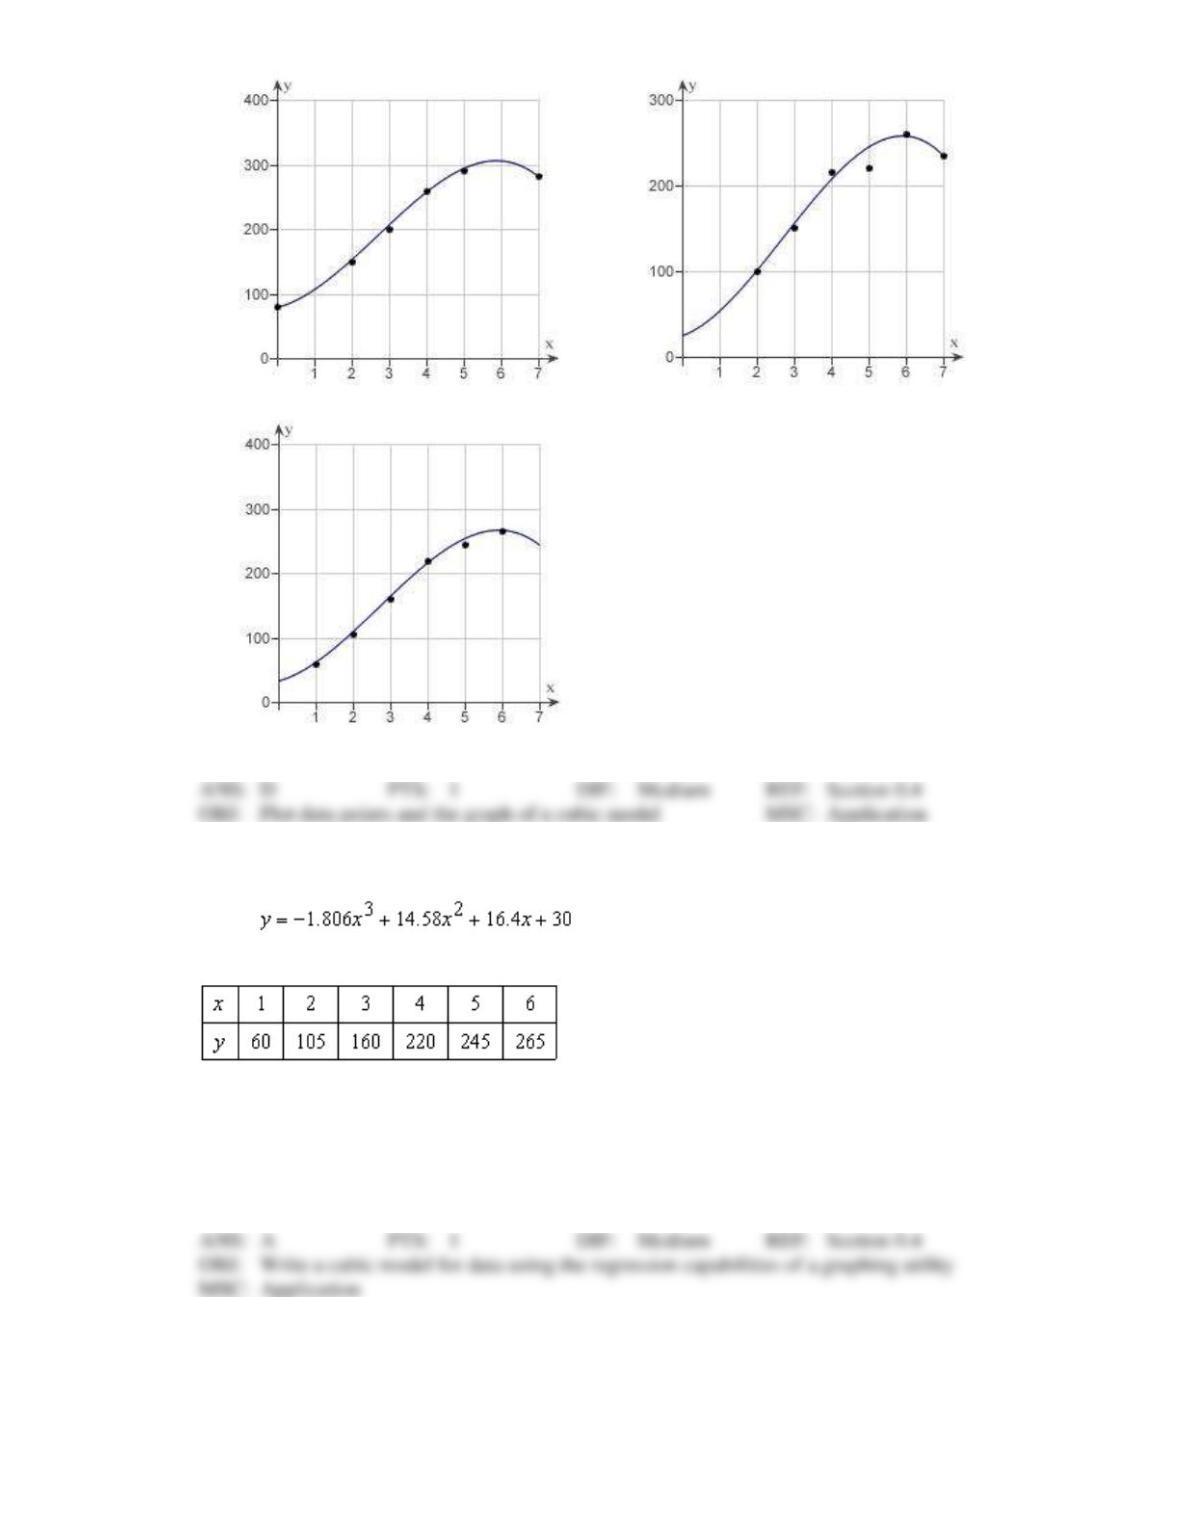
13. A V8 car engine is coupled to a dynamometer and the horsepower y is measured at different engine
speeds x (in thousands of revolutions per minute). The results are shown in the table below. Use a
graphing utility to plot the data and graph the cubic model.
a.
d.
b.
e.
c.
14. A V8 car engine is coupled to a dynamometer and the horsepower y is measured at different engine
speeds x (in thousands of revolutions per minute). The results are shown in the table below. Use the
model to approximate the horsepower when the engine is
running at 5500 revolutions per minute. Round your answer to two decimal places.
a.
260.77 hp
b.
262.73 hp
c.
262.36 hp
d.
261.38 hp
e.
261.91 hp
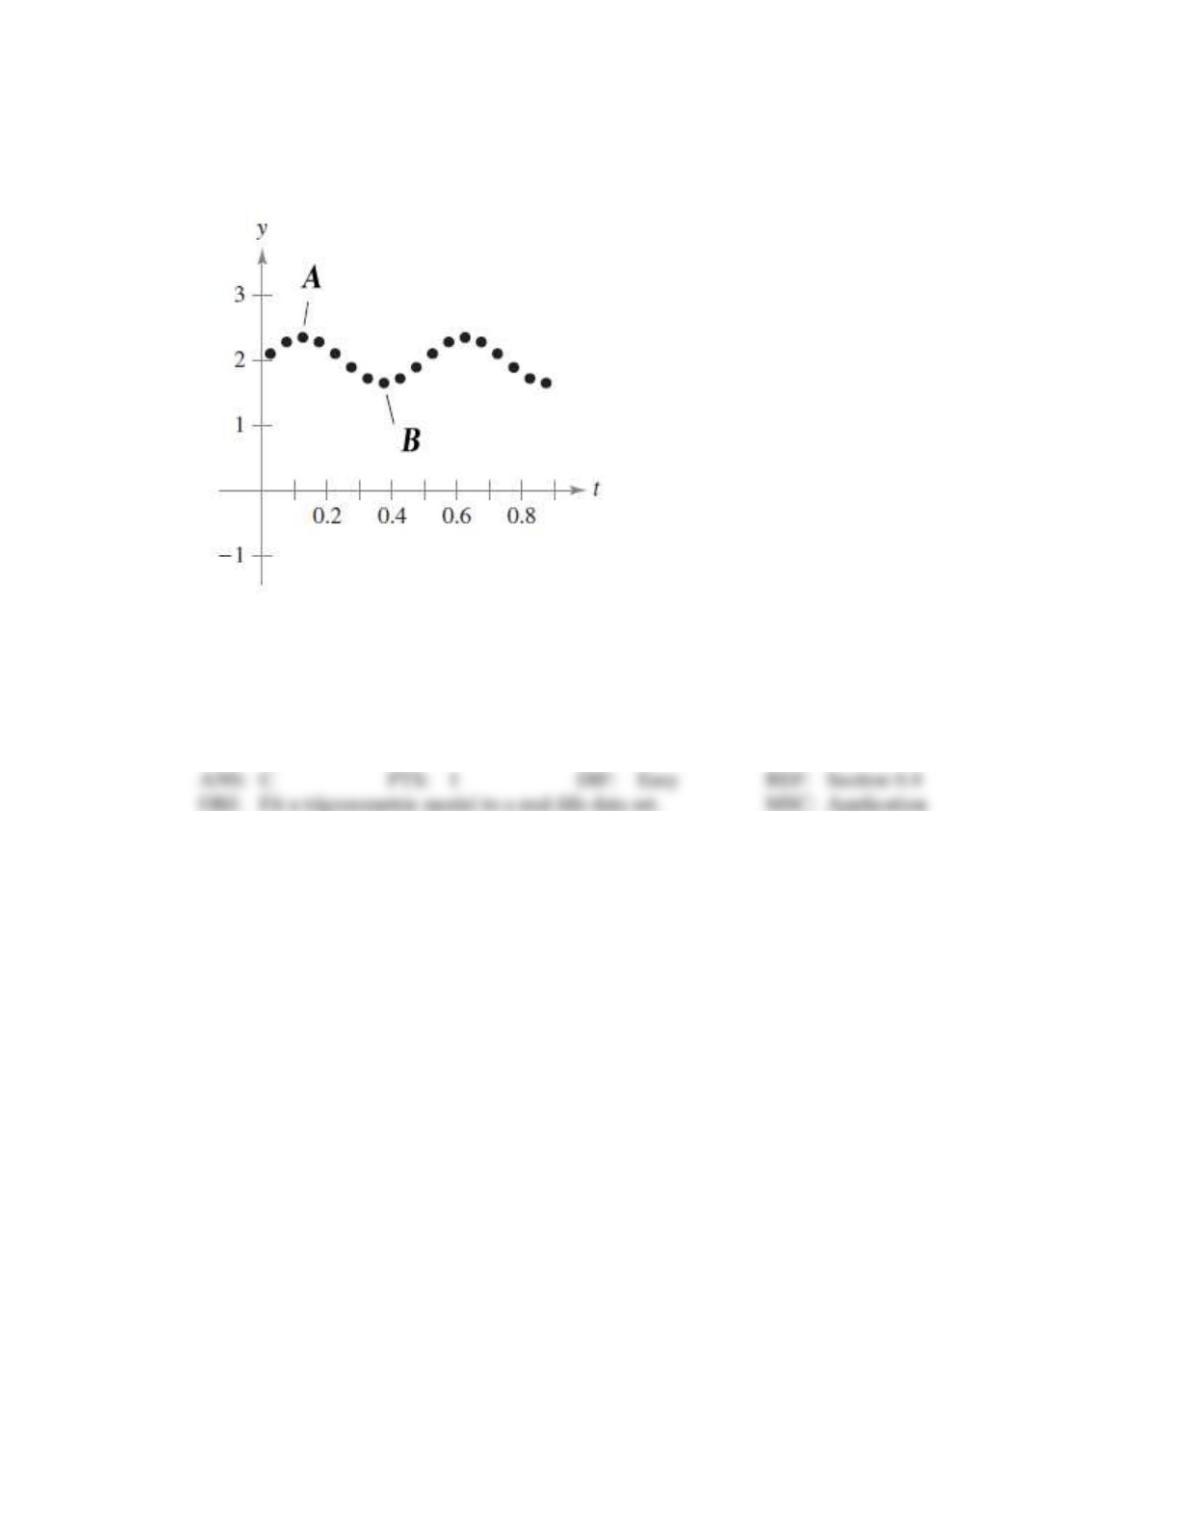
15. The motion of an oscillating weight suspended by a spring was measured by a motion detector. The
data collected and the approximate maximum (positive and negative) displacements from equilibrium
are shown in the figure. The displacement is measured in centimeters, and the time is measured in
seconds. Take A(0.133,2.49) and B(0.343,1.78). Approximate the amplitude and period of the
oscillations.
a.
Amplitude = 0.335. Period = 4.3.
b.
Amplitude = 0.71. Period = 2.1.
c.
Amplitude = 0.355. Period = 4.2.
d.
Amplitude = 4.2. Period = 0.355.
e.
Amplitude = 2.1. Period = 0.71.