Unlock document.
This document is partially blurred.
Unlock all pages and 1 million more documents.
Get Access

Which of the following is true with regard to a good decision?
a. It ensures that good outcomes will be obtained
b. It accounts for unlucky outcomes
c. It should be independent of the sequencing of uncertainties and decisions
d. It should incorporate all information about uncertainties and alternatives
e. All of these options
Which of the following summary measures for forecast errors does not depend on the
units of the forecast variable?
a. MAE (mean absolute error)
b. MFE (mean forecast error)
c. RMSE (root mean square error)
d. MAPE (mean absolute percentage error)
Utility functions are mathematical functions that transform monetary values " payoffs
and costs " into ________________.
a. expected values

b. utility values
c. EMV values
d. anchor values
e. None of the above
NARRBEGIN: SA_107_108
A company must meet (on time) the following demands: quarter 1, 3000 units; quarter
2, 2000 units; quarter 3, 4000 units. Each quarter, up to 2700 units can be produced
with regular-time labor, at a cost of $40 per unit. During each quarter, an unlimited
number of units can be produced with overtime labor, at a cost of $60 per unit. Of all
units produced, 20% are unsuitable and cannot be used to meet demand. Also, at the
end of each quarter, 10% of all units on hand spoil and cannot be use used to meet any
future demands. After each quarter's demand is satisfied and spoilage is accounted for, a
cost of $15 per unit is assessed against the quarter's ending inventory.
NARREND
(A) Determine how to minimize the total cost of meeting the next 3 quarters' demand.
Assume that 1000 usable units are available at the beginning of quarter 1.
(B) Referring to (A), the company wants to know how much money it would be worth
to decrease the percentage of unsuitable items and/or the percentage of items that spoil.
Write a short report that provides relevant information. Base your report on two uses of
the SolverTable add-in: one where the percentage of unsuitable items decreases and the
percentage of items that spoil stays at 10%; and one where the percentage of unsuitable
items stays at 20% and the percentage of items that spoil decreases.
Sampling error is evident when:
a. a question is poorly worded
b. the sample is too small
c. the sample is not random
d. the sample mean differs from the population mean
NARRBEGIN: SA_67_68
A sample of 9 production managers with over 15 years of experience has an average
salary of $71,000 and a sample standard deviation of $18,000.
NARREND
(A) You can be 95% confident that the mean salary for all production managers with at
least 15 years of experience is between what two numbers (the t-multiple with 8
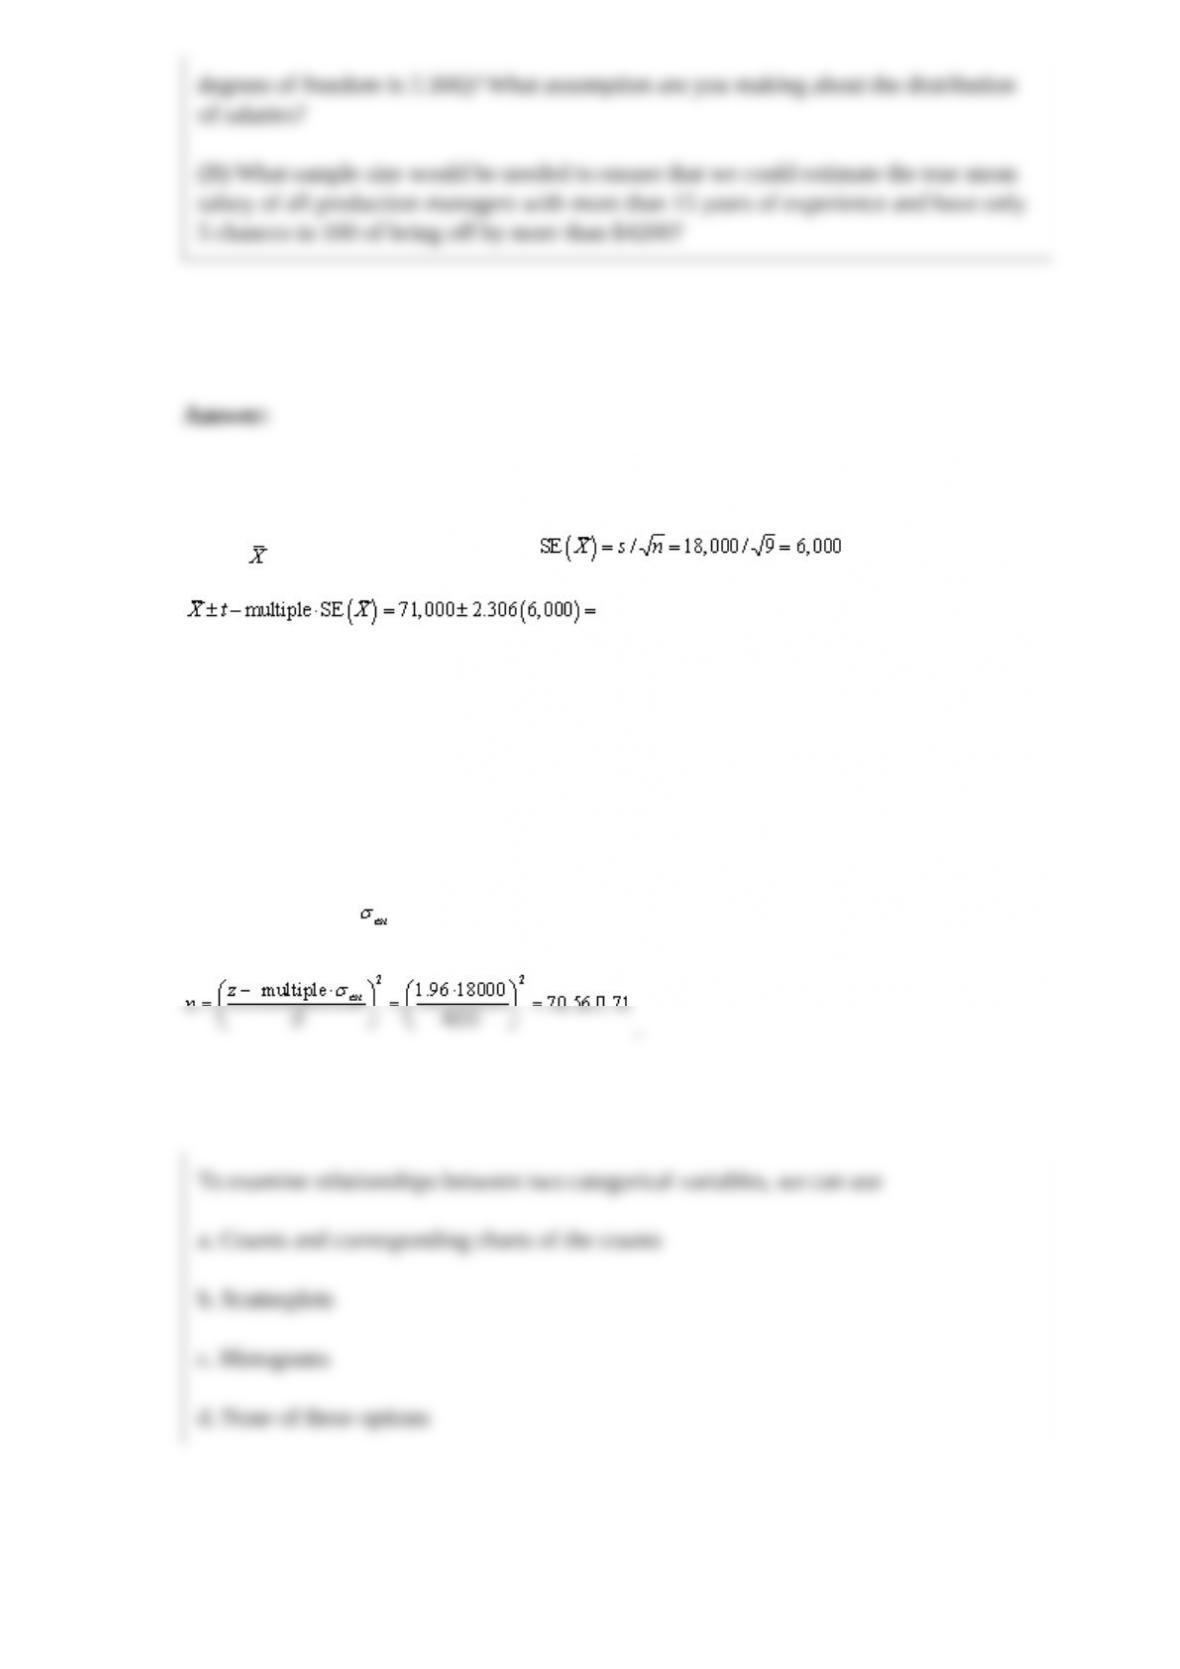
degrees of freedom is 2.306)? What assumption are you making about the distribution
of salaries?
(B) What sample size would be needed to ensure that we could estimate the true mean
salary of all production managers with more than 15 years of experience and have only
5 chances in 100 of being off by more than $4200?
To examine relationships between two categorical variables, we can use
a. Counts and corresponding charts of the counts
b. Scatterplots
c. Histograms
d. None of these options
If you can determine that the outlier is not really a member of the relevant population,
then it is appropriate and probably best to:
a. average it
b. reduce it
c. delete it
d. leave it
Which of the following statements is (are) false regarding the numbers generated by the
RAND function in Excel?
a. Approximately 10% of the numbers will be between 0.0 and 1.0
b. Approximately 20% of the numbers will be between 0.50 and 0.70
c. Approximately 40% of the numbers will be between 0.20 and 0.60
d. Approximately 60% of the numbers will be between 0.15 and 0.75
e. All of these options are false
A negative relationship between an explanatory variable X and a response variable Y
means that as X increases, Y decreases, and vice versa.
Linear programming models have three important properties. They are:
a. optimality, additivity and sensitivity
b. optimality, linearity and divisibility
c. divisibility, linearity and nonnegativity
d. proportionality, additivity and divisibility
Which of the following statements is true regarding the Triangular distribution?
a. It is a discrete distribution with a minimum, maximum and most likely value
b. It is more flexible and intuitive than the normal distribution
c. It is a symmetric distribution
d. All of these options
It is simple to generate a uniformly distributed random number with a minimum and
maximum other than 0 and 1. For example, the formula =150+100 RAND() generates
a number uniformly distributed between
a. 100 and 150
b. 150 and 250
c. 50 and 100
d. 50 and 250
The moving average method can also be referred to as a (n) _____ method.
a. causal
b. smoothing
c. exponential
d. econometric
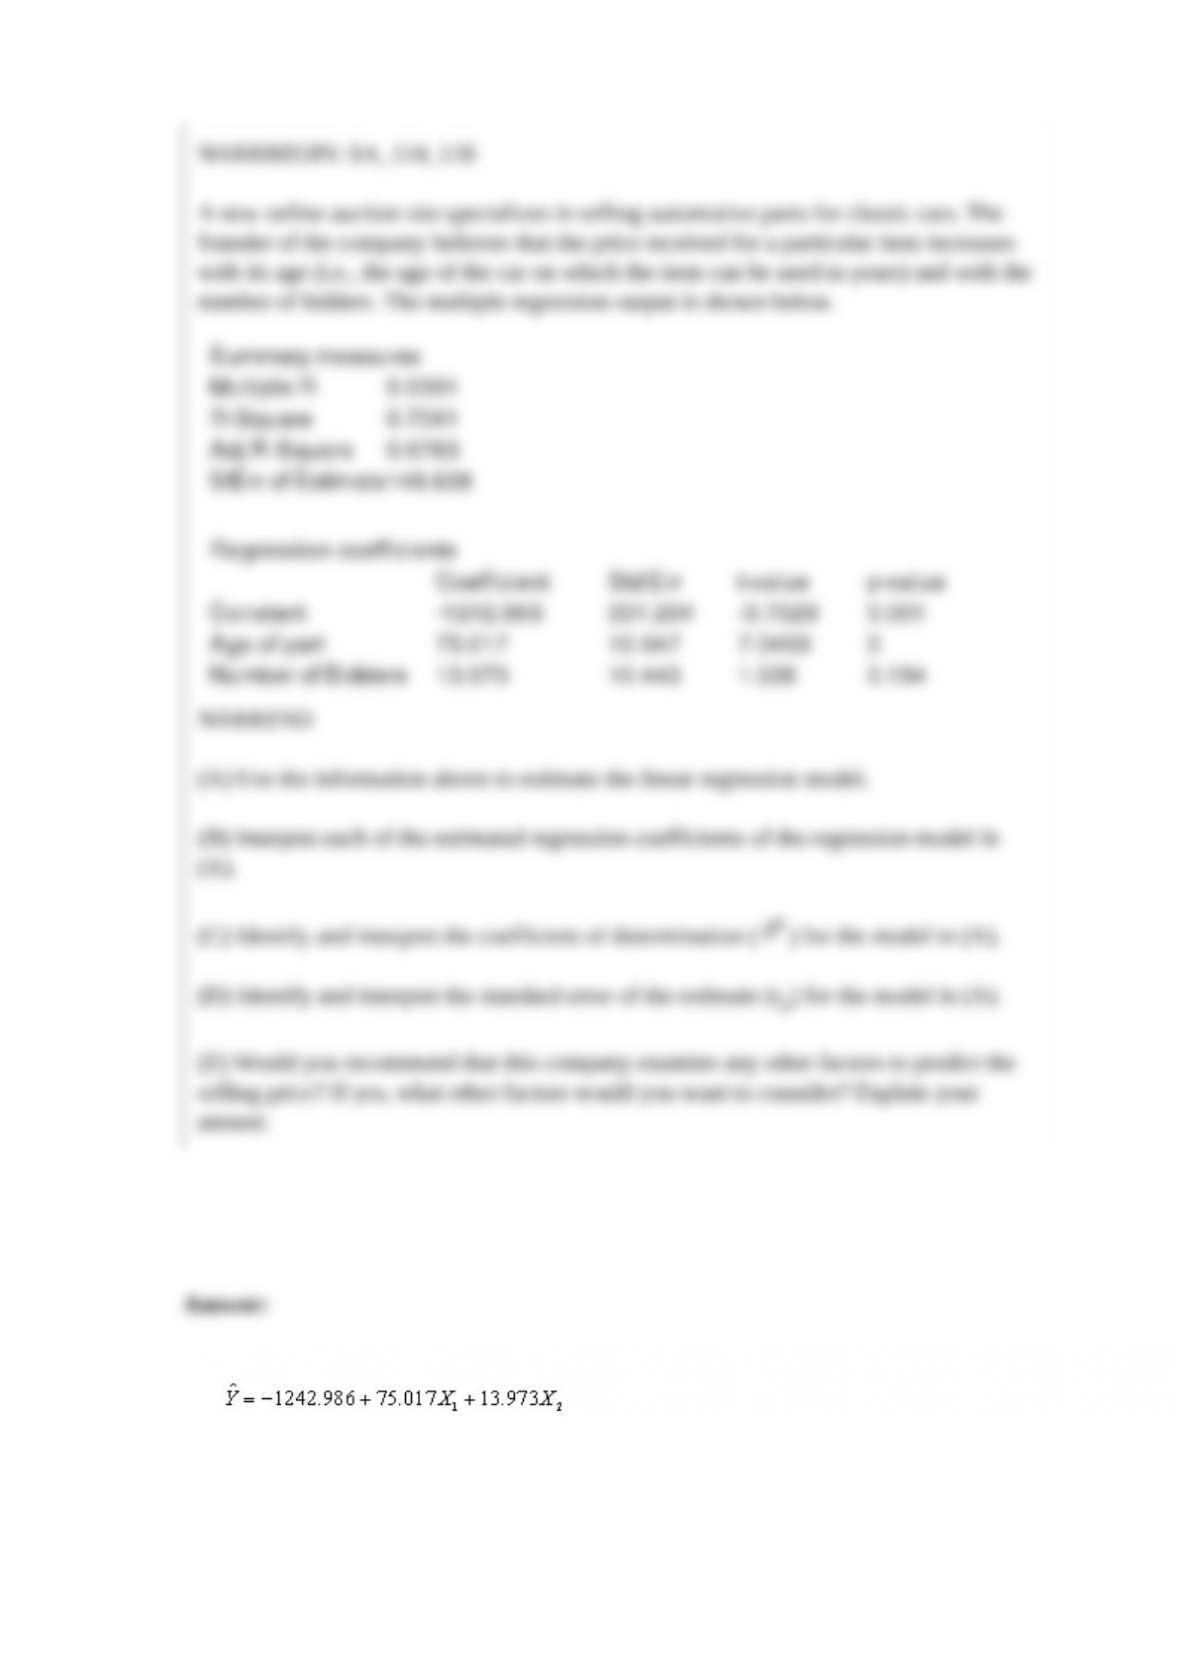
NARRBEGIN: SA_124_128
A new online auction site specializes in selling automotive parts for classic cars. The
founder of the company believes that the price received for a particular item increases
with its age (i.e., the age of the car on which the item can be used in years) and with the
number of bidders. The multiple regression output is shown below.
NARREND
(A) Use the information above to estimate the linear regression model.
(B) Interpret each of the estimated regression coefficients of the regression model in
(A).
(C) Identify and interpret the coefficient of determination ( ) for the model in (A).
(D) Identify and interpret the standard error of the estimate (se) for the model in (A).
(E) Would you recommend that this company examine any other factors to predict the
selling price? If yes, what other factors would you want to consider? Explain your
answer.
Outliers are observations that
a. lie outside the sample
b. render the study useless
c. lie outside the typical pattern of points on a scatterplot
d. disrupt the entire linear trend
Which of the following is not among the financial applications where simulation can be
applied?
a. Future stock prices
b. Customer preferences for different attributes of products
c. Future interest rates
d. Future cash flows
e. None of these options
Which of the following statements correctly describe estimation?
a. It is the process of inferring the values of known population parameters from those of
unknown sample statistics.
b. It is the process of inferring the values of unknown sample statistics from those of
known population parameters.
c. It is the process of inferring the values of known sample statistics from those of
unknown population parameters.
d. It is the process of inferring the values of unknown population parameters from those
of known sample statistics.
NARRBEGIN: SA_119_121
A large regional department store is evaluating the effectiveness of its credit card
program, which costs it approximately $1m per year to administer. The store believes
that for the credit card program to be worthwhile, the administrative costs should be no
more than 10% of the total of the average annual account balances. Rather than
reviewing each of the 15,000 individual accounts, the store's analysts randomly selected
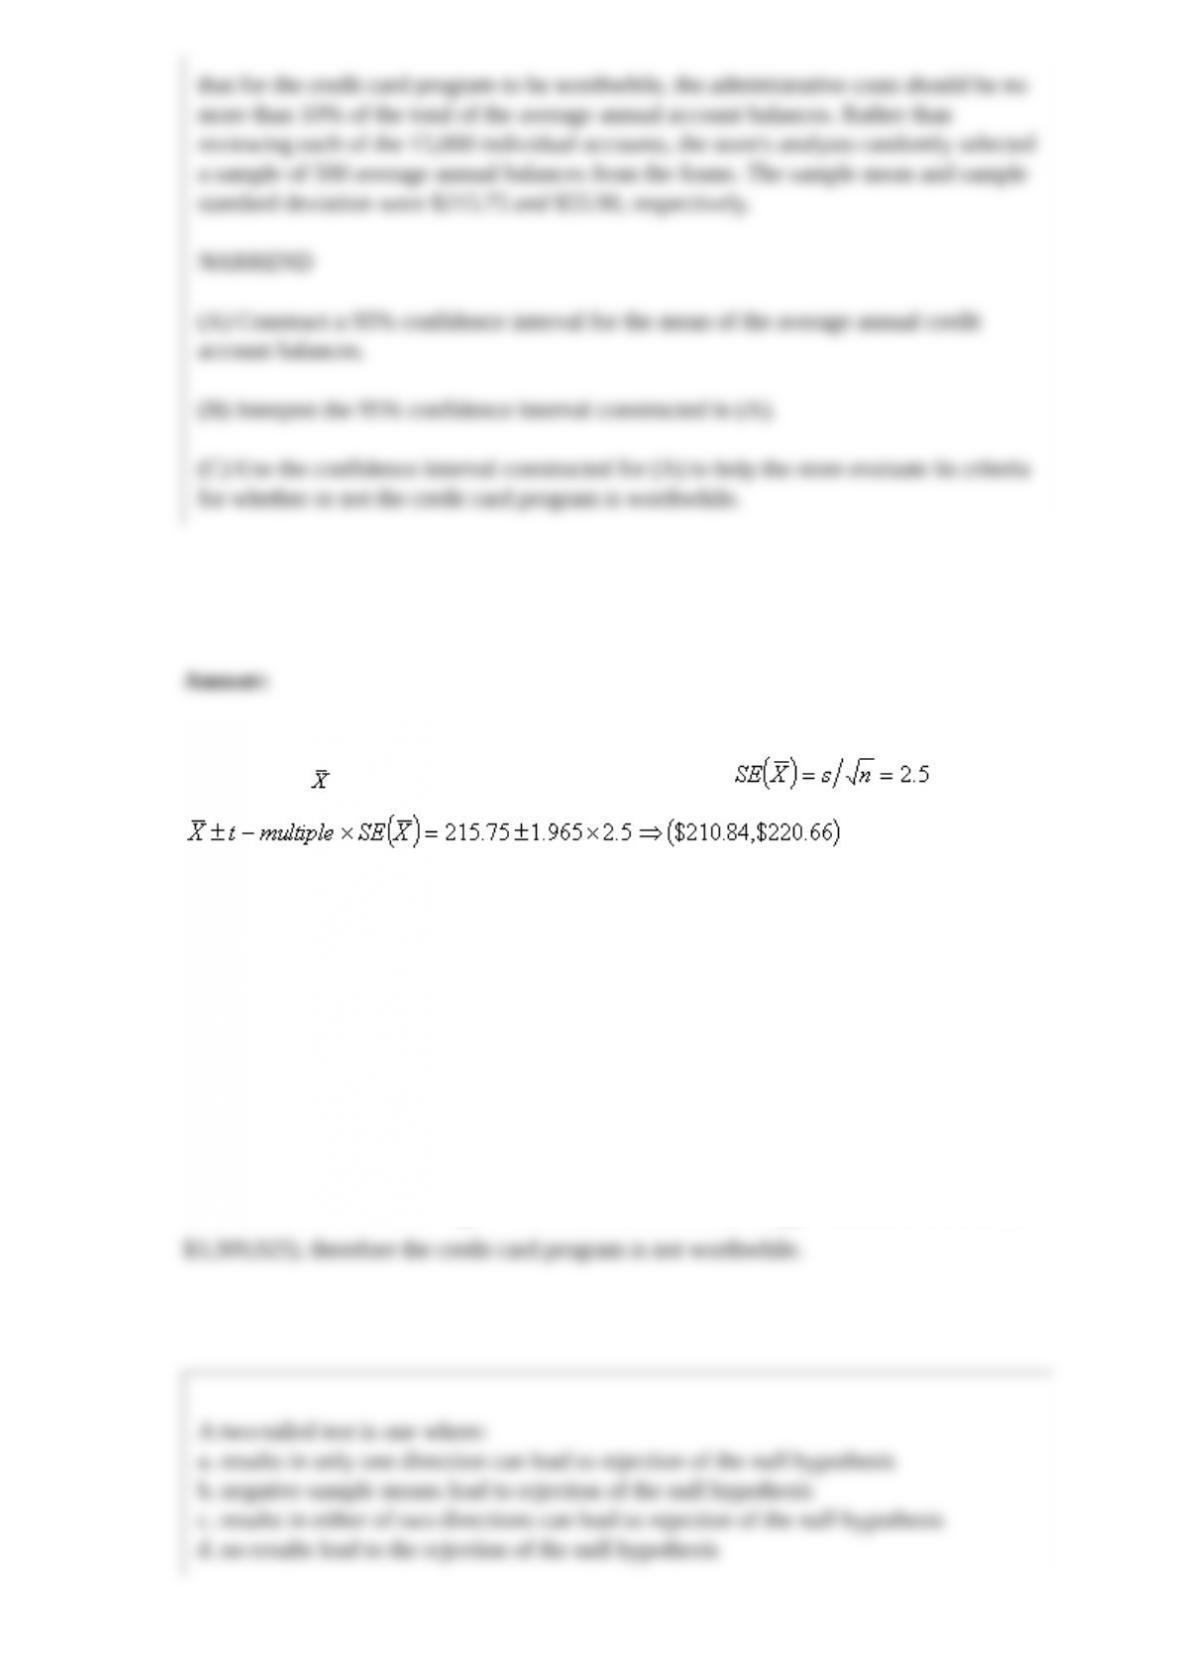
a sample of 500 average annual balances from the frame. The sample mean and sample
standard deviation were $215.75 and $55.90, respectively.
NARREND
(A) Construct a 95% confidence interval for the mean of the average annual credit
account balances.
(B) Interpret the 95% confidence interval constructed in (A).
(C) Use the confidence interval constructed for (A) to help the store evaluate its criteria
for whether or not the credit card program is worthwhile.
A two-tailed test is one where:
a. results in only one direction can lead to rejection of the null hypothesis
b. negative sample means lead to rejection of the null hypothesis
c. results in either of two directions can lead to rejection of the null hypothesis
d. no results lead to the rejection of the null hypothesis
If two events are collectively exhaustive, what is the probability that both occur at the
same time?
a. 0.00
b. 0.50
c. 1.00
d. Cannot be determined from the information given.
NARRBEGIN: SA_103_113
The owner of a large chain of health spas has selected eight of her smaller clubs for a
test in which she varies the size of the newspaper ad , and the amount of the
initiation fee discount to see how this might affect the number of prospective
members who visit each club during the following week. The results are shown in the
table below:
The results of a multiple regression analysis are below.
NARREND
(A) Determine the least-squares multiple regression equation.
(B) Interpret the Y- intercept of the regression equation.
(C) Interpret the partial regression coefficients.
(D) What is the estimated number of new visitors to a club if the size of the ad is 6
column-inches and a $100 discount is offered?
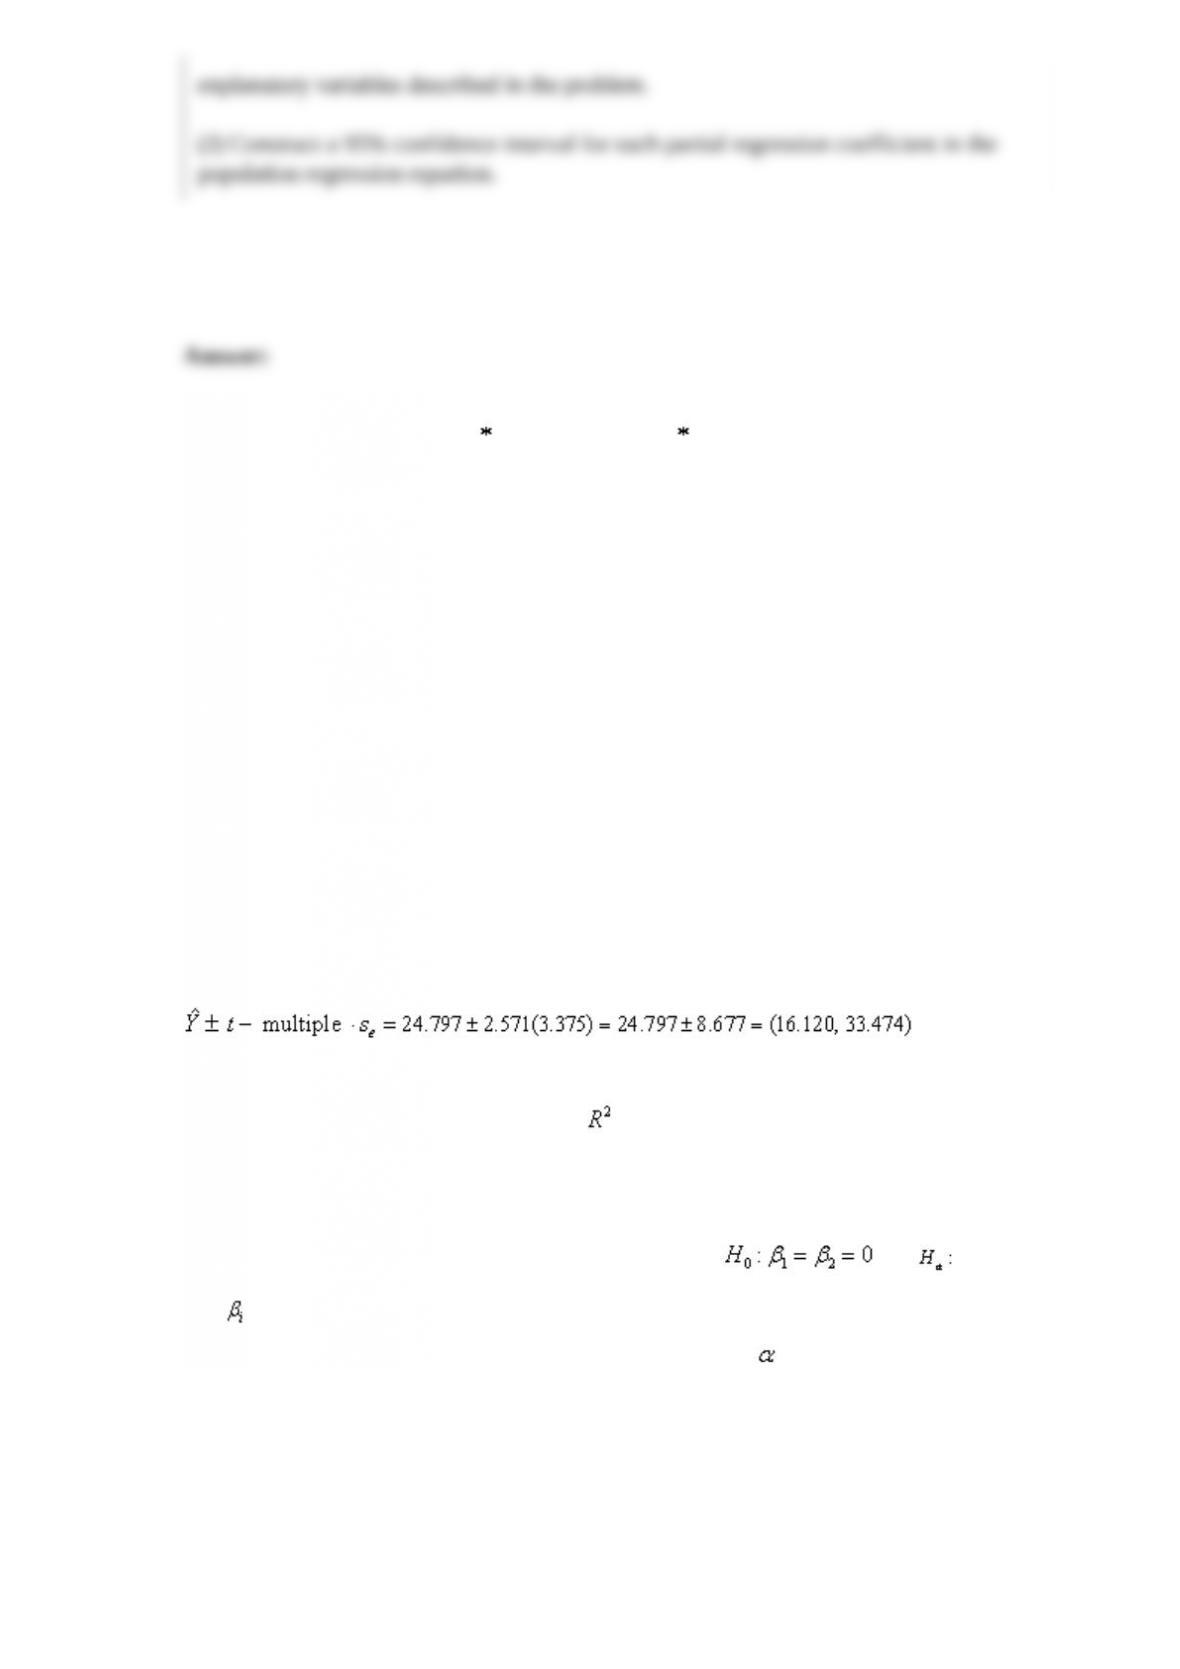
(E) Determine the approximate 95% prediction interval for the number of new visitors
to a given club when the ad is 5 column-inches and the discount is $80.
(F) What is the value for the percentage of variation explained, and exactly what does it
indicate?
(G) At the 0.05 level, is the overall regression equation in (A) significant?
(H) Use the 0.05 level in concluding whether each partial regression coefficient differs
significantly from zero.
(I Interpret the results of the preceding tests in (H) and (I) in the context of the two
explanatory variables described in the problem.
(J) Construct a 95% confidence interval for each partial regression coefficient in the
population regression equation.
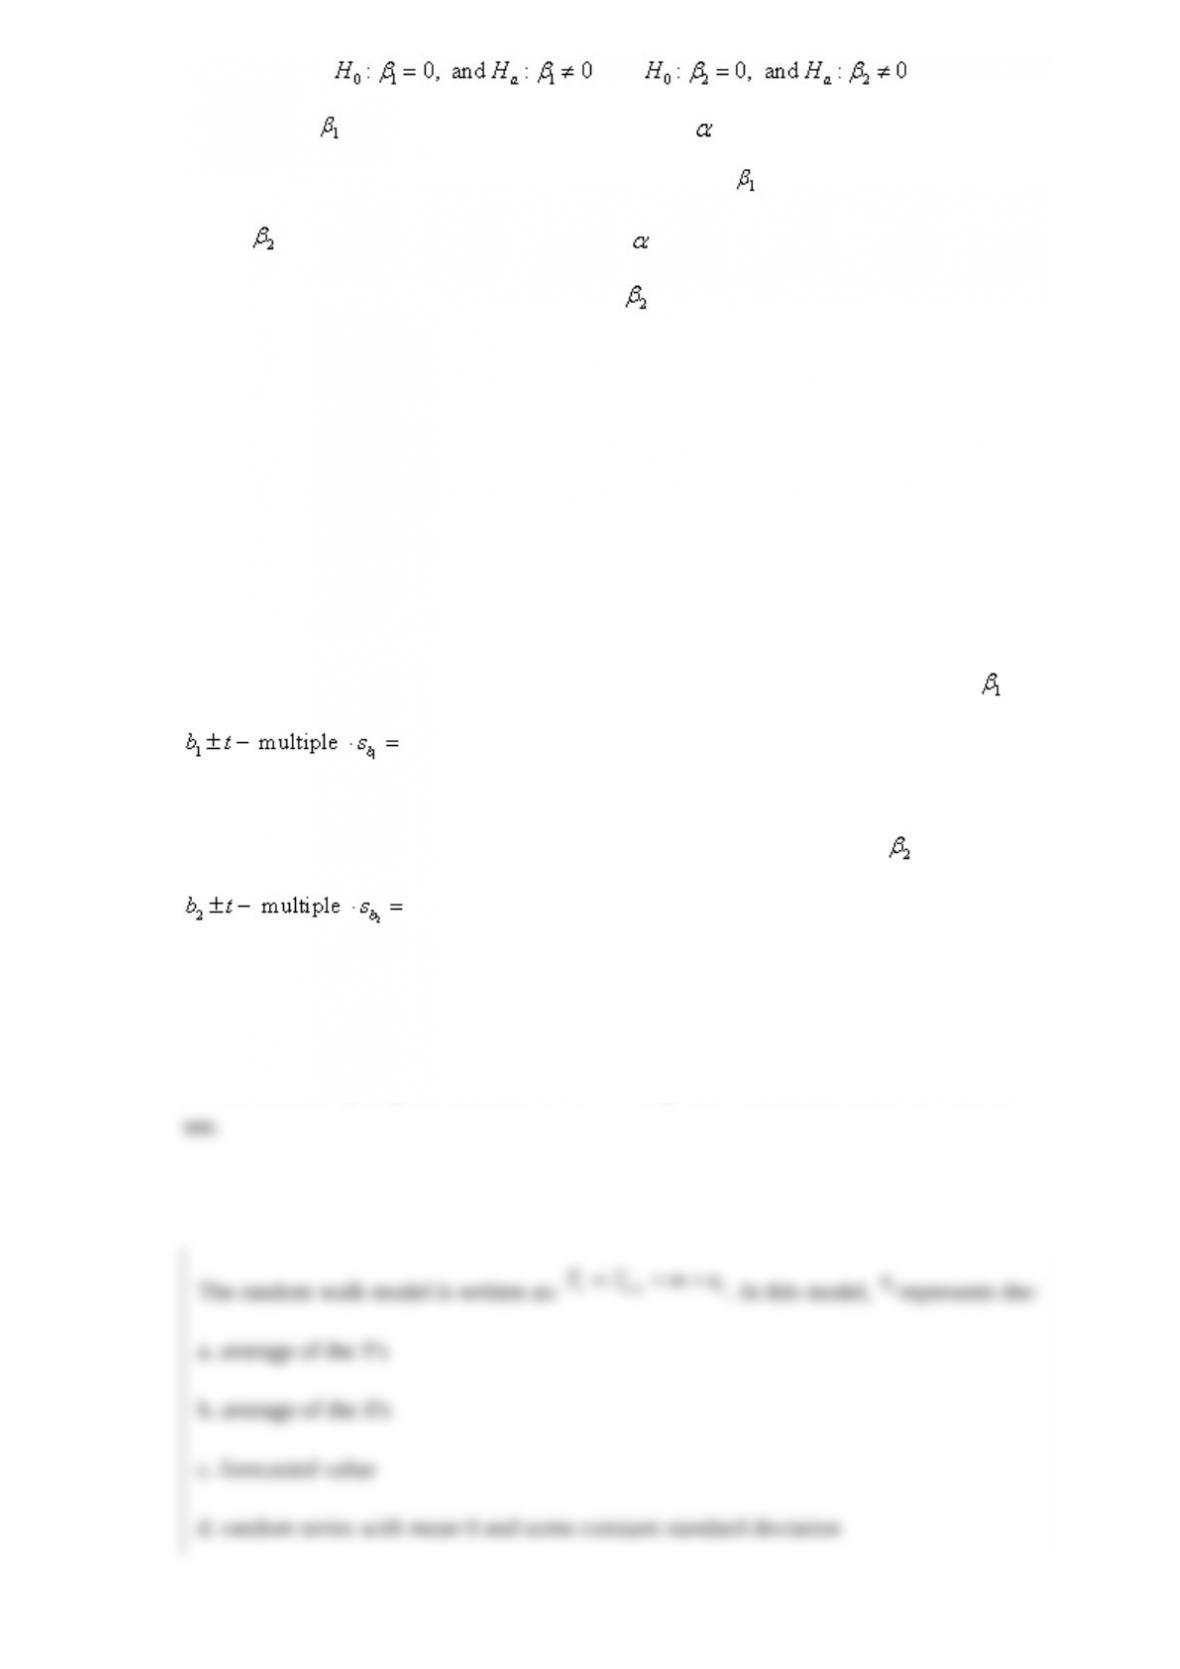
The random walk model is written as: . In this model, represents the:
a. average of the Y's
b. average of the X's
c. forecasted value
d. random series with mean 0 and some constant standard deviation
Which of these sensitivity analysis charts is most useful in determining whether the
optimal decision changes over the range of the input variable?
a. Strategy region chart
b. Tornado chart
c. Spider chart
d. All of these options
e. None of these options
In multiple regression, the coefficients reflect the expected change in:
a. Y when the associated X value increases by one unit
b. X when the associated Y value increases by one unit
c. Y when the associated X value decreases by one unit
d. X when the associated Y value decreases by one unit
The divisibility property of linear programming means that a solution can have both:
a. integer and noninteger levels of an activity
b. linear and nonlinear relationships
c. positive and negative values
d. revenue and cost information in the model
The law of large numbers is relevant to the estimation of
a. objective probabilities
b. subjective probabilities
c. both of these options
d. neither of these options
Which of the following is typically not an application of simulation models?
a. Operations models
b. Financial models
c. Marketing models
d. Value of Information models
e. None of these options
The chi-square distribution for developing a confidence interval for a standard deviation
has_____ degrees of freedom.
a. n + 2
b. n +1
c. n
d. n " 1
e. n - 2
The standard deviation of a probability distribution is a:
a. measure of variability of the distribution
b. measure of central location
c. measure of relative likelihood
d. measure of skewness of the distribution
The objective in transportation problems is typically to:
a. maximize profits
b. maximize revenue
c. minimize costs
d. maximize feasibility
The law of large numbers states that subjective probabilities can be estimated based on
the long run relative frequencies of events
NARRBEGIN: SA_79_90
The service manager for a new appliances store reviewed sales records of the past 20
sales of new microwaves to determine the number of warranty repairs he will be called
on to perform in the next 90 days. Corporate reports indicate that the probability any
one of their new microwaves needs a warranty repair in the first 90 days is 0.05. The
manager assumes that calls for warranty repair are independent of one another and is
interested in predicting the number of warranty repairs he will be called on to perform
in the next 90 days for this batch of 20 new microwaves sold.
NARREND
What is the probability that more than one of the 20 new microwaves sold will require a
warranty repair in the first 90 days?
In time series data, errors are often not probabilistically independent.
When we make inferences from data and search for relationships in data, or when we
use decision trees to help make decisions, we must deal with uncertainty.
The primary objective in simulation models of bidding for contracts is to determine the
optimal bid.
NARRBEGIN: SA_76_78
A set of final exam scores in an organic chemistry course was found to be normally
distributed, with a mean of 73 and a standard deviation of 8.
NARREND What percentage of students scored between 81 and 89 on this exam?
NARRBEGIN: SA_87_90
Sinclair Plastics operates two chemical plants which produce polyethylene; the Ohio
Valley plant which produces 5000 tons per month and the Lakeview plant which can
produce 7000 tons per month. Sinclair sells its polyethylene to three different GM auto
plants, Grand Rapids (demand = 3000 tons per month), Blue Ridge (demand = 5000
tons per month), and Sunset (demand = 4000 tons per month). The costs of shipping
between the respective plants is shown in the table below:
NARREND
What is the optimal shipping plan? What are the total costs in that case?
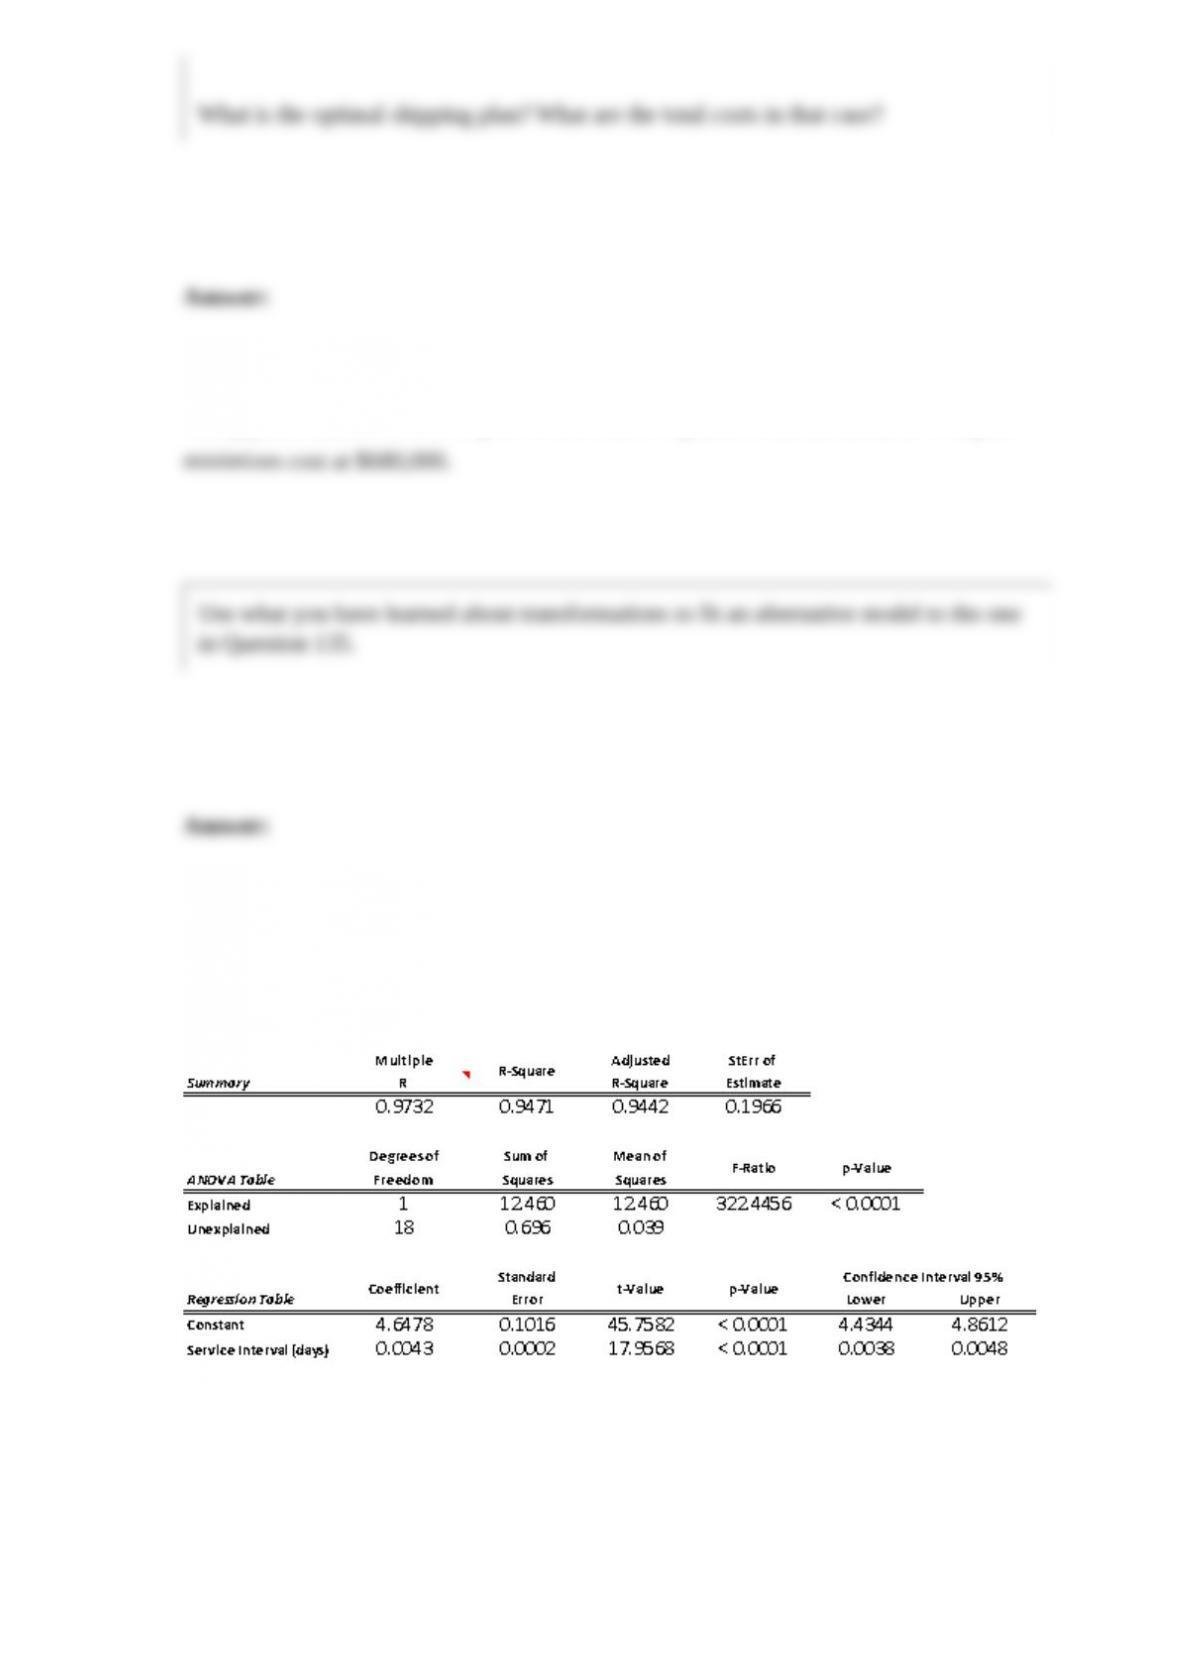
Use what you have learned about transformations to fit an alternative model to the one
in Question 135.
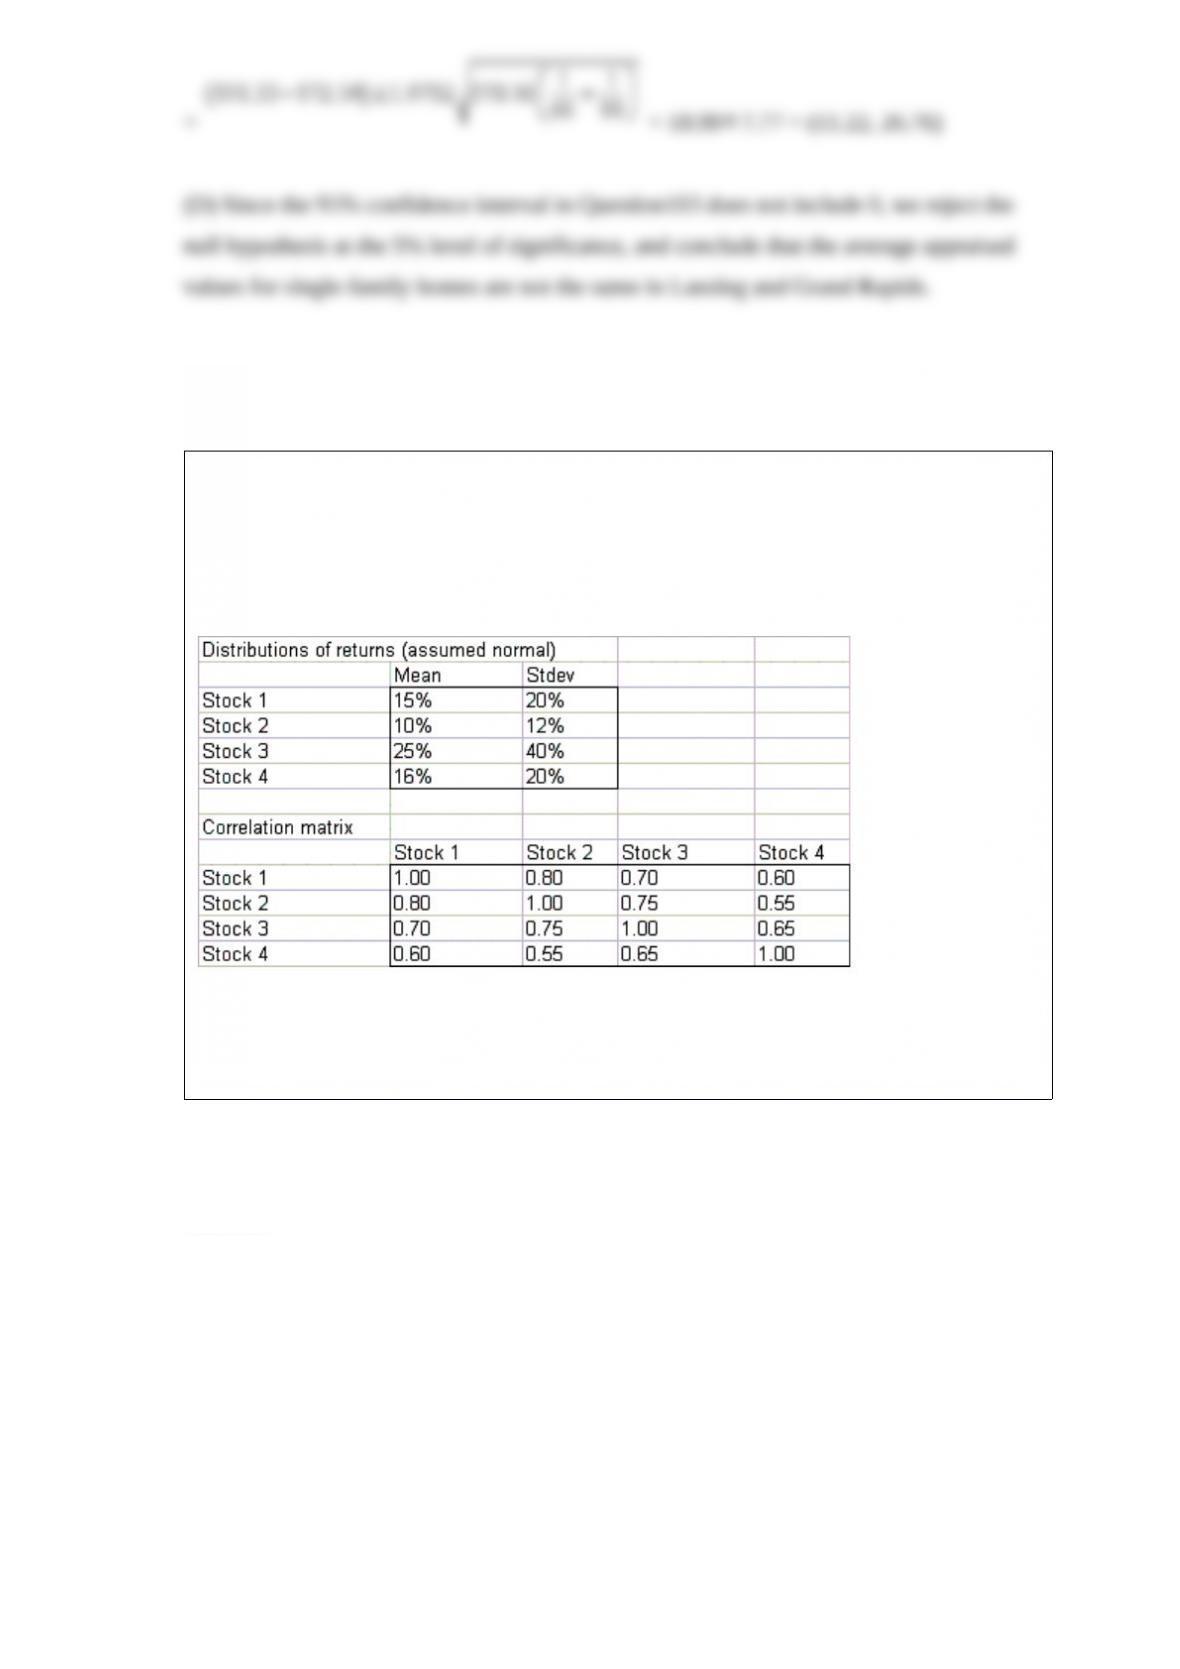
NARRBEGIN: SA_92_93
Suppose you have invested 25% of your portfolio in four different stocks. The mean
and standard deviation of the annual return on each stock are as shown below. The
correlations between the annual returns on the four stocks are also shown below.
NARREND
What is the probability that your portfolio's annual return will exceed 20%?

Obtain a residual plot vs. Service Interval. Does this affect your opinion of the validity
of the model in Question 135?

NARRBEGIN: SA_95_96
ABC sells refrigerators. Any refrigerator that fails before it is 3 years old is replaced for
free. Of all refrigerators, 2% fail during their first year of operation; 4% of all
1-year-old refrigerators fail during their second year of operation; and 8% of all
2-year-old refrigerators fail during their third year of operation. It costs ABC $500 to
replace a refrigerator, and ABC sells 6,000 refrigerators per year.
NARREND
If the warranty period were reduced to 2 years, how much per year in replacement costs
would be saved?

Dealing with uncertainty includes measuring uncertainty and modeling uncertainty
explicitly into the analysis.
Correlation between two random input variables might not change the mean of an
output, but it can definitely affect the variability and shape of an output disbribution.
A @RISK output range allows us to obtain a summary chart that shows the entire
simulated range at once.

The difference between the largest and smallest values in a data set is called the range.


