
NARRBEGIN: SA_112_113
Adam Enterprises manufactures two products. Each product can be produced on either
of two machines. The time (in hours) required to make each product on each machine is
shown below:
Each month, 500 hours of time are available on each machine, and also customers are
willing to buy up to the quantities of each product at the prices shown below:
The company’s goal is to maximize the revenue obtained from selling units during the
next two months.
NARREND
(A) Determine how the company can meet its goal. Assume that Adam will not produce
any units in either month that it cannot sell in that month.
(B) Referring to (A), suppose Adam wants to see what will happen if customer demands
for each product in each month simultaneously change by a factor 1 + k. Revise the
model so that you can use the SolverTable add-in to investigate the effect of this change
on total revenue as k varies from -0.3 to 0.3 in increments of 0.1. Does revenue change
in a linear manner over this range? Can you explain intuitively why it changes in the
way it does?

There are, generally speaking, two types of statistical inference. They are:
a. sample estimation and population estimation
b. confidence interval estimation and hypothesis testing
c. interval estimation for a mean and point estimation for a proportion
d. independent sample estimation and dependent sample estimation
e. None of the above

Let A and B be the events of the FDA approving and rejecting a new drug to treat
hypertension, respectively. The events A and B are:
a. independent
b. conditional
c. unilateral
d. mutually exclusive
Which of the following statements are false?
a. The modeling process discussed in Data Analysis & Decision Making book is five-
step process
b. Dealing with uncertainty requires a basic understanding of probability
c. Uncertainty is a key aspect of most business problems
d. Data description and data inference are included under data analysis
NARRBEGIN: SA_93_95
After Michigan State University reached the final four in the 2000 NCAA Basketball
Tournament, a sweatshirt supplier in Lansing is trying to decide how many sweatshirts
to print for the upcoming championships. The final four teams (Michigan State, Florida,
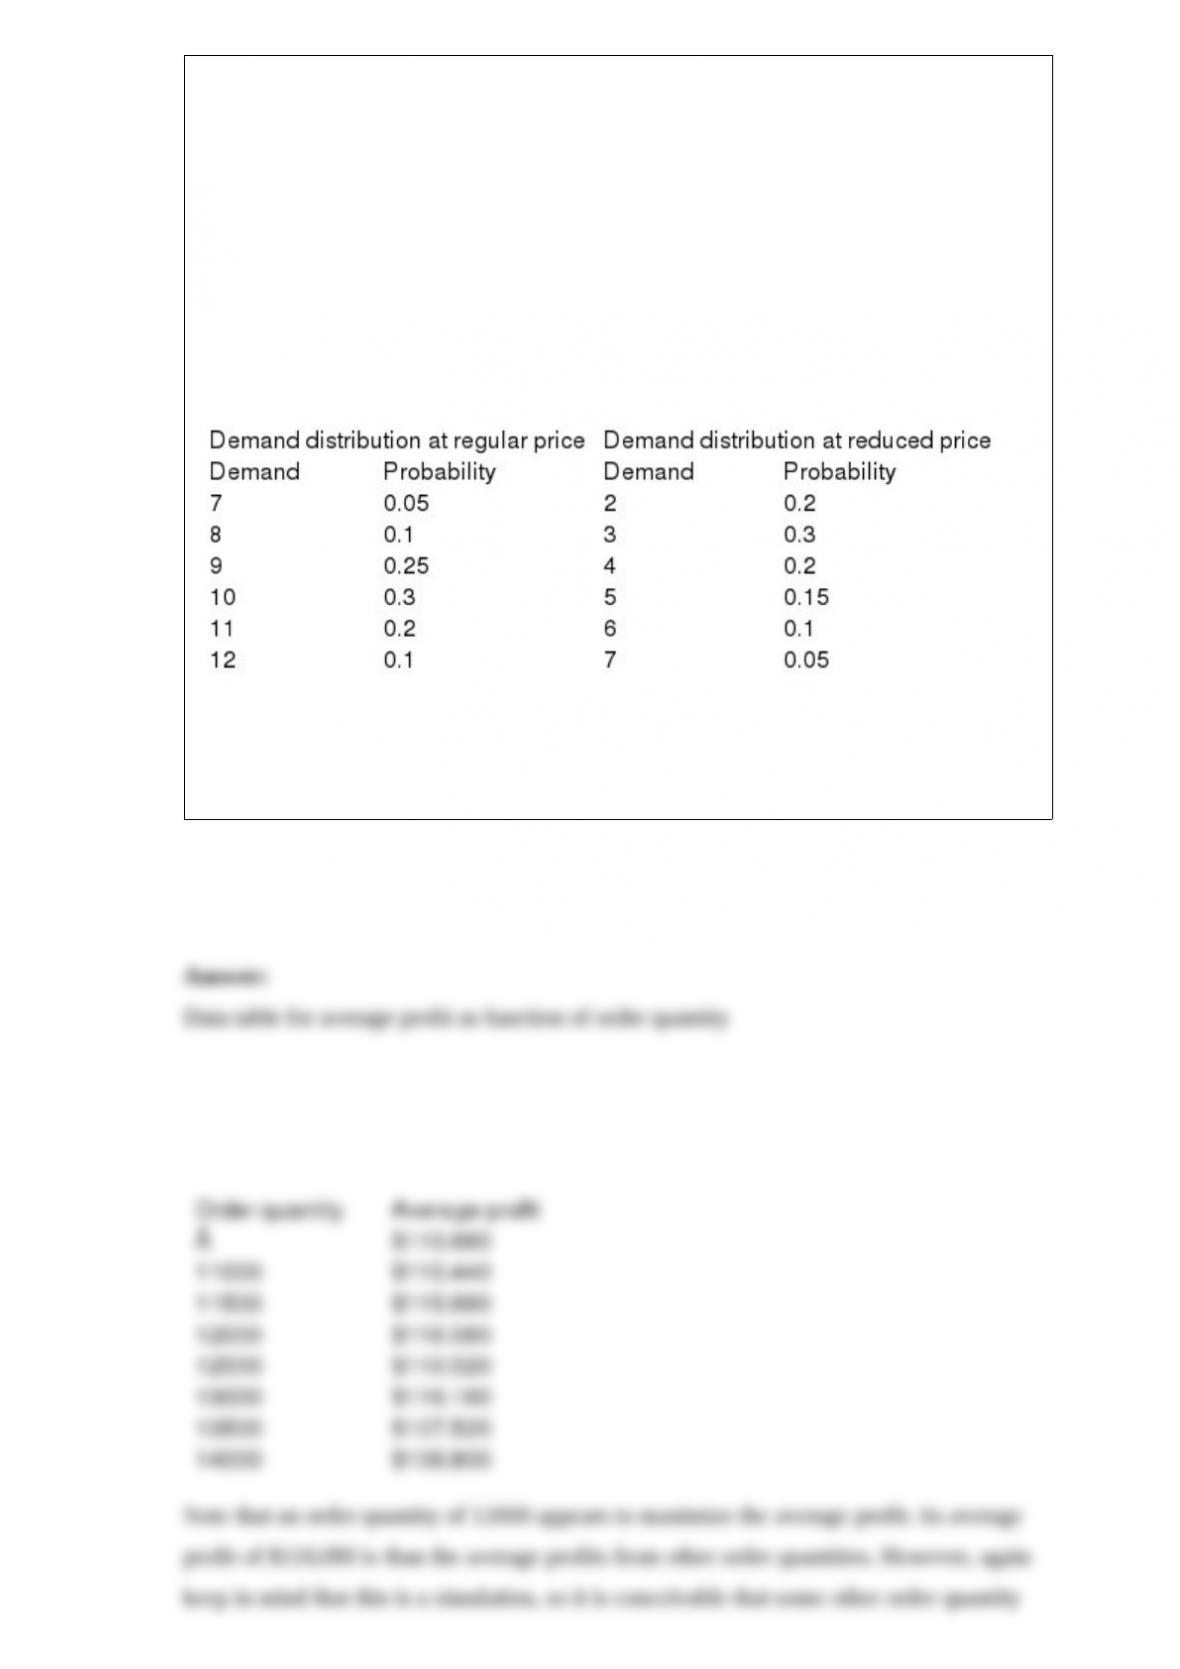
Wisconsin, and North Carolina) have emerged from the quarterfinal round, and there is
a week left until the semifinals, which are then followed in a couple of days by the
finals. Each sweatshirt costs $12 to produce and sells for $24. However, in three weeks,
any leftover sweatshirts will be put on sale for half price, $12. The supplier assumes
that the demand (in thousands) for his sweatshirts during the next three weeks, when
interest is at its highest, follows the probability distribution shown in the table below.
The residual demand, after the sweatshirts have been put on sale, also has the
probability distribution shown in the table below. The supplier realizes that every
sweatshirt sold, even at the sale price, yields a profit. However, he also realizes that any
sweatshirts produced but not sold must be thrown away, resulting in a $12 loss per
sweatshirt.
NARREND
Use simulation to analyze the supplier’s problem. Determine how many sweatshirts he
should produce to maximize the expected profit.
An important condition when interpreting the coefficient for a particular independent
variable X in a multiple regression equation is that:
a. the dependent variable will remain constant
b. the dependent variable will be allowed to vary
c. all of the other independent variables remain constant
d. all of the other independent variables be allowed to vary
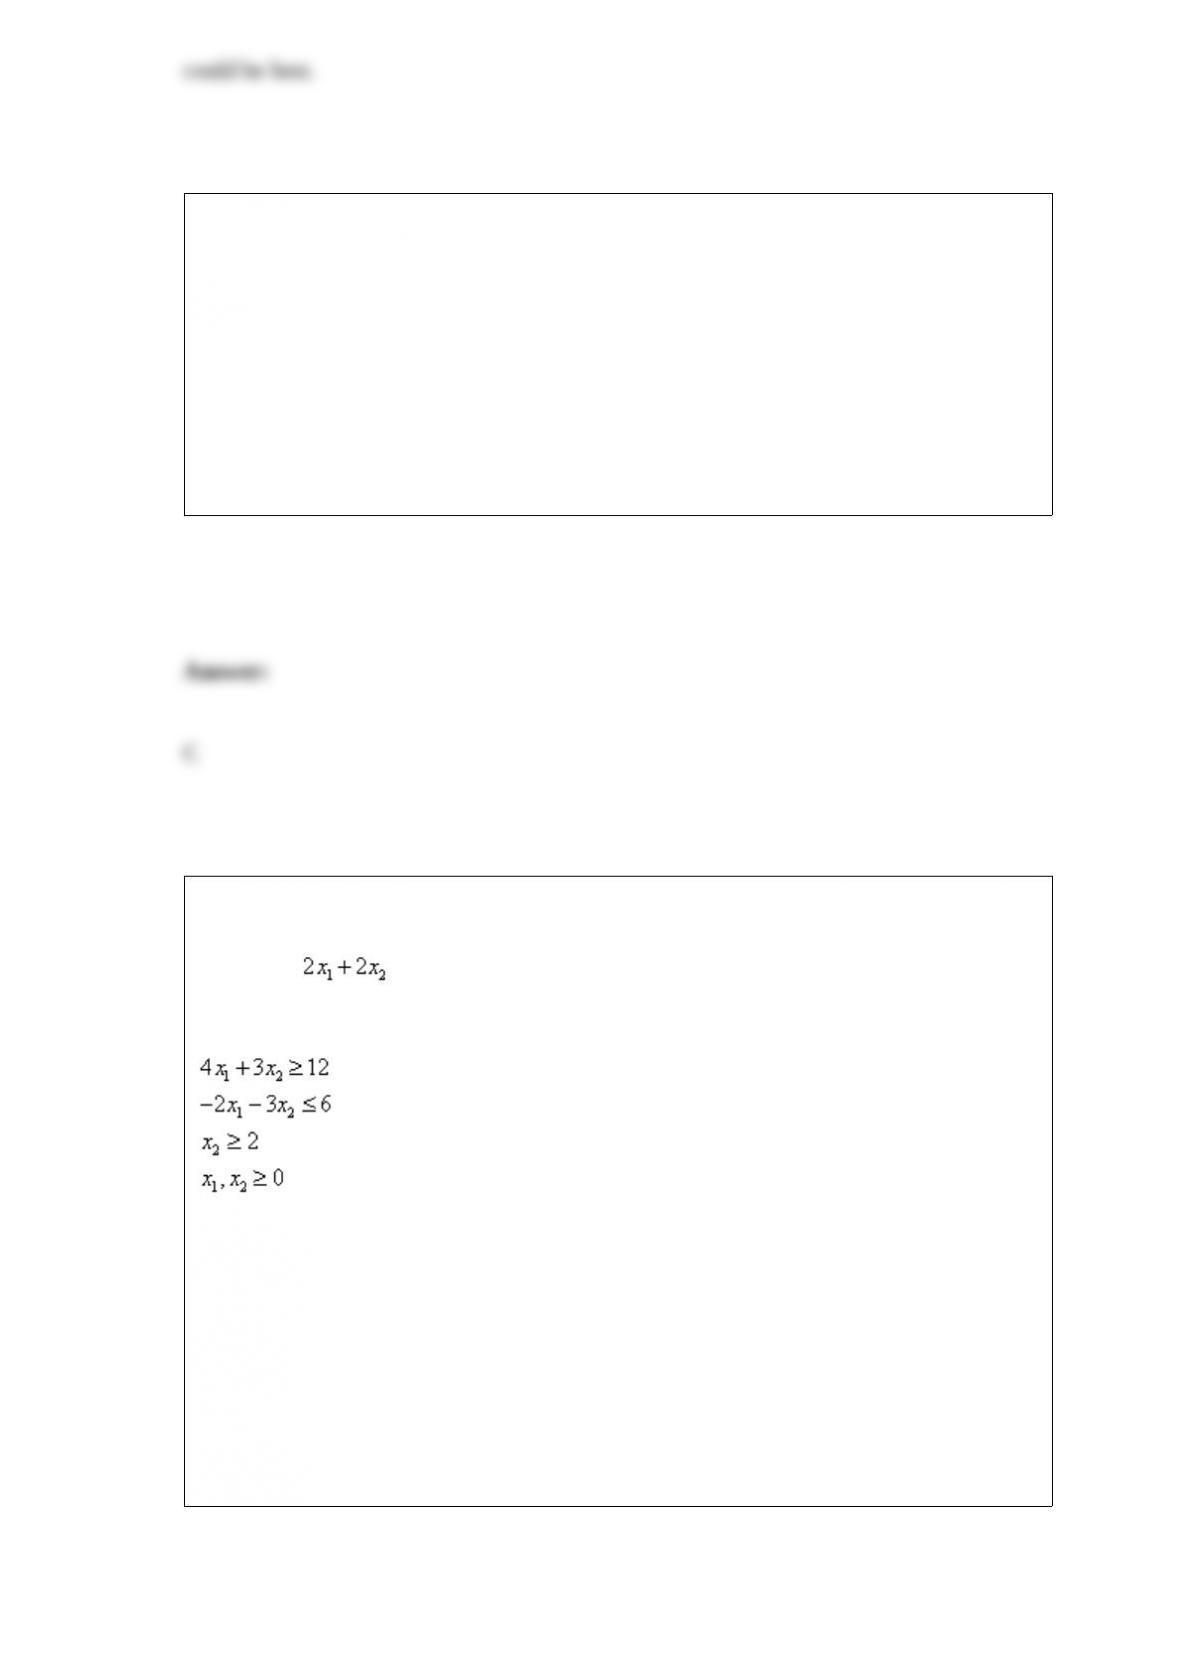
Consider the following linear programming problem:
Maximize
Subject to
The above linear programming problem:
a. has only one optimal solution
b. has more than one optimal solution
c. exhibits infeasibility
d. exhibits unboundedness

A multiple regression analysis including 50 data points and 5 independent variables
results in 40. The multiple standard error of estimate will be:
a. 0.901
b. 0.888
c. 0.800
d. 0.953
e. 0.894
In a typical minimum cost network flow model, the nodes indicate
a. roads
b. rail lines
c. geographic locations
d. rivers

The decision variables in transportation problems are:
a. profits
b. costs
c. flows
d. capacities
In a manufacturing model, we might simulate the number of days to produce a batch
and the yield from each batch. The number of days would typically be a ___________
distribution and the yield would be a ___________ distribution.
a. Continuous, discrete
b. Continuous, continuous
c. Discrete, continuous
d. Discrete, discrete
In an optimization model, there can only be one:
a. decision variable
b. constraint
c. objective function

d. shadow price
NARRBEGIN: SA_74_76
A company is about to develop and then market a new product. It wants to build a
simulation model for the entire process, and one key uncertain input is the development
cost. For each of the scenarios in the questions below, choose an “appropriate”
distribution, together with its parameters, and explain your choice.
NARREND
(A) Company experts have no idea what the distribution of the development cost is. All
they can state is that “we are 90% sure it will be somewhere between $450,000 and
$650,000.”
(B) Company experts can still make the same two statements as in (A), but now they
can also state that “we believe the distribution is symmetric and its most likely value is
about $550,000.”
(C) Company experts can still make the same two statements as in (A), but now they
can also state that “we believe the distribution is skewed to the right, and its most likely
value is about $500,000.”

Which of the following is true regarding multiple optimal solutions?
a. All solutions have the same values for the decision variables
b. All solutions have the same value for the objective function
c. All solutions have the same shadow prices
d. All of these options
The difference between the first and third quartile is called the
a. interquartile range
b. interdependent range
c. unimodal range
d. bimodal range
e. mid range
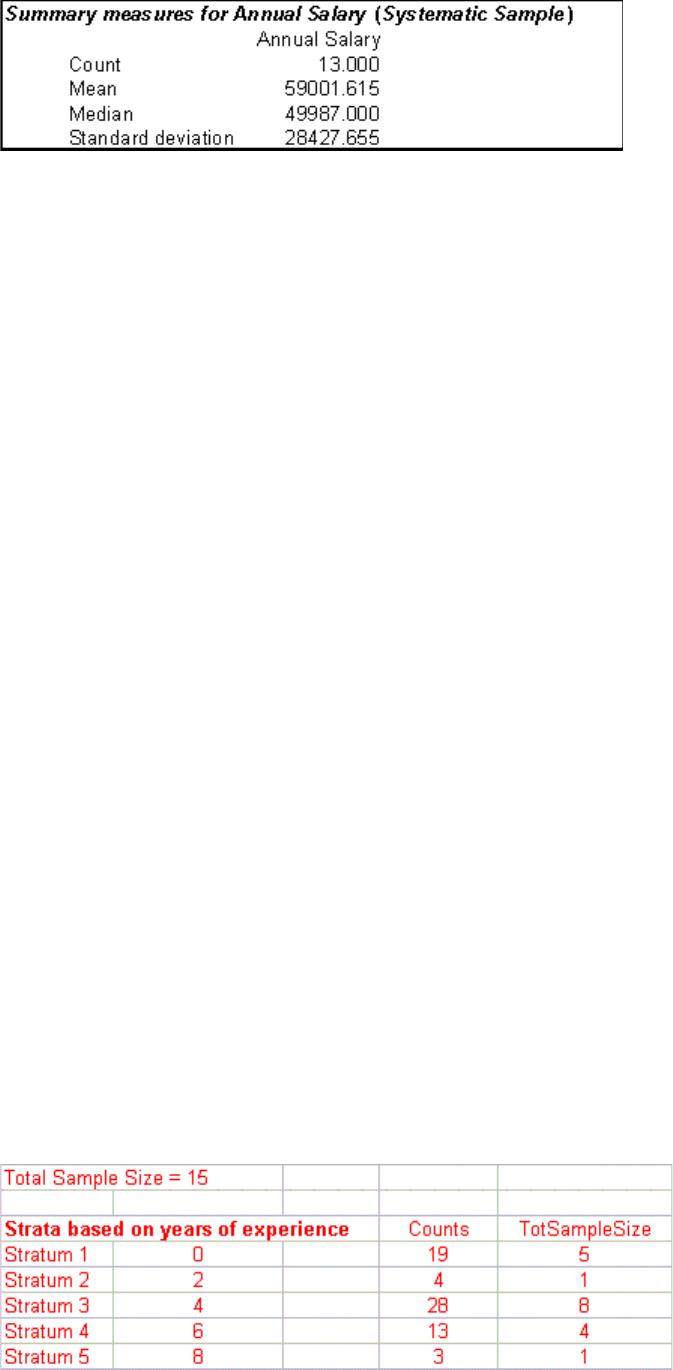
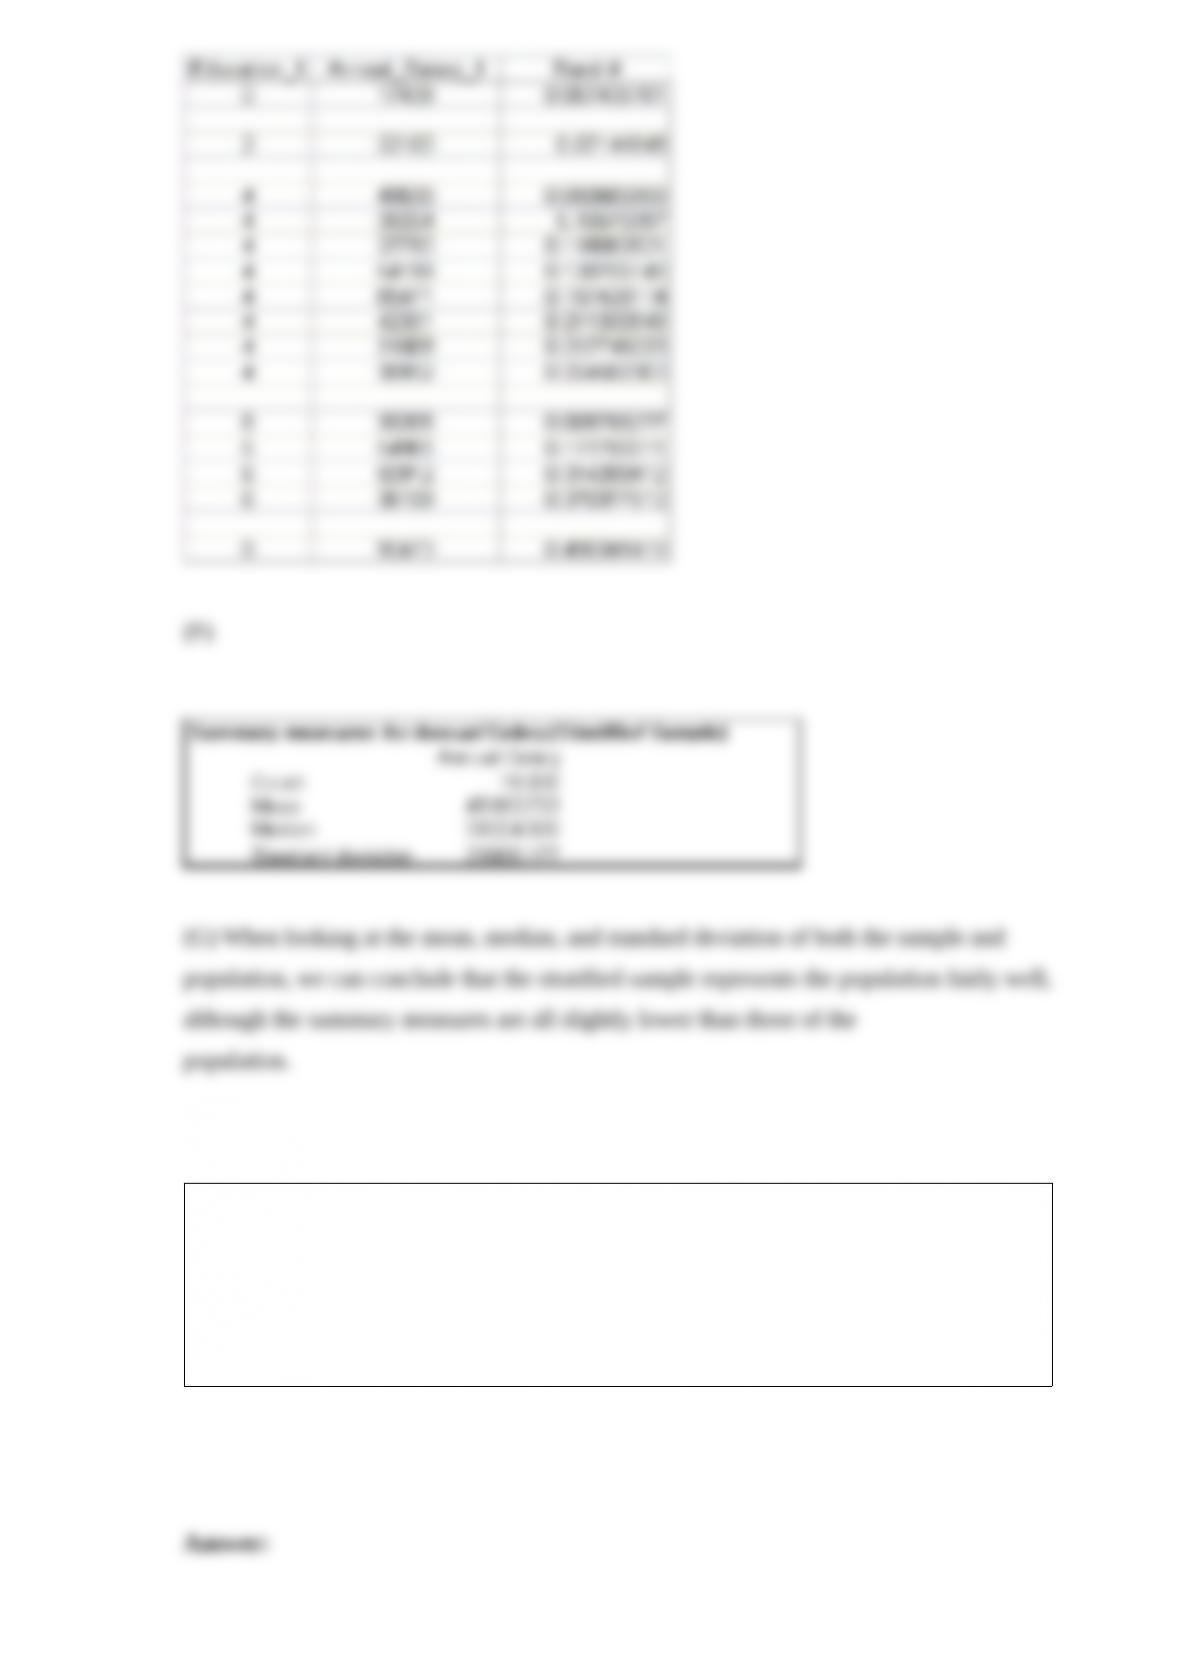
NARRBEGIN: SA_96_102
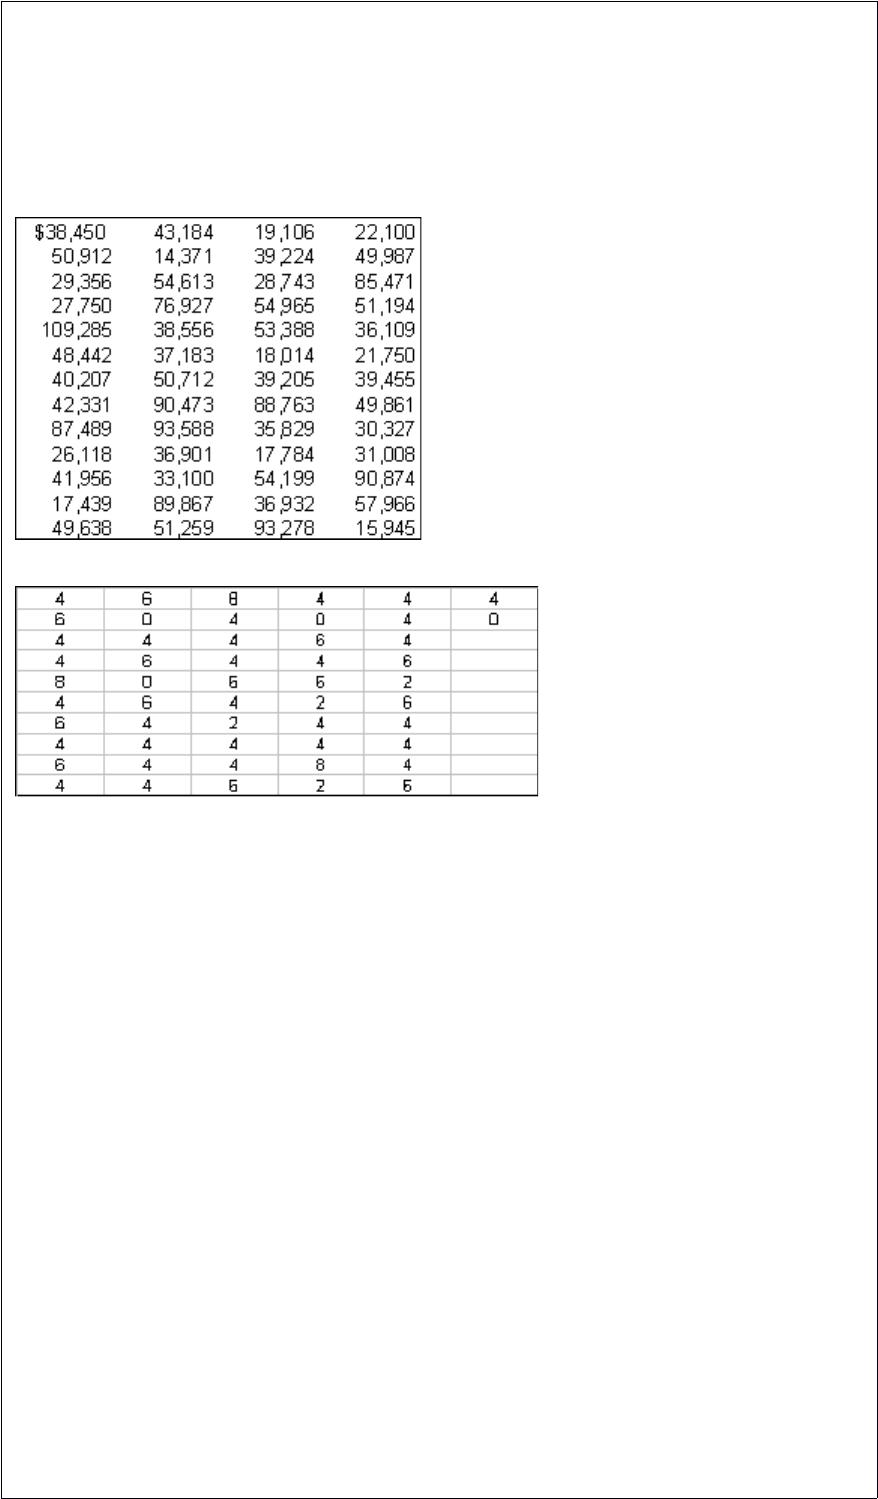
The manager of a small computer company has collected current annual salaries and
number of years of post-secondary education for 52 full-time employees. The data are
shown below:
Current annual salaries:
Number of years of post-secondary education:
NARREND
(A) Compute the mean, median, and standard deviation of the annual salaries for the 52
employees in the given frame.
(B) Use Excel to choose a systematic sample of size 13 from the frame of annual
salaries.
(C) Compute the mean, median, and standard deviation of the annual salaries for the 13
employees included in your systematic sample in (B)
(D) Compare your statistics in (C) with your computed descriptive measures for the
frame in (A). Is your systematic sample representative of the frame with respect to the
annual salary variable?
(E) Assume that we wish to stratify these employees by the number of years of
post-secondary education, select such a stratified sample of size 15 with approximately
proportional sample sizes.
(F) Compute the mean, median, and standard deviation of the annual salaries for the 15
employees included in your stratified sample in (E).
(G) Compare these statistics in (F) with your computed descriptive measures for the
frame obtained in (A). Is your stratified sample representative of the frame with respect
to the annual salary variable?
One-way ANOVA is used when analyzing the:
a. difference between more than two population means
b. results of a two-tailed test
c. results from a large sample
d. difference between two population variances

In using Excel to solve linear programming problems, the target cell represents the:
a. value of the objective function
b. constraints
c. decision variables
d. total cost of the model
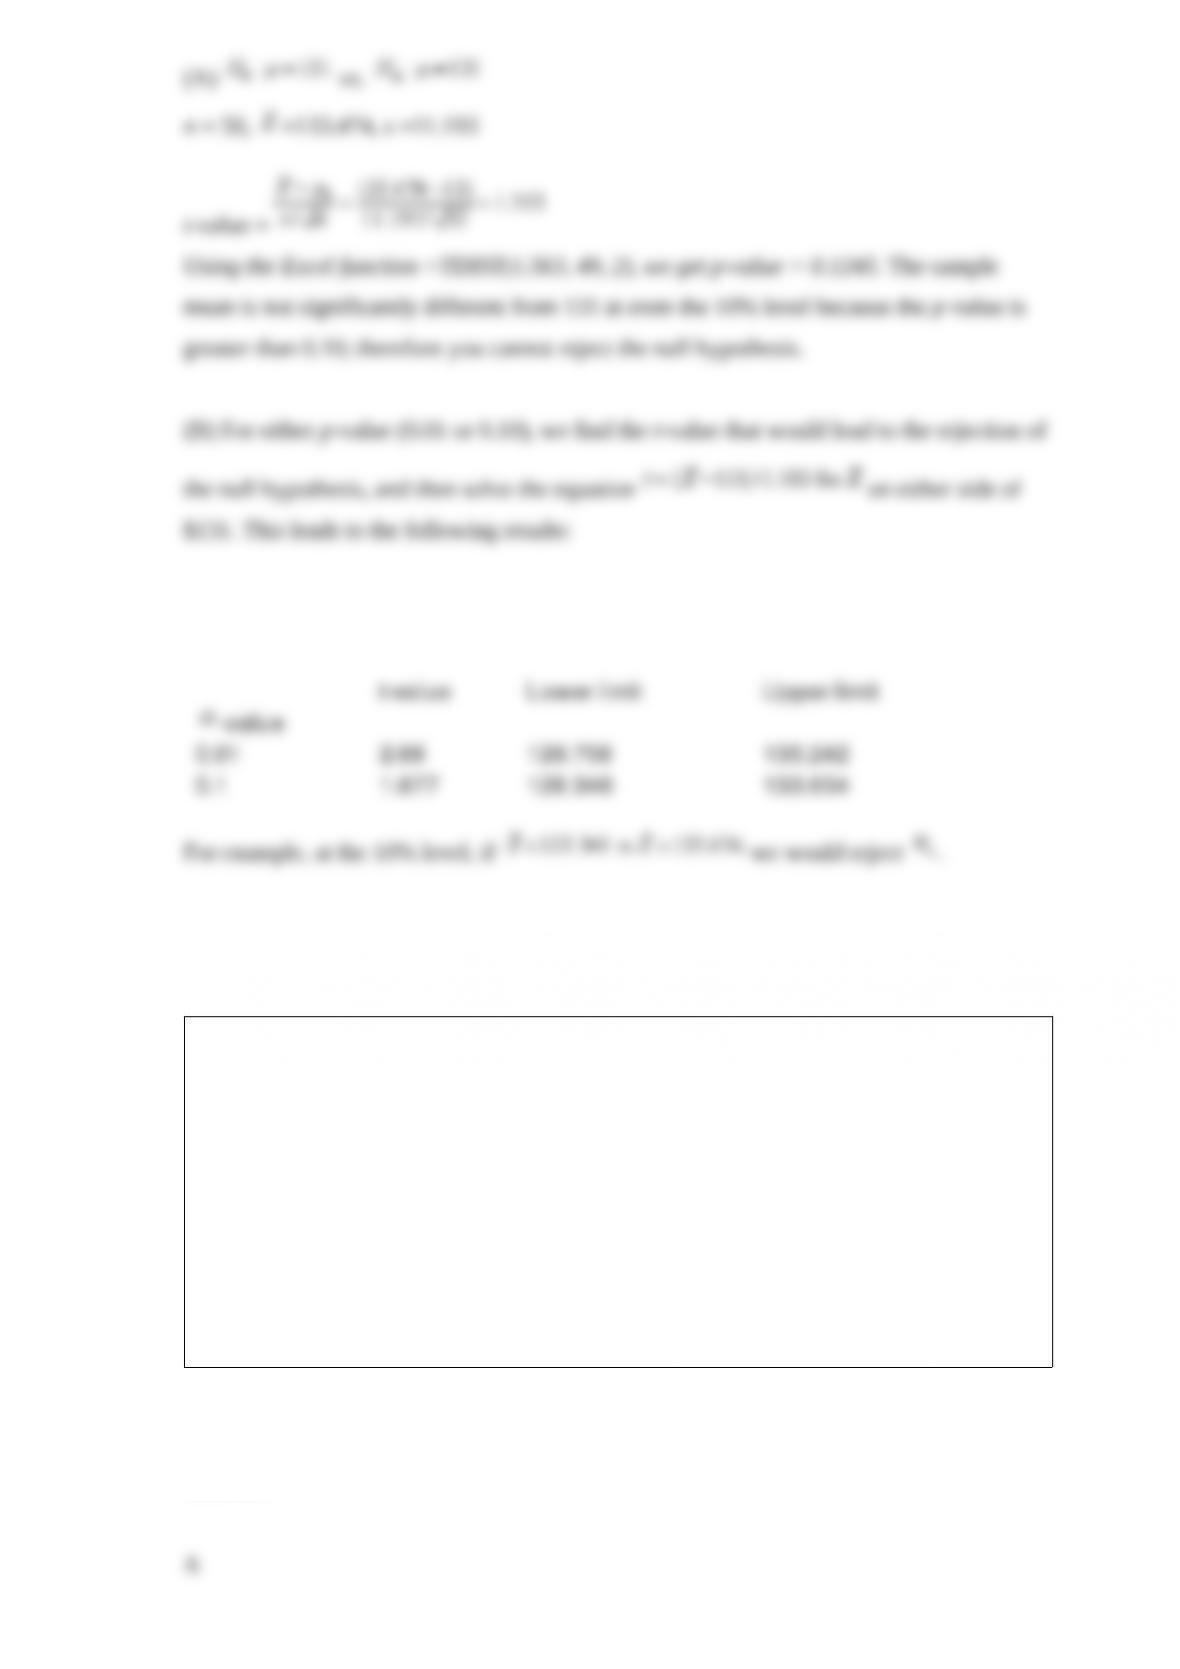
NARRBEGIN: SA_70_71
A study is performed in San Antonio to determine whether the average weekly grocery
bill per five-person family in the town is significantly different from the national
average. A random sample of 50 five-person families in San Antonio showed a mean of
$133.474 and a standard deviation of $11.193.
NARREND
(A) Assume that the national average weekly grocery bill for a five-person family is
$131. Is the sample evidence statistically significant? If so, at what significance levels
can you reject the null hypothesis?
(B) For which values of the sample mean (i.e., average weekly grocery bill) would you
decide to reject the null hypothesis at the significance level? For which values
of the sample mean would you decide to reject the null hypothesis at the 10% level of
significance?
Which of the following are the three most common measures of central location?
a. Mean, median, and mode
b. Mean, variance, and standard deviation
c. Mean, median, and variance
d. Mean, median, and standard deviation
e. First quartile, second quartile, and third quartile

Which of the following statements are true?
a. A probability distribution is symmetric (around some point) if the distribution to the
left of the point is a mirror image of the distribution to the right of the point.
b. We say a distribution is skewed to the right (or positively skewed) if the “longer tail”
is the right tail.
c. We say a distribution is skewed to the left (or negatively skewed) if the “longer tail”
is the left tail.
d. All of the above
NARRBEGIN: SA_92_95
Do undergraduate business students who major in information systems (IS) earn, on
average, higher annual starting salaries than their peers who major in marketing
(Mktg)? To address this question with a statistical hypothesis test, a comparison should
be done to determine whether the variances of annual starting salaries of the two types
of majors are equal. Below you will find output from a test of 20 randomly selected IS
majors and 20 randomly selected Mktg majors.
Summary statistics for two samples
Test of difference 0 Results if Results if
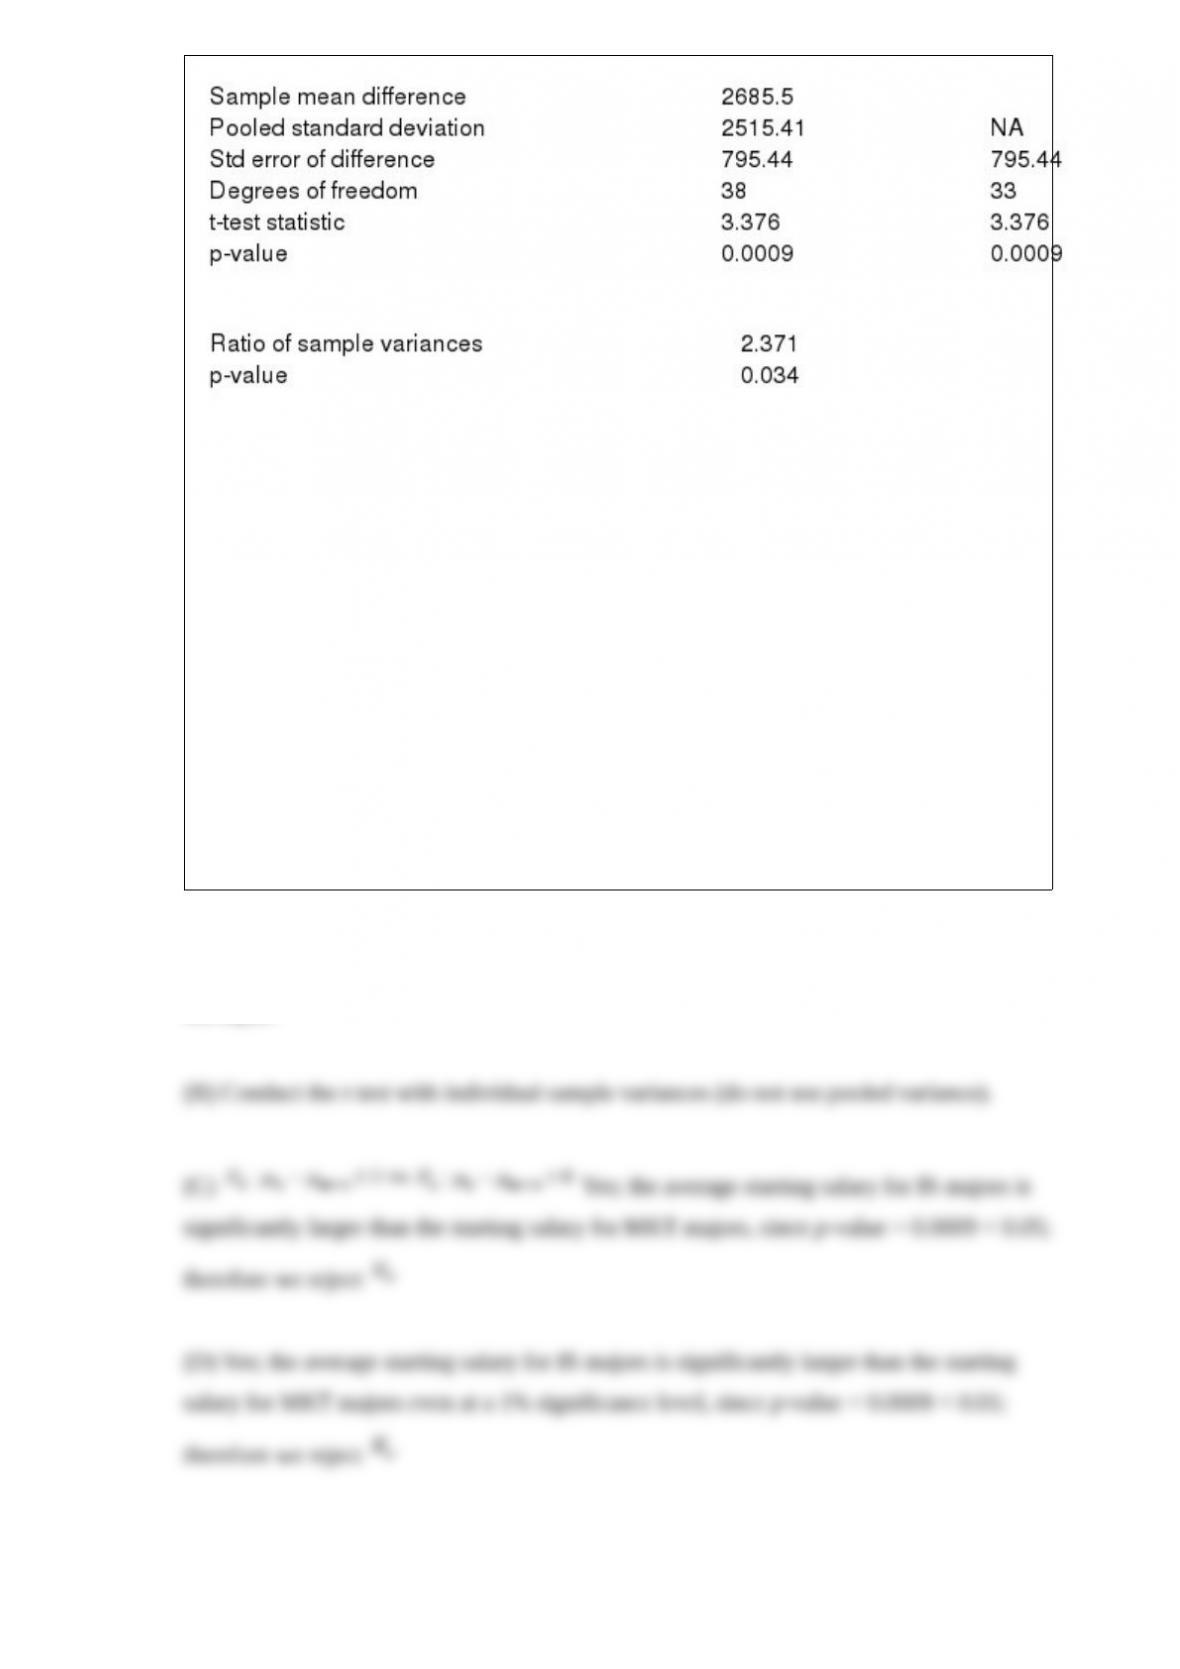
Test of equality of variances
NARREND
(A) Use the information above to perform the test of equal variance. Explain how the
ratio of sample variances is calculated. What type of distribution is used to test for equal
variances? Also, would you conclude that the variances are equal or not? Explain.
(B) Based on your conclusion in (A), which test statistic should be used in performing a
test for the existence of a difference between population means?
(C) Using a 5% level of significance, is there sufficient evidence to conclude that IS
majors earn, on average, a higher annual starting salaries than their peers who major in
Mktg?
(D) Using a 1% level of significance, is there sufficient evidence to conclude that IS
majors earn, on average, a higher annual starting salaries than their peers who major in
Mktg? Explain your answer.

The standard error of the estimate ( ) is essentially the
a. mean of the residuals
b. standard deviation of the residuals
c. mean of the explanatory variable
d. standard deviation of the explanatory variable
The approximate standard error of the point estimate of the population total is:
a.
b.
c.
d.
NARRBEGIN: NAR: SA_120_122
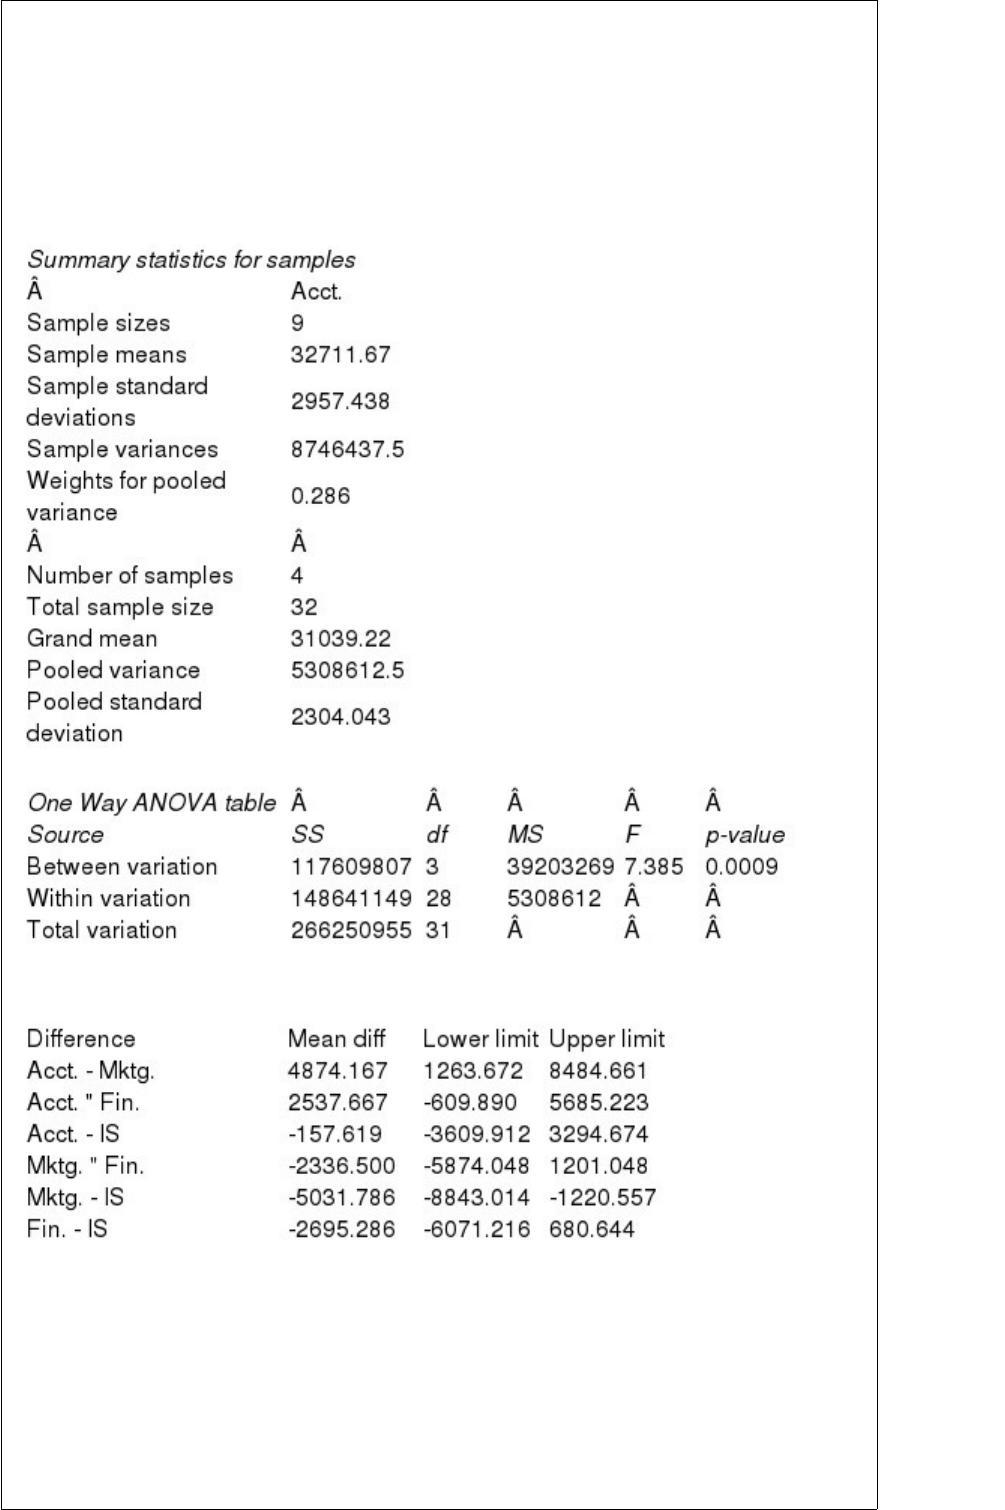
Do graduates of undergraduate business programs with different majors tend to earn
disparate starting salaries? Below you will find output from an ANOVA analysis for 32
randomly selected graduates with majors in accounting (Acct), marketing (Mktg),
finance (Fin), and information systems (IS).
Confidence Intervals for Differences
NARREND
(A) Assuming that the variances of the four underlying populations are equal, can you
reject at a 5% significance level that the mean starting salaries for all given business
majors are the same? Explain why or why not?
(B) Is there any reason to doubt the equal-variance assumption made in (A)? Support
your answer.

In cash flow models, we are typically interested in investigating:
a. the value at risk (VAR)
b. the net present value (NPV)
c. the amount of loans required to maintain a minimum cash balance
d. the interest on loans taken out by a firm
e. None of these options
NARRBEGIN: SA_92_93
An editor of a local newspaper is concerned with the number of errors that are found in
the daily paper. In order to understand the extent of this problem, the editor would like
to estimate the average number of errors in the daily paper. The frame in this case is the

number of errors found in the daily paper for the past six months (180 issues).
NARREND
(A) What sample size would be required for the production personnel to be
approximately 95% sure that their estimate of the average number of errors per issue is
within 4 errors of the true mean? Assume that the editor’s best estimate of the
population standard deviation ( ) is 10 errors per issue.
(B) How does your answer to (A) change if the editor wants the estimate to be within 3
errors of the actual population mean? Explain the difference in your answers to (A) and
(B).
The expected value of perfect information (EVPI) is equal to:
a. EMV with posterior information ” EMV with prior information
b. EMV with free perfect information ” EMV with information
c. EMV with free perfect information ” EMV with no information
d. EMV with perfect information ” EMV with less than perfect information

In linear programming we can use the shadow price to calculate increases or decreases
in:
a. binding constraints
b. nonbinding constraints
c. values of the decision variables
d. the value of the objective function
Which of the following is not one of the guidelines for including/excluding variables in
a regression equation?
a. Look at t-value and associated p-value
b. Check whether t-value is less than or greater than 1.0
c. Variables are logically related to one another
d. Use economic or physical theory to make decision
e. All of these options are guidelines
From a sample of 500 items, 30 were found to be defective. The point estimate of the
population proportion defective will be:
a. 0.06
b. 30.0
c. 16.667
d. None of the above
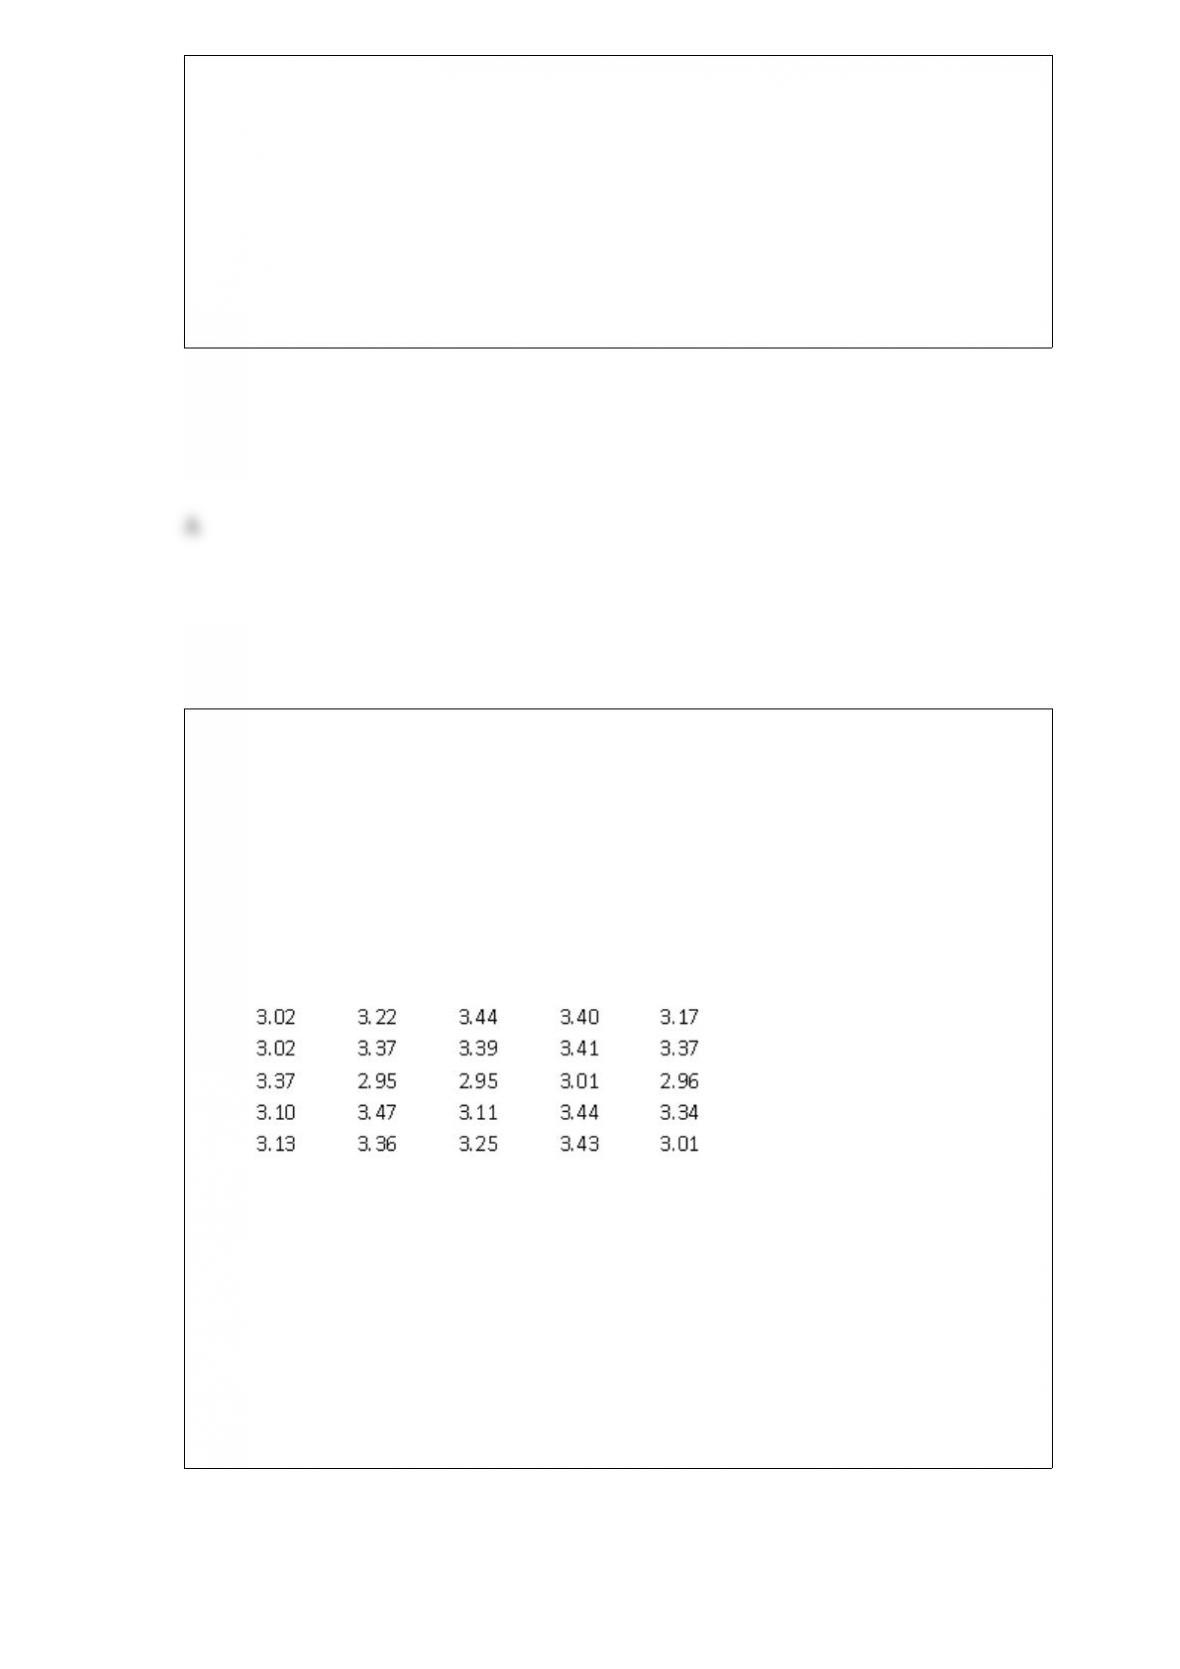
NARRBEGIN: SA_117_120
A columnist for the LA Times is working to meet a deadline on a story about
commuting in Los Angeles. She wants to include information about the current price of
gasoline in the Los Angeles metro area, but her source person for this type of
information has already gone home for the day. So she decides to take her own sample
as she drives home, writing down the prices she observes as she makes her way from
downtown to her neighborhood in the suburbs. Below is the data sample she obtains
(units are $/gallon).
NARREND
(A) Do you think she has obtained a true random sample?
(B) What average price could she report, based on the above sample?
(C) What average price range could she report, based on the above sample?
(D) Do you see any issues with reporting the range calculated for (C)?

A common characteristic of integer programming models is that they:
a. are easy to solve graphically
b. produce the same answer and standard linear programming models
c. often produce multiple optimal solutions
d. all of these options
NARRBEGIN: SA_91_103
A sample of 1000 households was selected in Los Angeles to determine information
concerning consumer behavior. Among the questions asked was “Do you enjoy
shopping for clothing?” Of 480 males, 272 answered yes. Of 520 females, 448
answered yes.
NARREND
What is the probability that a respondent chosen at random is a male and enjoys
shopping for clothing?
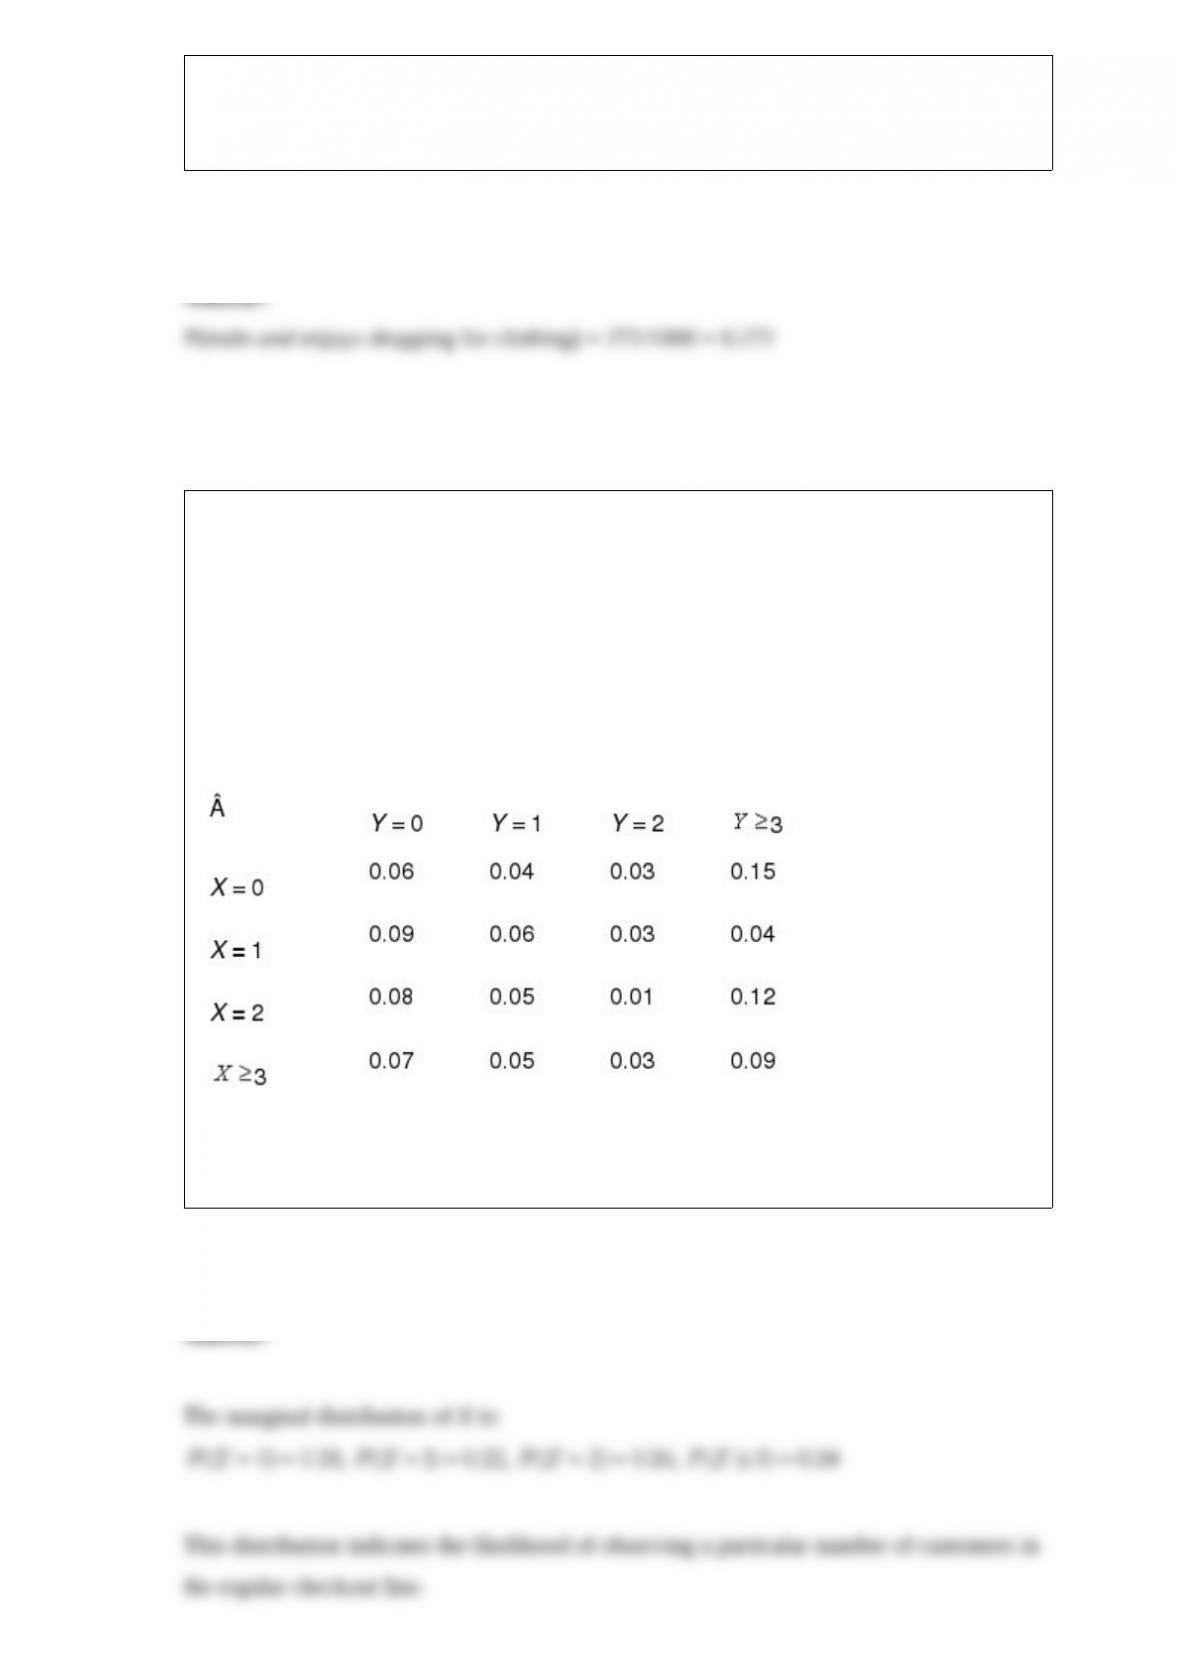
NARRBEGIN: SA_70_78
A small grocery store has two checkout lines available to its customers: a regular
checkout line and an express checkout line. Customers with 5 or fewer items are
expected to use the express line. Let X and Y be the number of customers in the regular
checkout line and the express checkout line, respectively. Note that these numbers
include the customers being served, if any. The joint probability distribution of X and Y
is given in the table below.
NARREND
Find the marginal distribution of X. What does this distribution tell you?

A random variable X is standardized when each value of X has the mean of X subtracted
from it, and the difference is divided by the standard deviation of X.
The additivity property of LP models implies that the sum of the contributions from the
various activities to a particular constraint equals the total contribution to that
constraint.
All linear programming problems should have a unique solution, if they can be solved.
The test statistic for a hypothesis test of a population proportion is the z-value.
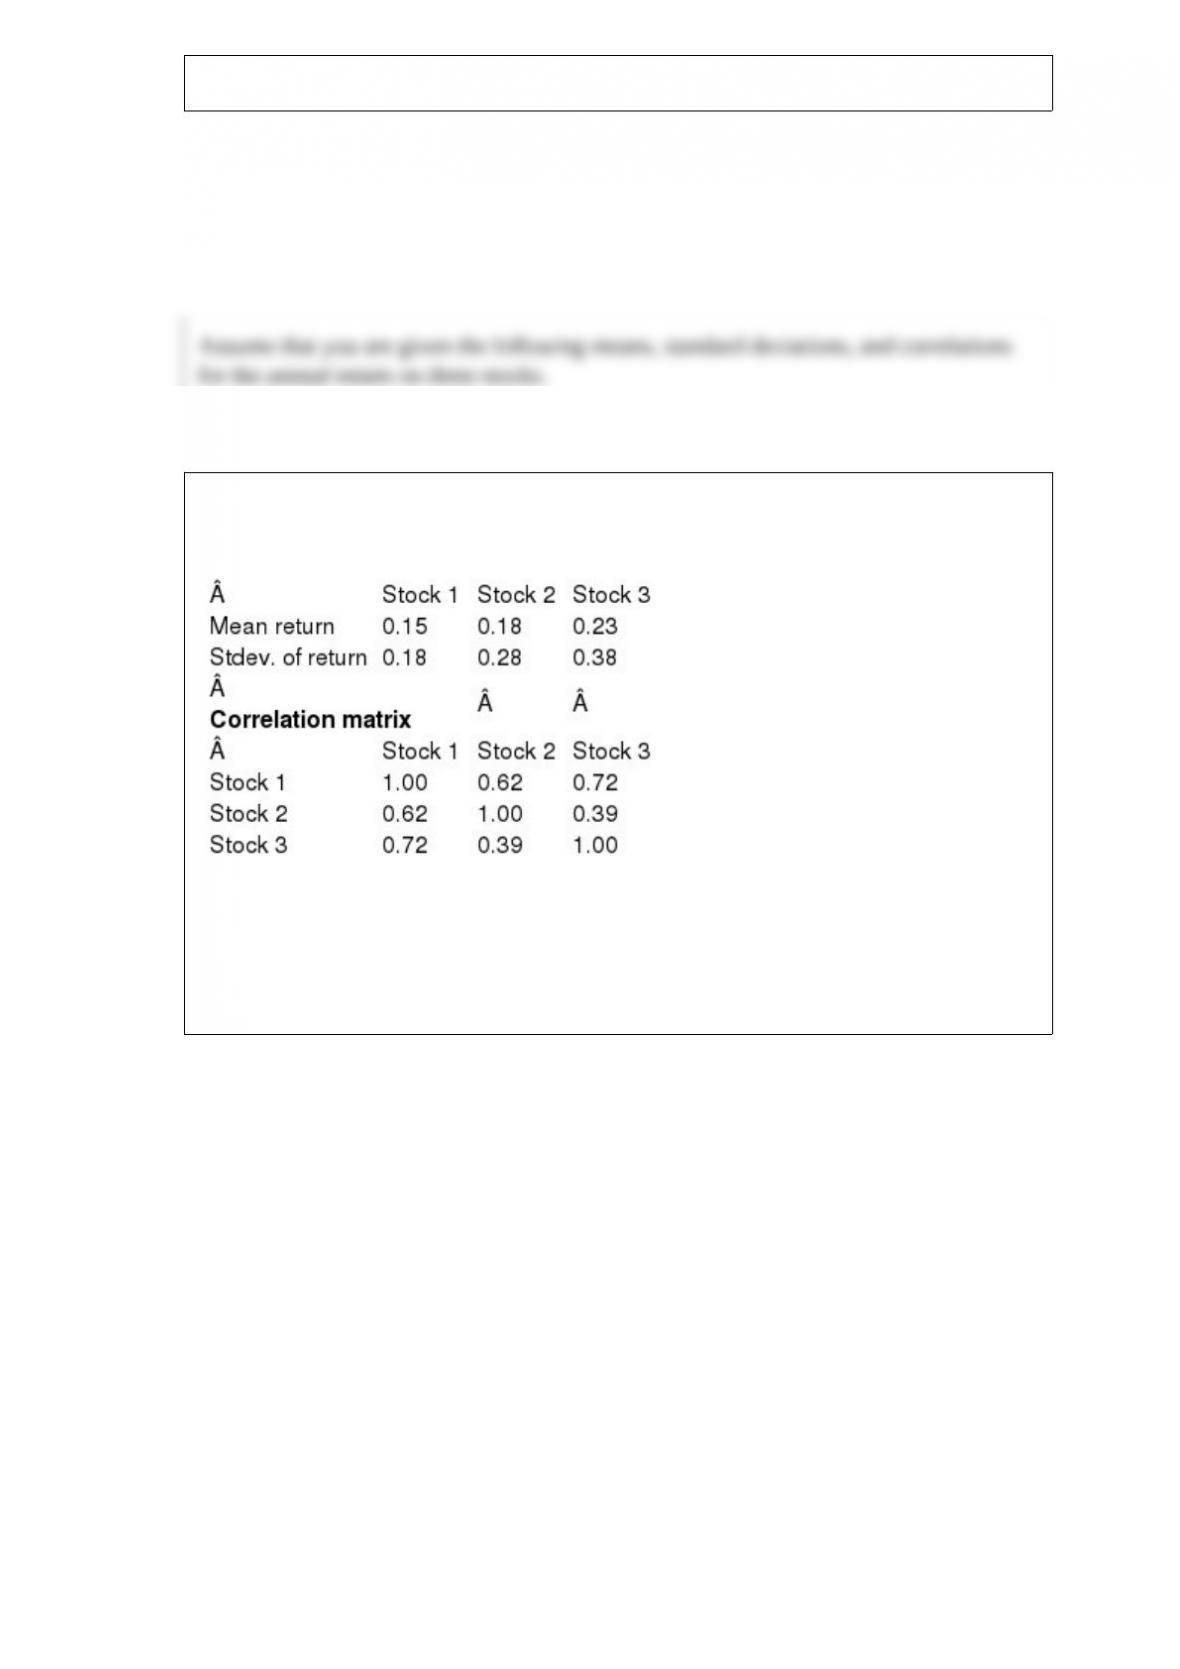
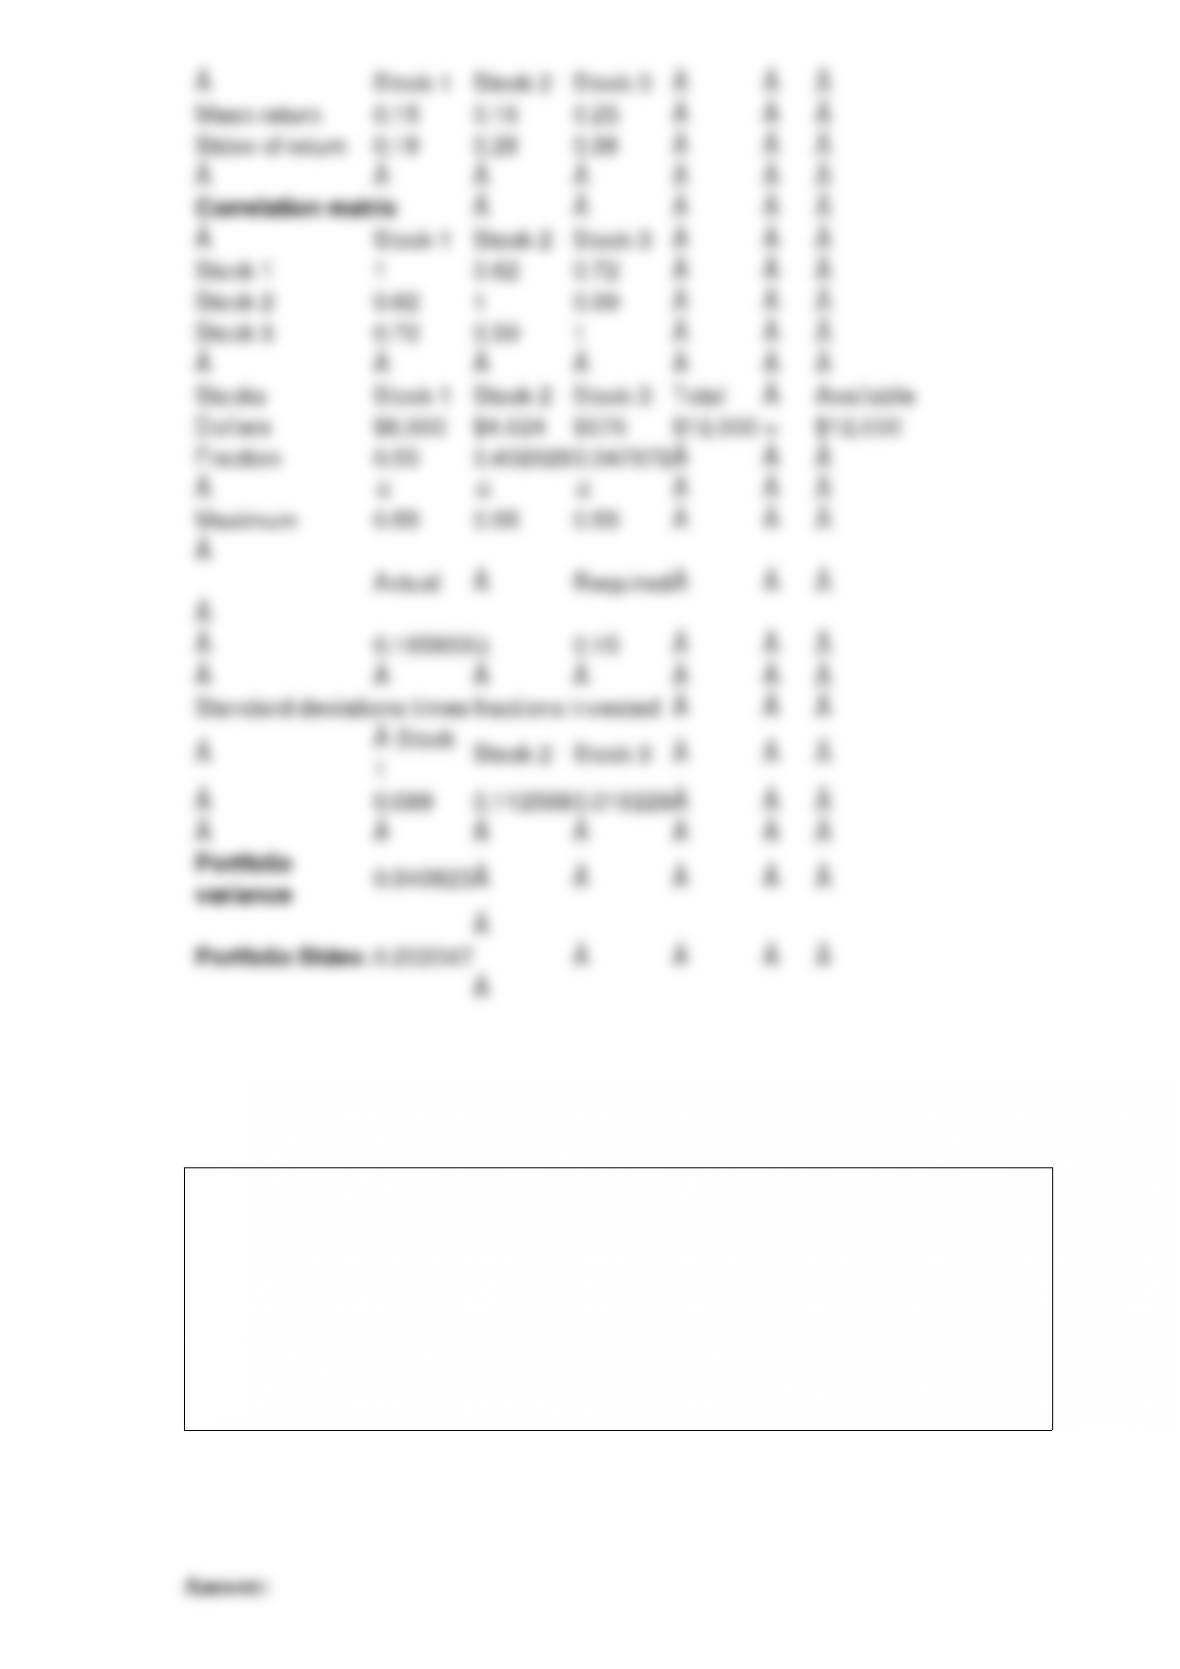
Assume that you are given the following means, standard deviations, and correlations
for the annual return on three stocks.
The correlation between stocks 1 and 2 is 0.62, between stocks 1 and 3 is 0.72, and
between stocks 2 and 3 is 0.39. You have $12,000 to invest and can invest no more than
55% of your money in any single stock. Determine the minimum variance portfolio that
yields an expected annual return of at least 0.15
NARRBEGIN: SA_89_91
The following data represent the number of children in a sample of 10 families from
Chicago: 4, 2, 1, 1, 5, 3, 0, 1, 0, and 2.
NARREND
Compute the mean number of children.
In decision trees, a probability node (a circle) is a time when the decision maker makes
a decision.
NARRBEGIN: SA_86_88
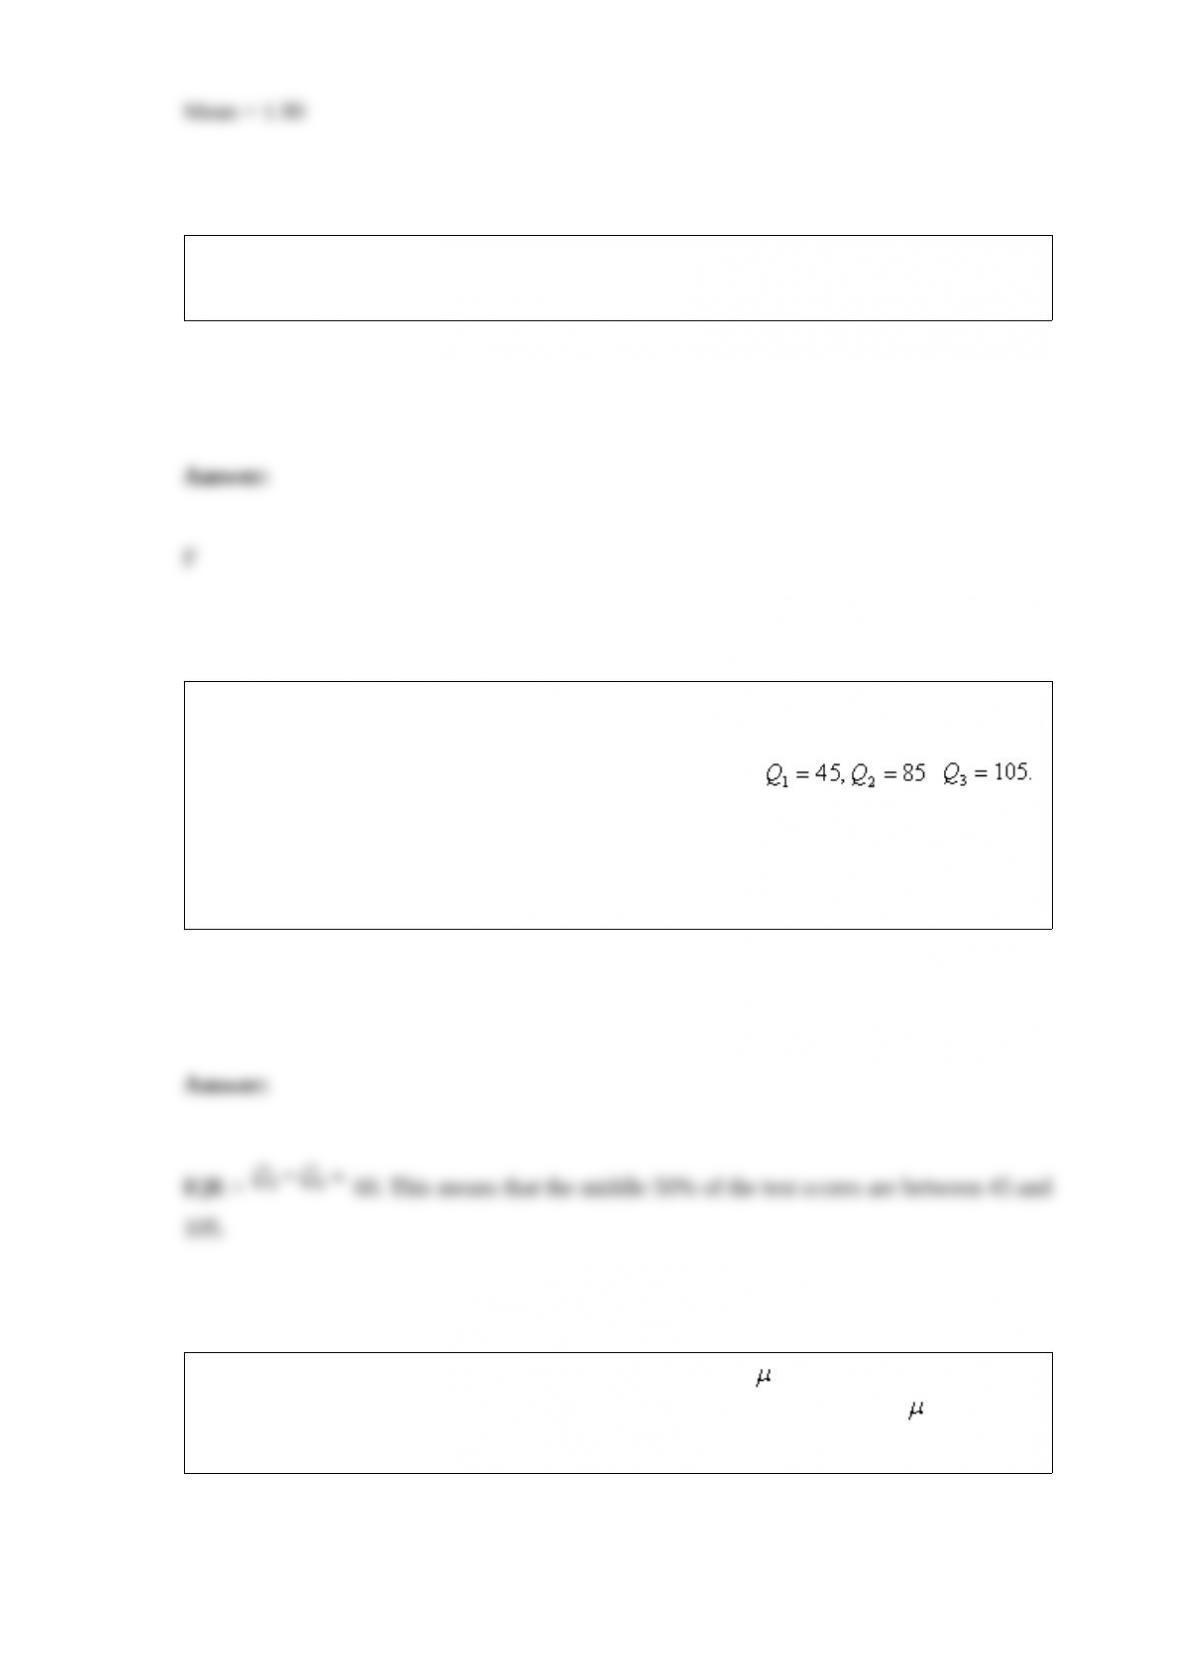
Suppose that an analysis of a set of test scores reveals that: ,
NARREND
Calculate the interquartile range. What does this tell you about the data?
A 90% confidence interval estimate for a population mean is determined to be 72.8 to
79.6. If the confidence level is reduced to 80%, the confidence interval for becomes
narrower.

Any integer programming problem involving 0-1 variables with only one constraint is
called a knapsack problem.
What percentage of the students in the sample went partying the weekend before the
final exam and did well in the exam?
An alternative hypothesis can have the signs >, <, or ?.

Correlogram is a bar chart of autocorrelation at different lags.
When there is a group of explanatory variables that are in some sense logically related,
all of them must be included in the regression equation.
Seasonal variations will not be present in a deseasonalized time series.
Simple exponential smoothing is appropriate for a series without a pronounced trend or
seasonality.