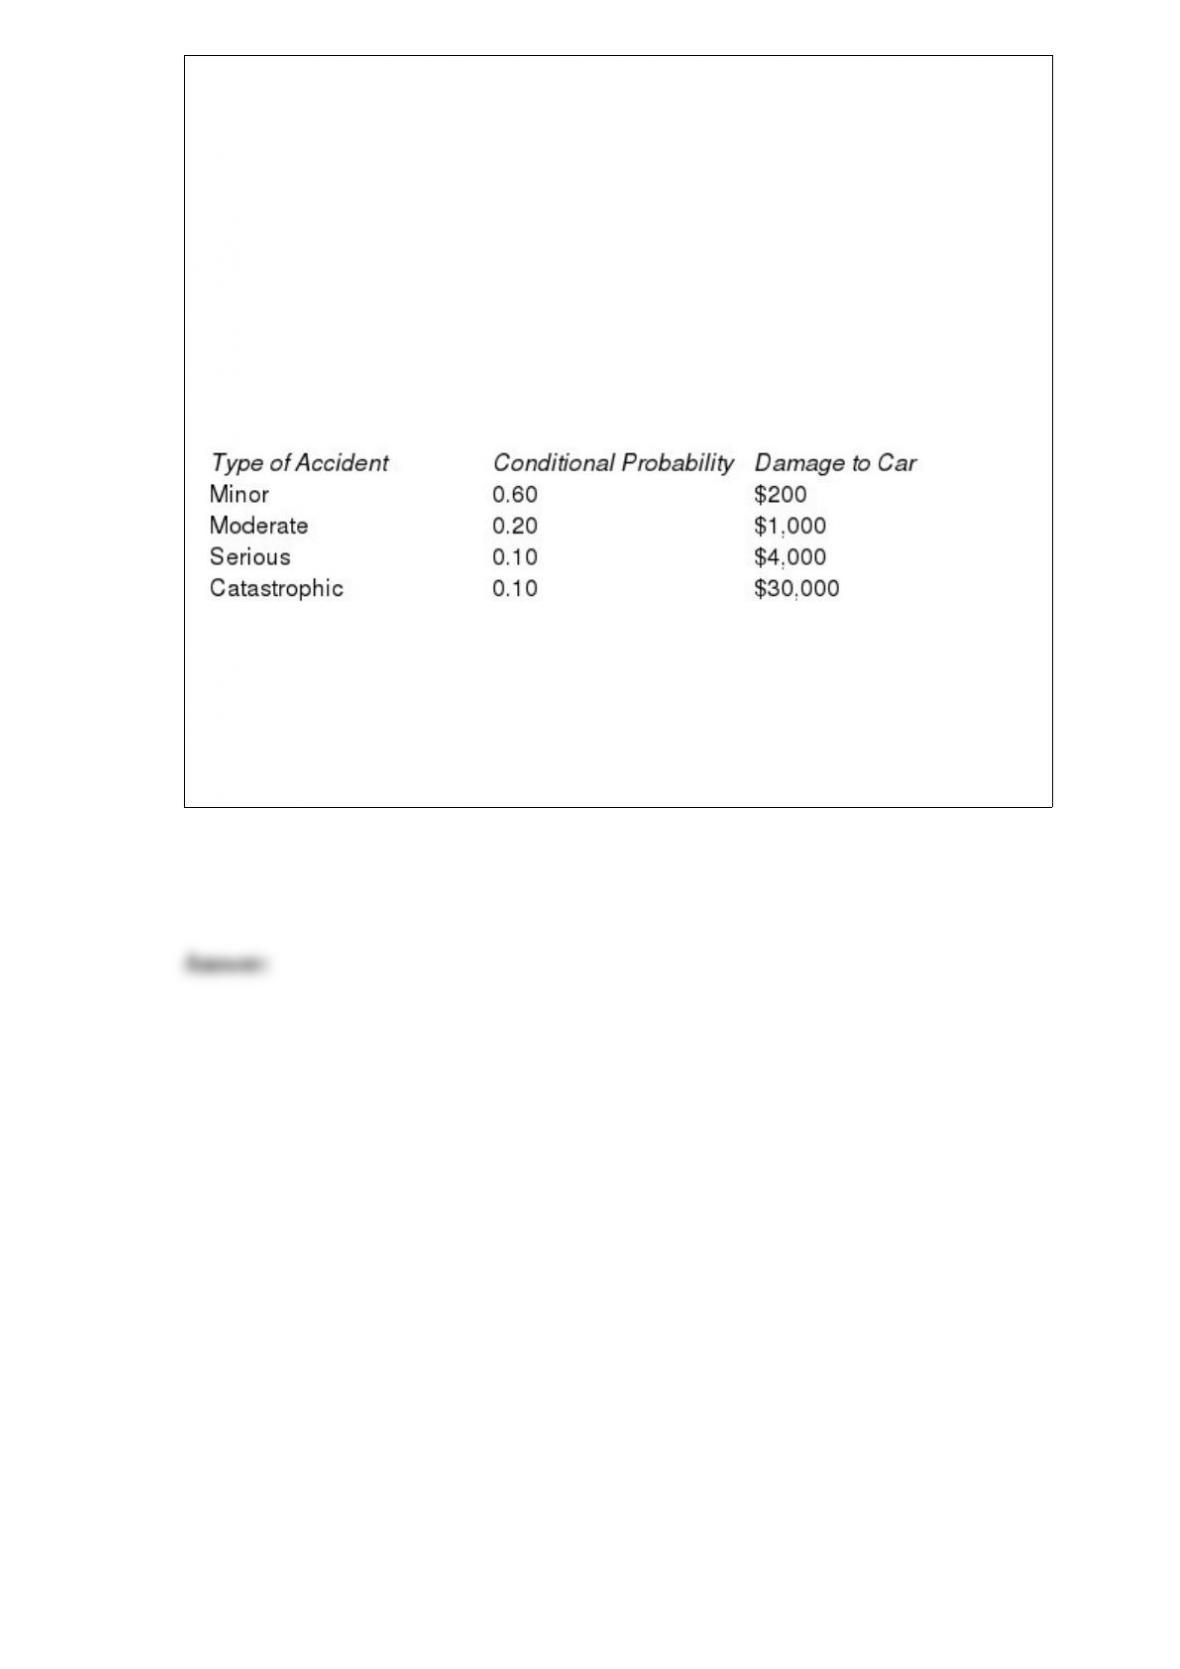
NARRBEGIN: SA_104_112
Mrs. Rich has just bought a new $30,000 car. As a reasonably safe driver, she believes
that there is only a 5% chance of being in an accident in the forthcoming year. If she is
involved in an accident, the damage to her new car depends on the severity of the
accident. The probability distribution for the range of possible accidents and the
corresponding damage amounts (in dollars) are shown in the table below. Mrs. Rich is
trying to decide whether she is willing to pay $170 each year for collision insurance
with a $300 deductible. Note that with this type of insurance, she pays the first $300 in
damages if she causes an accident, and the insurance company pays the remainder.
Distribution of Accident Types and Corresponding Damage Amounts
NARREND
Perform a sensitivity analysis on the optimal decision and summarize your findings.
Vary the probability of being in an accident from 0% to 10%, the insurance premium
from $50 to $300, and the deductible amount from $0 to $600. In response to which
model inputs is the expected total cost value most sensitive?
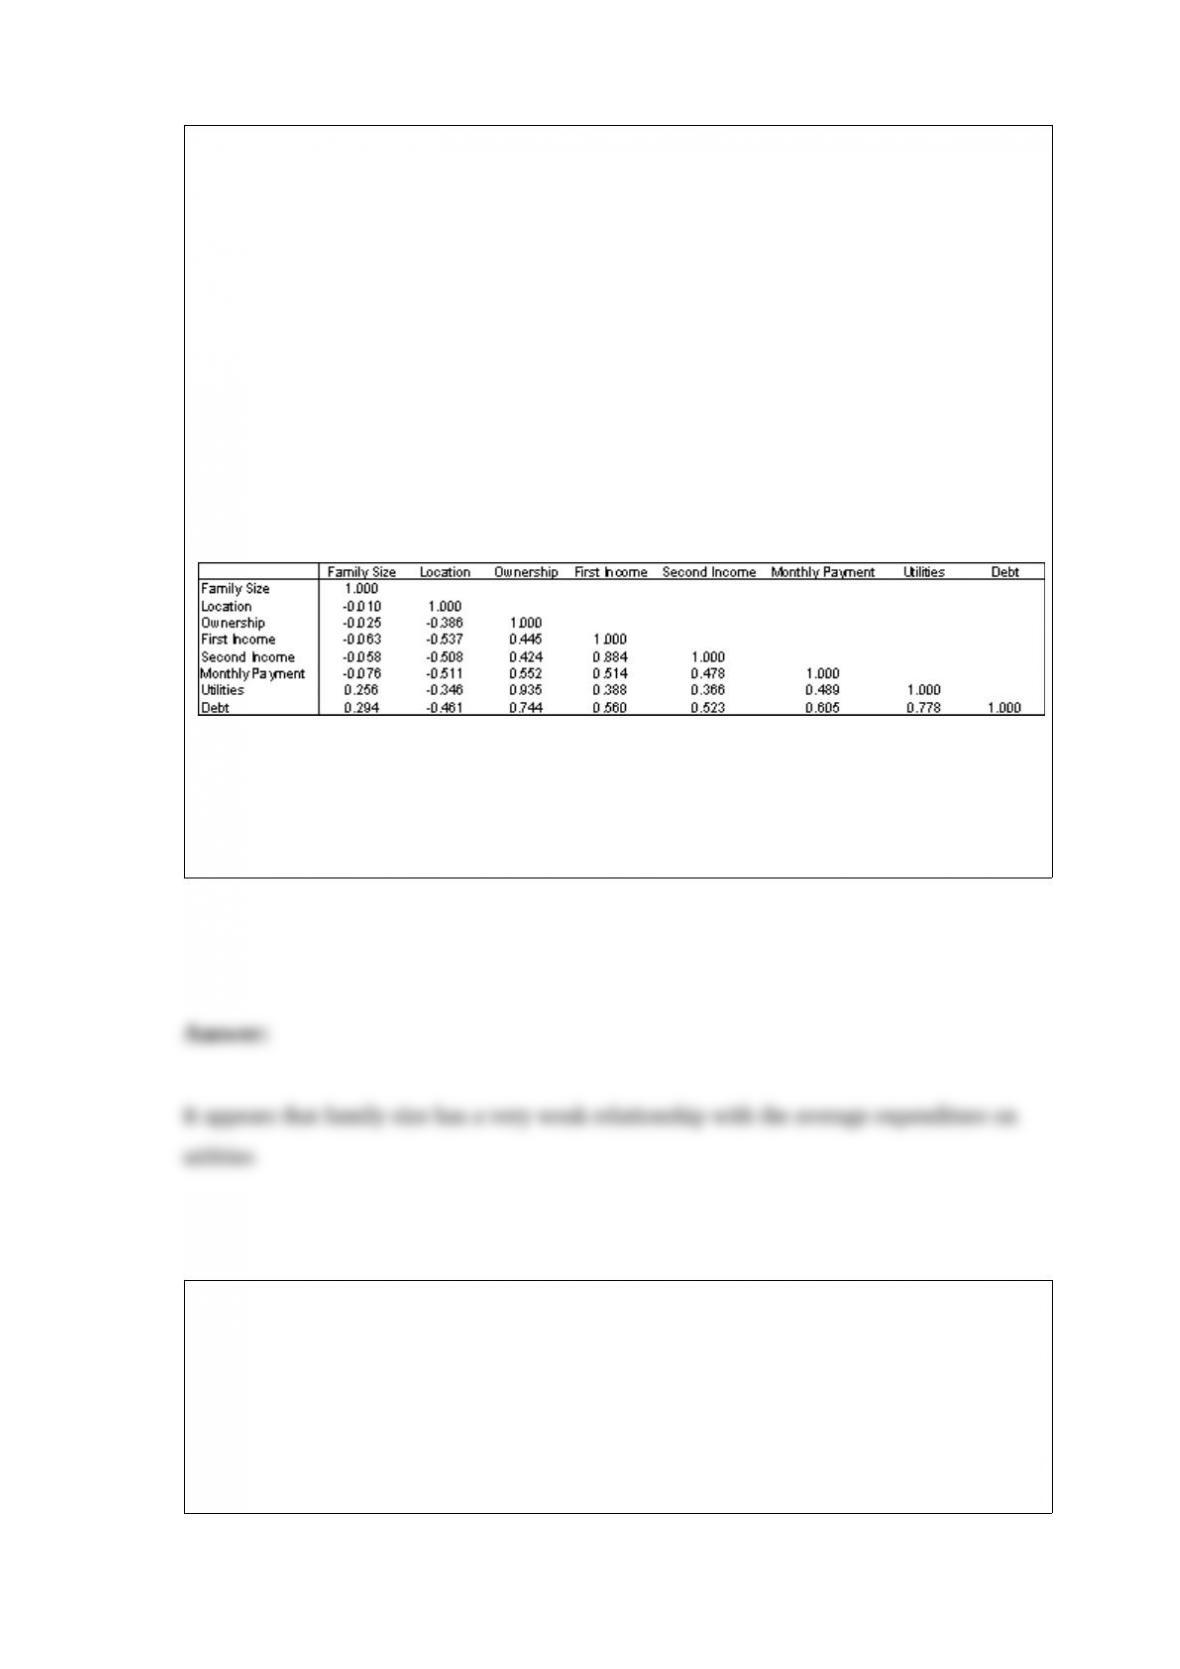
NARRBEGIN: SA_51_53
An economic development researcher wants to understand the relationship between the
average monthly expenditure on utilities for households in a particular middle-class
neighborhood and each of the following household variables: family size, approximate
location of the household within the neighborhood, and indication of whether those
surveyed owned or rented their home, gross annual income of the first household wage
earner, gross annual income of the second household wage earner (if applicable), size of
the monthly home mortgage or rent payment, and the total indebtedness (excluding the
value of a home mortgage) of the household.
The correlation for each pairing of variables are shown in the table below:
Table of correlations
NARREND
Which of the variables have essentially no linear relationship with the household’s
average monthly expenditure on utilities?
NARRBEGIN: SA_91_94
Consider a binomial random variable X withn = 5 and p = 0.40.
NARREND
Find the mean and the variance of X.

Decision trees are composed of nodes (circles, squares, and triangles) and branches
(lines).
If Solver fails to find an optimal solution to an integer programming problem, we might
be able to find a near optimalsolution by increasing the tolerance setting.
Correlation is used to determine the strength of the linear relationship between an
explanatory variable X and response variable Y.
When formulating a linear programming spreadsheet model, there is one target
(objective) cell that contains the value of the objective function.
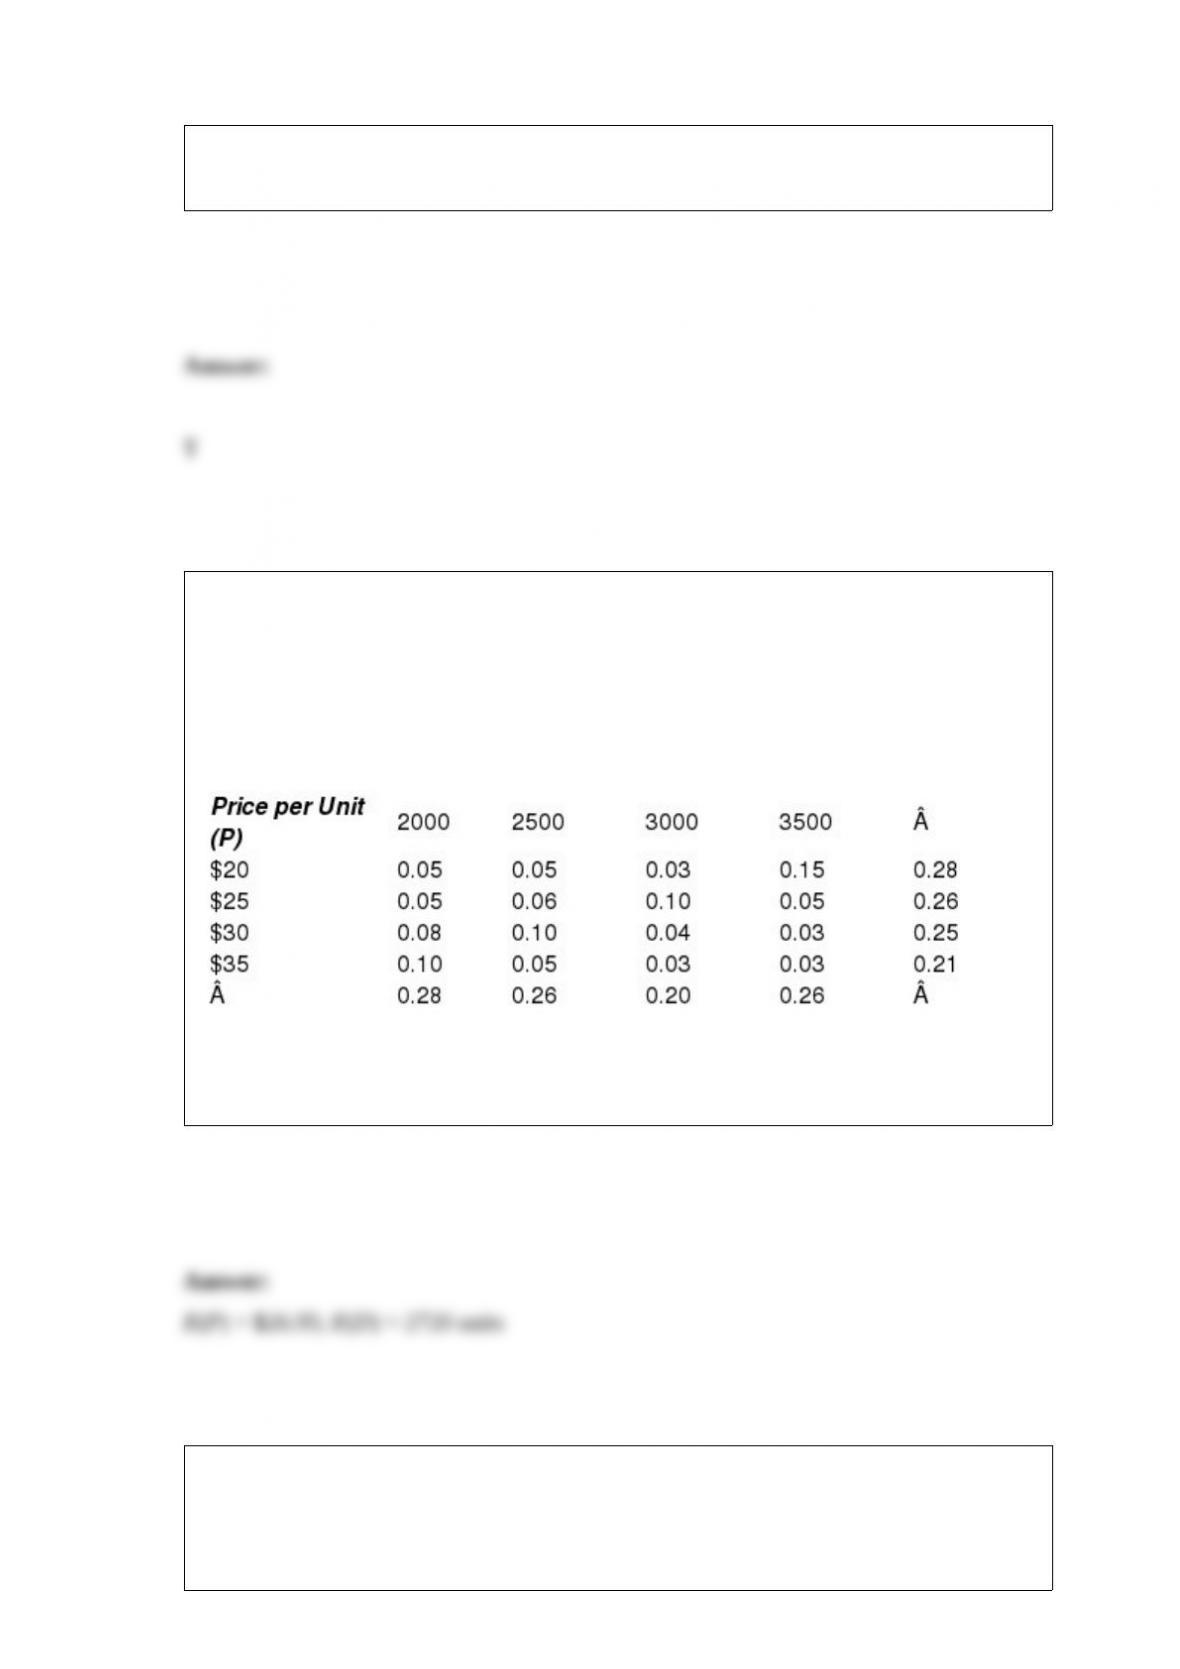
NARRBEGIN: SA_79_83
Suppose that the manufacturer of a particular product assesses the joint distribution of
the price per unit (P) and demand (D) for its product in the upcoming quarter as
presented below. Use this information to answer the following questions.
Demand (D)
NARREND
Find the expected price and demand level for the upcoming quarter.
NARRBEGIN: SA_91_103
A sample of 1000 households was selected in Los Angeles to determine information
concerning consumer behavior. Among the questions asked was “Do you enjoy
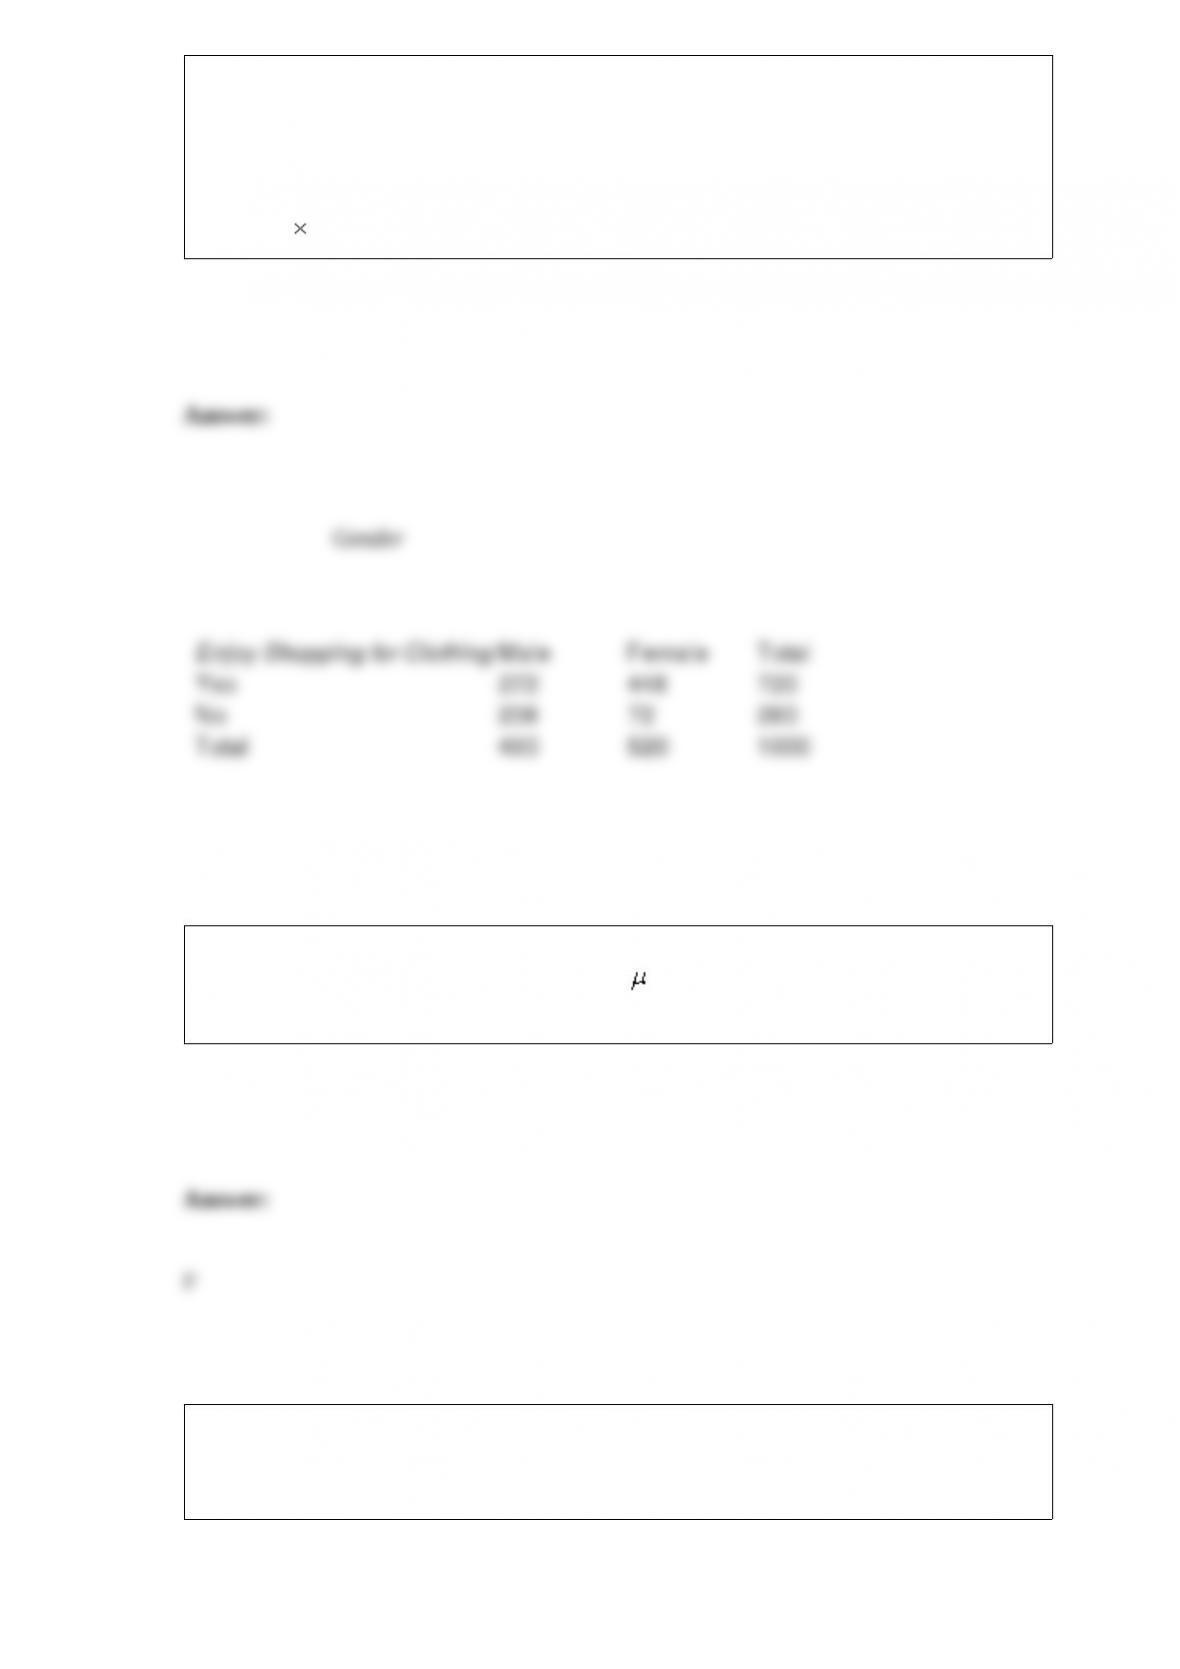
shopping for clothing?” Of 480 males, 272 answered yes. Of 520 females, 448
answered yes.
NARREND
Set up a 2 2 contingency table for this situation.
If a null hypothesis about a population mean is rejected at the 0.025 level of
significance, then it must also be rejected at the 0.01 level.
If a histogram has a single peak and looks approximately the same to the left and right
of the peak, we should expect no difference in the values of the mean, median, and
mode.

RISKMAX and RISKMIN are can be used to find the probability of meeting a given
due date in a manufacturing model.
If we use a value close to 1 for the smoothing constant in a simple exponential
smoothing model, then we expect the model to respond very slowly to changes in the
level.
NARRBEGIN: SA_98_103
The histogram below represents scores achieved by 250 job applicants on a personality
profile.
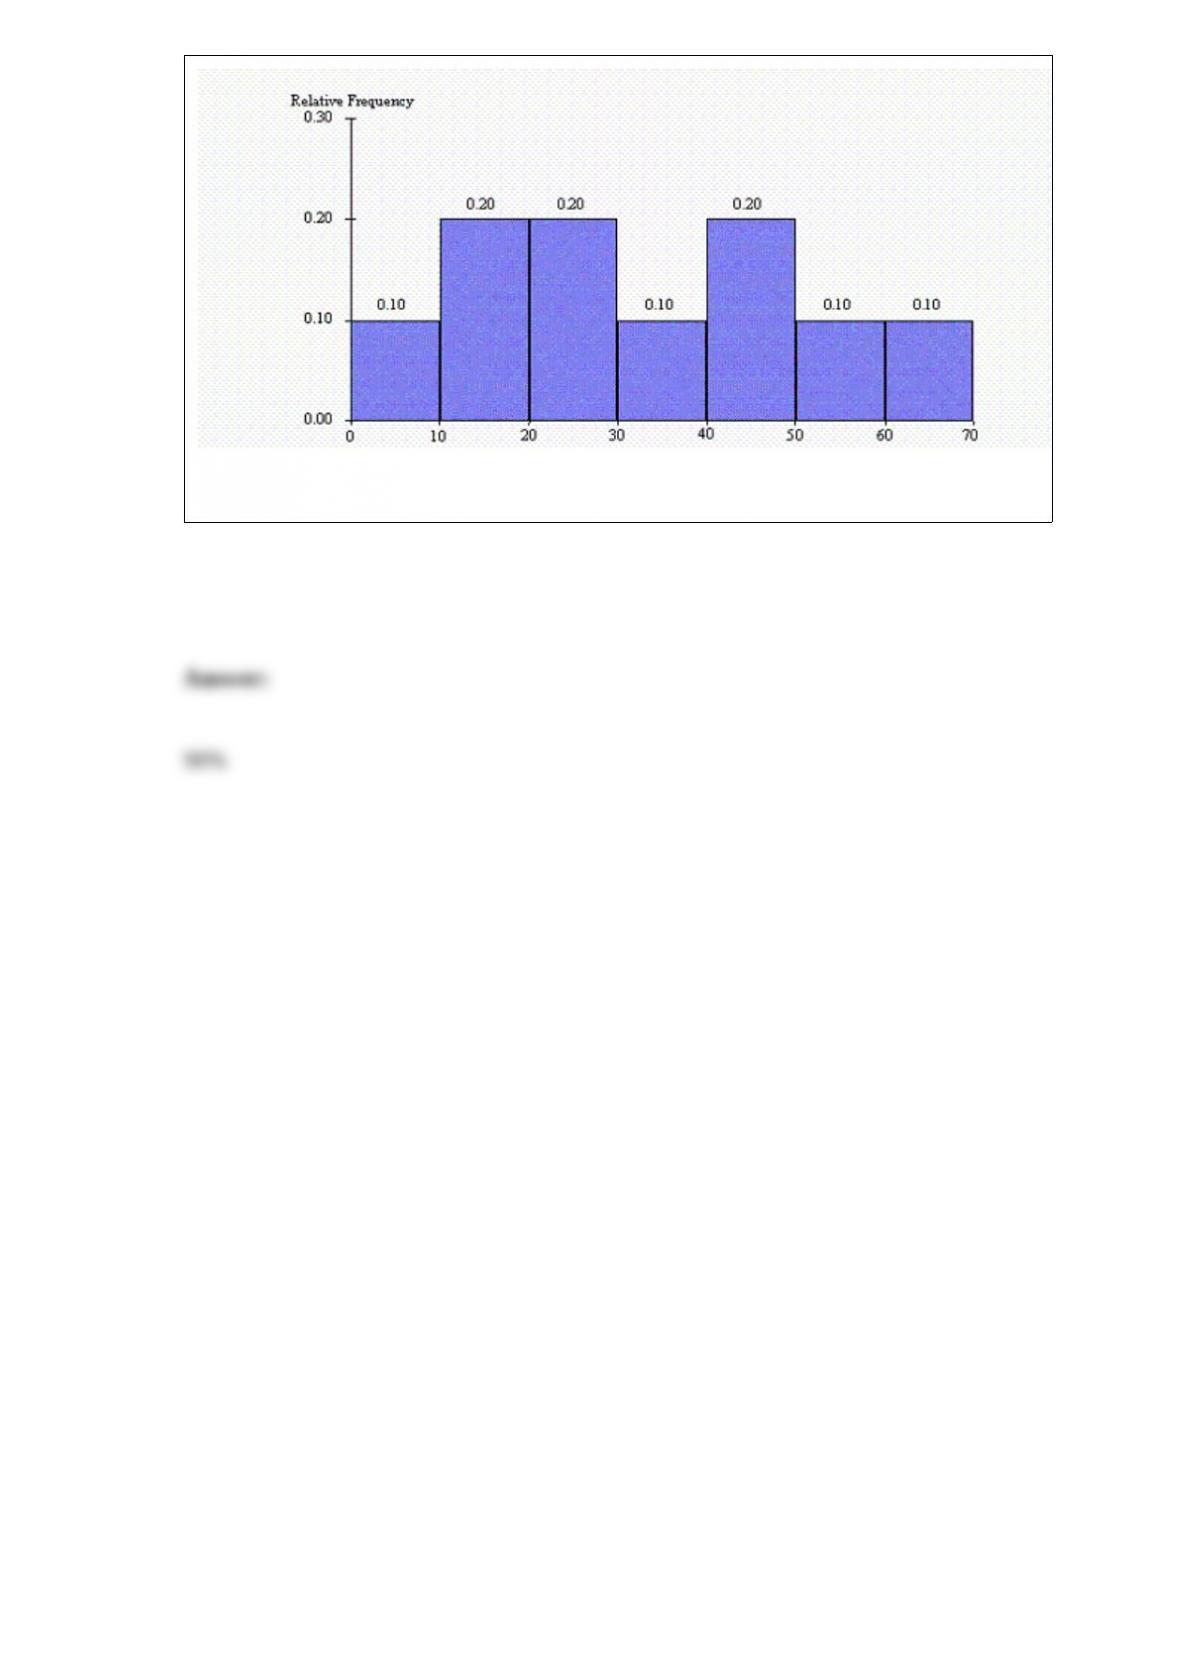
NARREND What percentage of the job applicants scored below 60?