
A(n) ____ printer is an impact printer that produces printed images when tiny wire pins
on a print head mechanism strike an inked ribbon.
a. line
b. thermal
c. NLQ
d. dot-matrix
Which of the following is an example of multimedia authoring software?
a. Adobe InDesign
b. Autodesk AutoCAD
c. Adobe Director
d. Adobe Audition
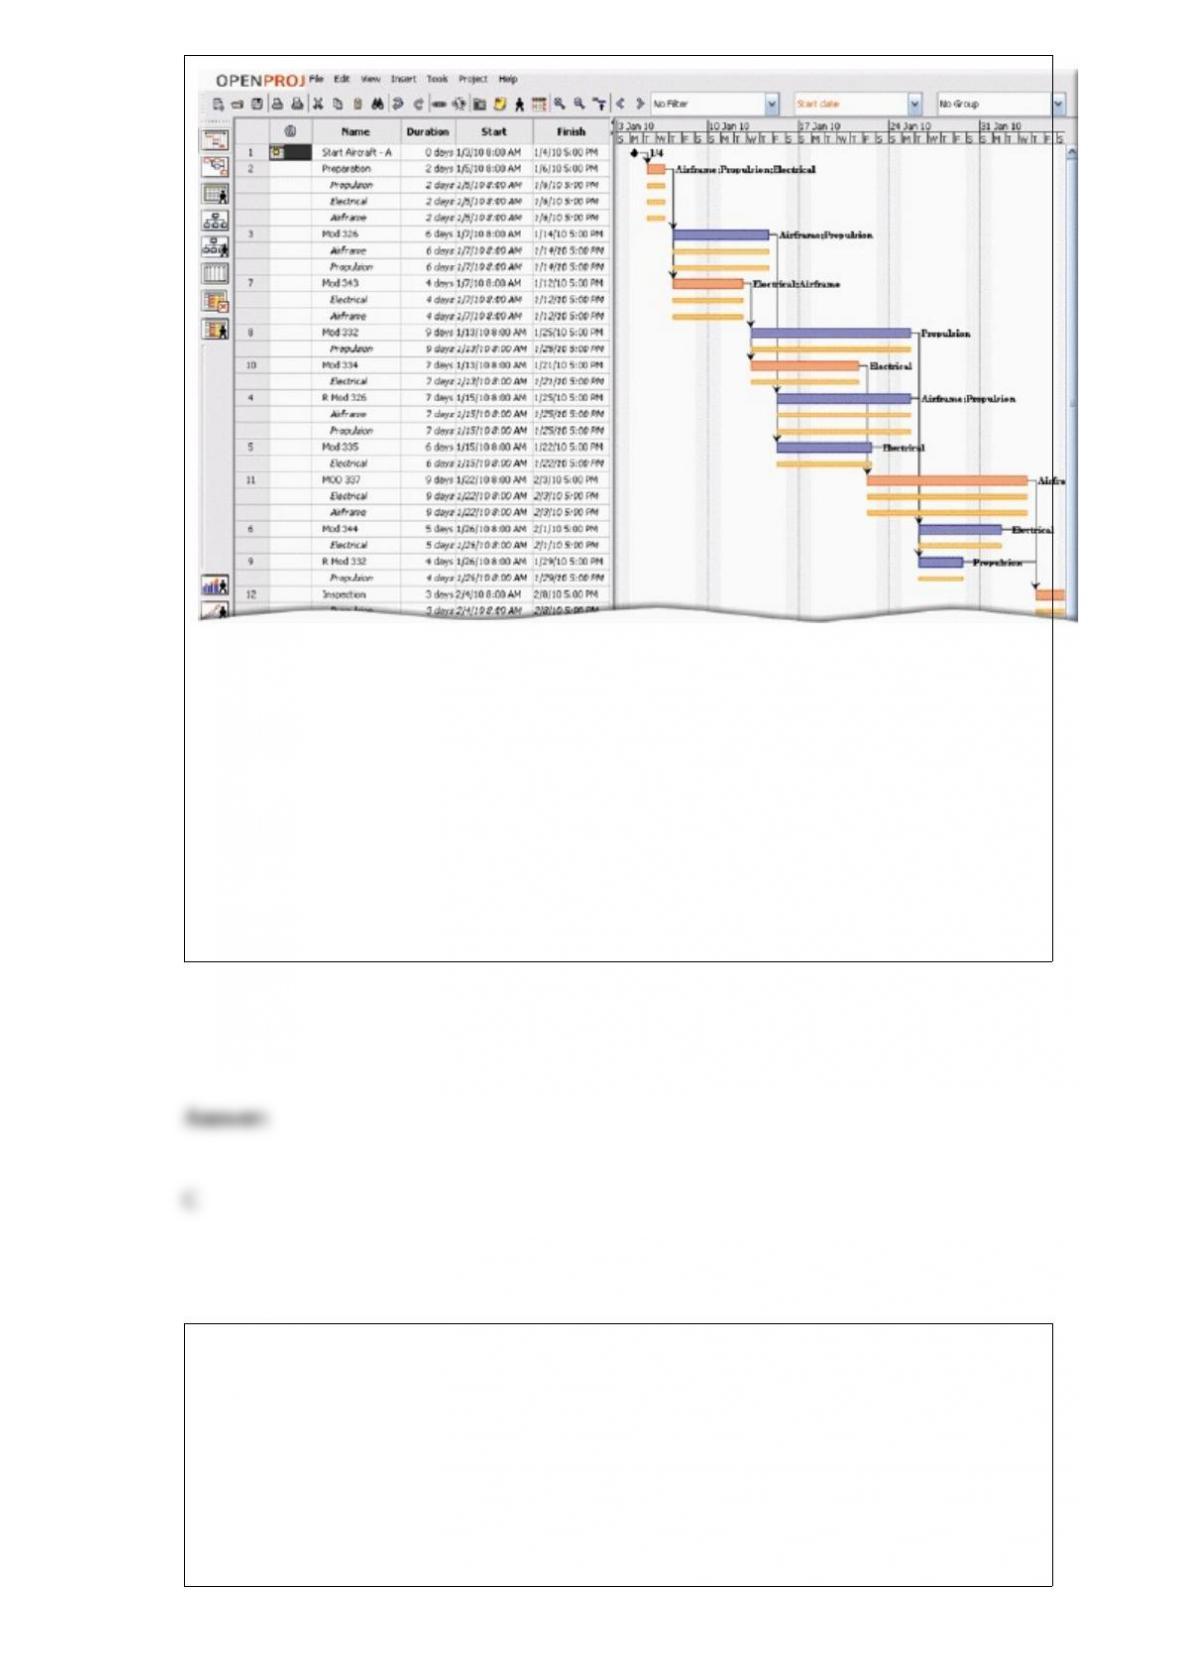
As shown in the accompanying figure, a Gantt chart, developed by Henry Gantt, is a
____.
a. diagram that graphically shows how actors interact with an information system
b. tool that graphically shows the flow of data in a system
c. bar chart that uses horizontal bars to show project phases or activities
d. table that lists a variety of conditions and the actions that correspond to them
Basic thermal printers are ____ over time.
a. inexpensive, but the print quality is low and the images tend to fade
b. inexpensive, but the print quality is high and the images tend to last
c. expensive, but the print quality is high although the images tend to fade

d. expensive, but the print quality is low although the images tend to last
To avoid items like that shown in the accompanying figure, users can sign up for ____,
which is a service from an Internet service provider that blocks e-mail messages from
designated sources.
a. an anti-spam program
b. e-mail encryption
c. an antivirus program
d. e-mail filtering
All of the following are degrees in the computer science/software engineering field
EXCEPT ____.
a. B.S.
b. M.S.
c. A.A.S.
d. Ph.D.

____ authoring software allows developers to combine text, graphics, animation, audio,
and video into an interactive presentation.
a. Multimedia
b. Graphical
c. Video
d. Animation
On larger computers, tape cartridges are mounted in a separate cabinet called a tape
____.
a. farm
b. storage unit
c. library
d. box

A(n) ____ includes any company with fewer than 50 employees, as well as the
self-employed who work from home.
a. large business user
b. enterprise user
c. SOHO
d. Any of the above
____ Certified System Administrator is an operating systems certification that tests
knowledge of administering the Solaris operating system.
a. Adobe
b. Sun
c. Novell
d. UNIX
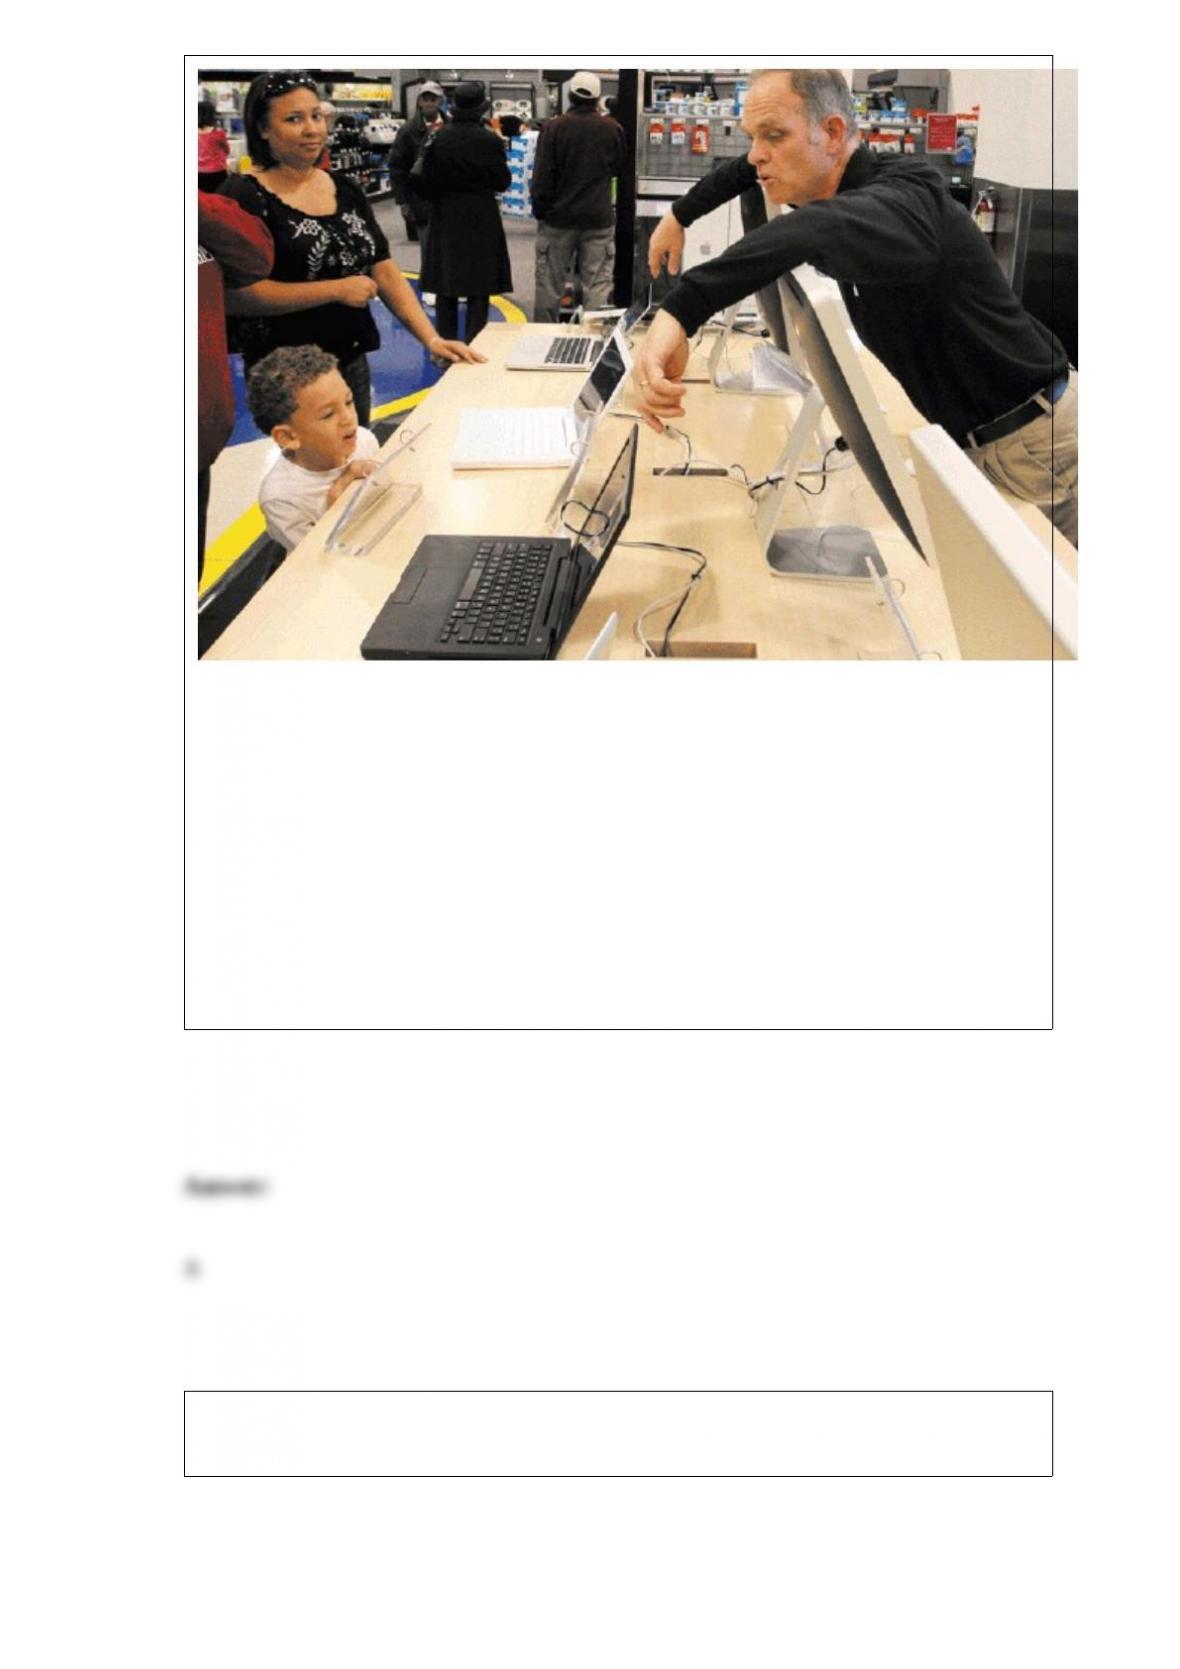
Computer ____, of which one example is shown in the accompanying figure, must have
a general understanding of computers and a specific knowledge of the product they are
selling.
a. salespeople
b. analysts
c. technicians
d. logicians
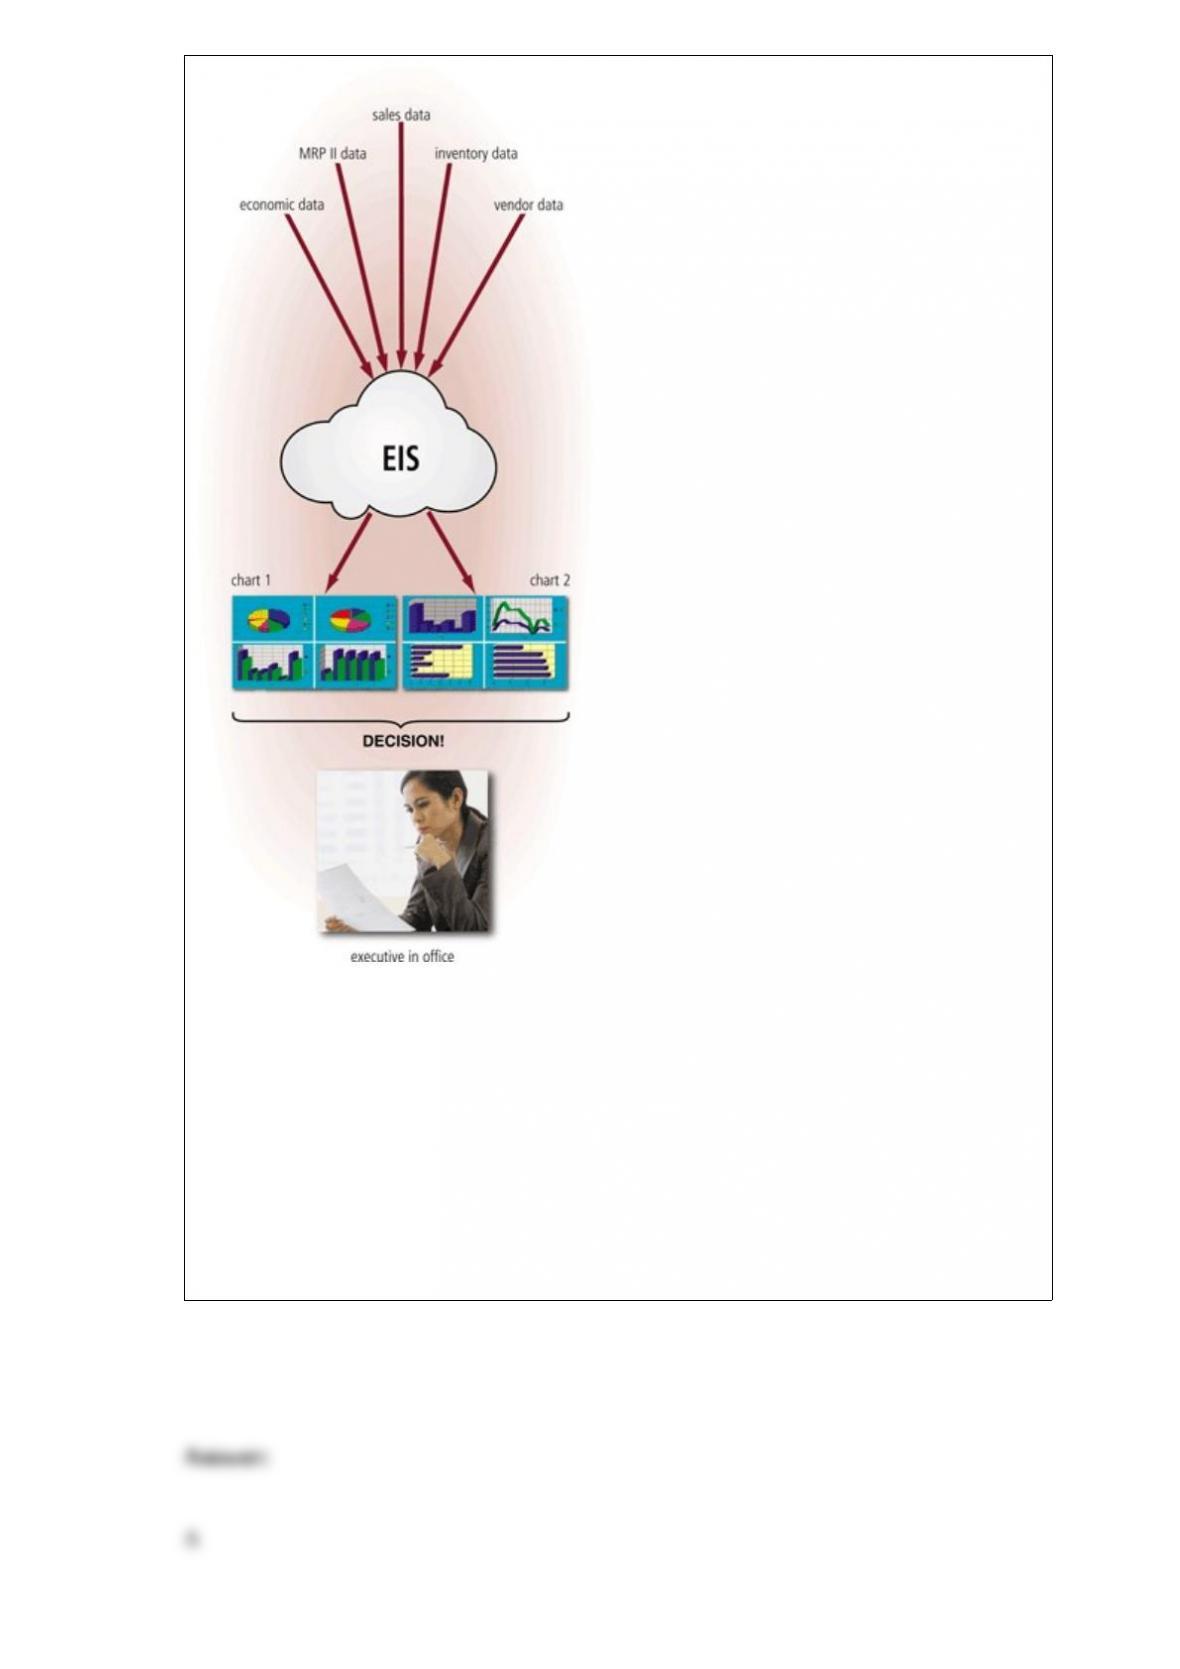
A special type of DSS (decision support system) shown in the accompanying figure,
called a(n) ____, supports the strategic information needs of executive management.
a. EIS
b. AI
c. KM
d. TPS

Case 2
It looks like you are not done yet making recommendations to your friends about
software.
Karen is looking for note taking software for her new Tablet PC. Which of the
following can she use?
a. Sage MAS 500
b. Apropos Interaction Management Suite
c. Corel Grafigo
d. PDF Converter PaperPort
IBM Certified Solutions Expert ” DB2 is a certification that tests advanced skills of
administration of the DB2 ____.
a. DBMS
b. clients
c. Web server
d. all of the above

System development life cycles often group many activities into larger categories called
____.
a. clusters
b. feature sets
c. units
d. phases
Some manufacturers market their ____________________ interfaces as Fast ATA or
Ultra ATA.
A(n) ____ model consists of rules and standards that define how a database organizes
data.
a. standards
b. data
c. rules-based
d. object-relational
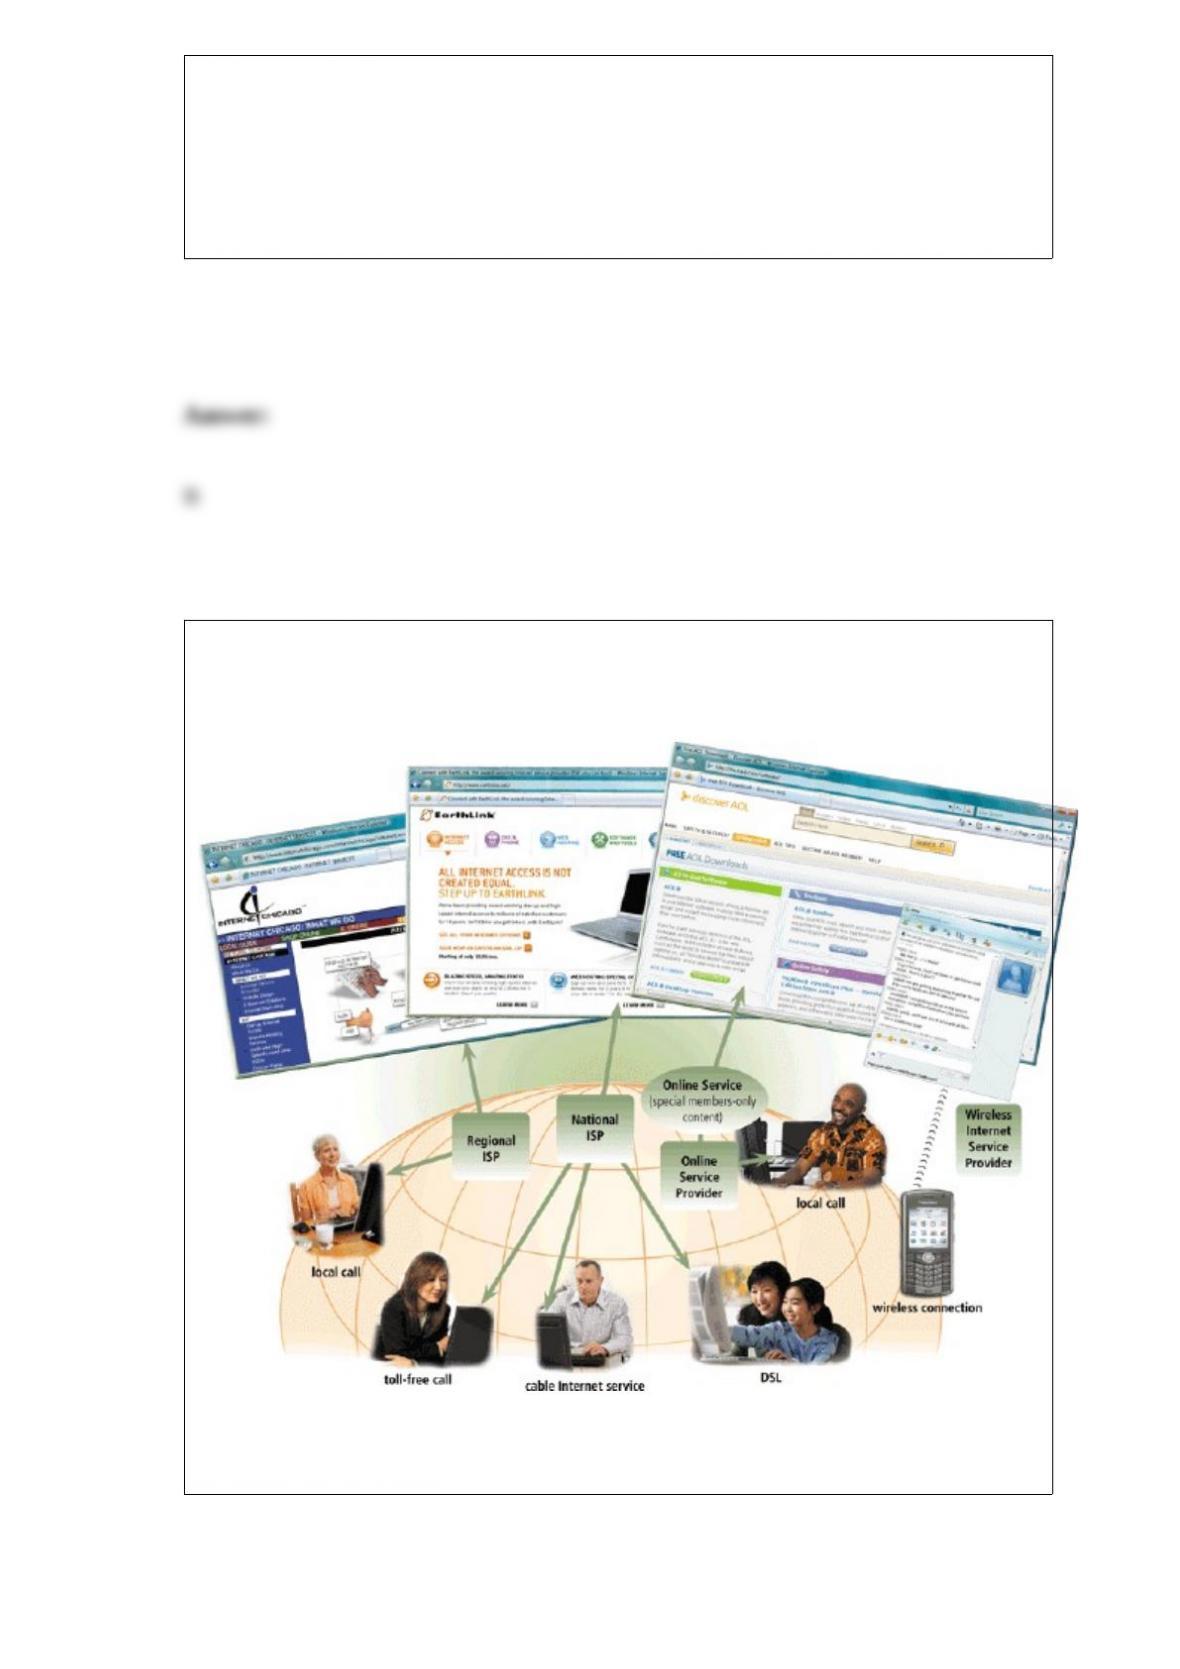
In the accompanying figure, which shows common ways to access the Internet, a(n)
____________________ usually provides Internet access to a specific geographic area.

A systems test ____.
a. verifies that each individual program works by itself
b. verifies that all programs in an application work together properly
c. verifies that an application works with other applications
d. is performed by end-users and verifies that the new system works with actual data
A(n) ____ usually lists just transactions.
a. external report
b. detailed report
c. exception report
d. summary report

In Windows Vista, the Windows ____ feature protects your computer from spyware.
a. Mata Hari
b. Defender
c. CIA
d. Protector
____ software helps companies record and report their financial transactions.
a. Tax preparation
b. Business
c. Money management
d. Accounting
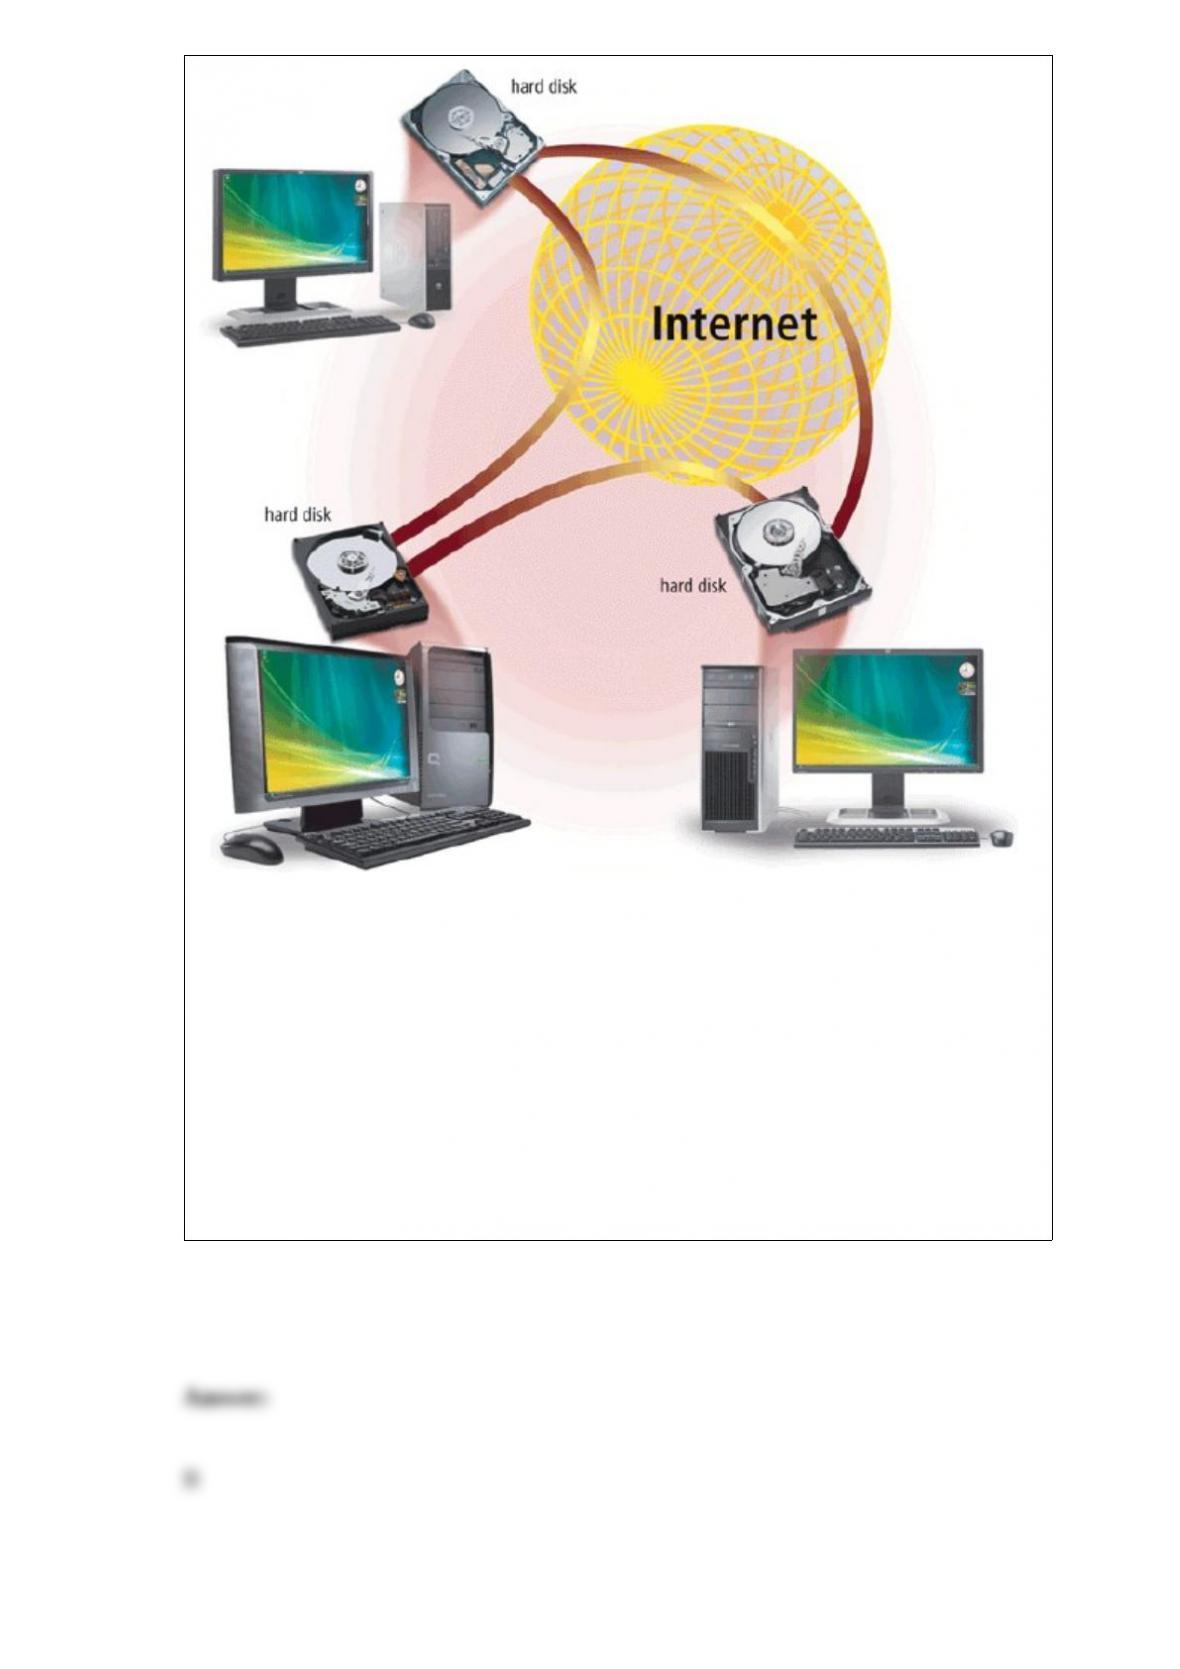
The type of peer-to-peer network shown in the accompanying figure, called a(n) ____
network, describes an Internet network on which users connect directly to each other’s
hard disks and exchange files over the Internet.
a. file
b. P2P
c. print
d. linked

____ is an object-oriented programming language that is an extension of the C
programming language
a. C+
b. C-
c. C++
d. C=
A(n) ____ is a USB network adapter, ExpressCard module, PC Card, or flash card that
enables a computer or devices to access a network.
a. EFT
b. ATM
c. NIC
d. ADSL
A(n) ____ reader converts MICR characters into a form the computer can process.
a. MICR
b. POS

c. terminal
d. OCR
____ occurs when one consumer sells directly to another consumer, such as in an online
auction.
a. Consumer-to-business (C2B) e-commerce
b. Business-to-consumer (B2C) e-commerce
c. Consumer-to-consumer (C2C) e-commerce
d. Business-to-business (B2B) e-commerce
____ occurs when someone steals personal or confidential information.
a. Plagiarism
b. Decryption
c. Information theft
d. Cyberpiracy

A(n) ____ is a private combination of characters associated with a user name that
allows access to certain computer resources.
a. folder
b. password
c. user name
d. cipher
A(n) ____ is a digital representation of nontext information such as a drawing, chart, or
photograph.
a. applet
b. pic
c. keyframe
d. graphic

____ analyst, which is a job title in the system development and programming area of
an IT department, works closely with users to analyze their requirements, designs and
develops new information systems, and incorporates new technologies.
a. Development
b. Program
c. Systems
d. Code
____ conveys meaning and is useful to one or more people.
a. Data
b. Information
c. Input
d. Output
A computer’s downtime includes any time that a computer ____.
a. crashes
b. requires installation of replacement parts
c. needs repairs
d. requires installation of upgrade parts
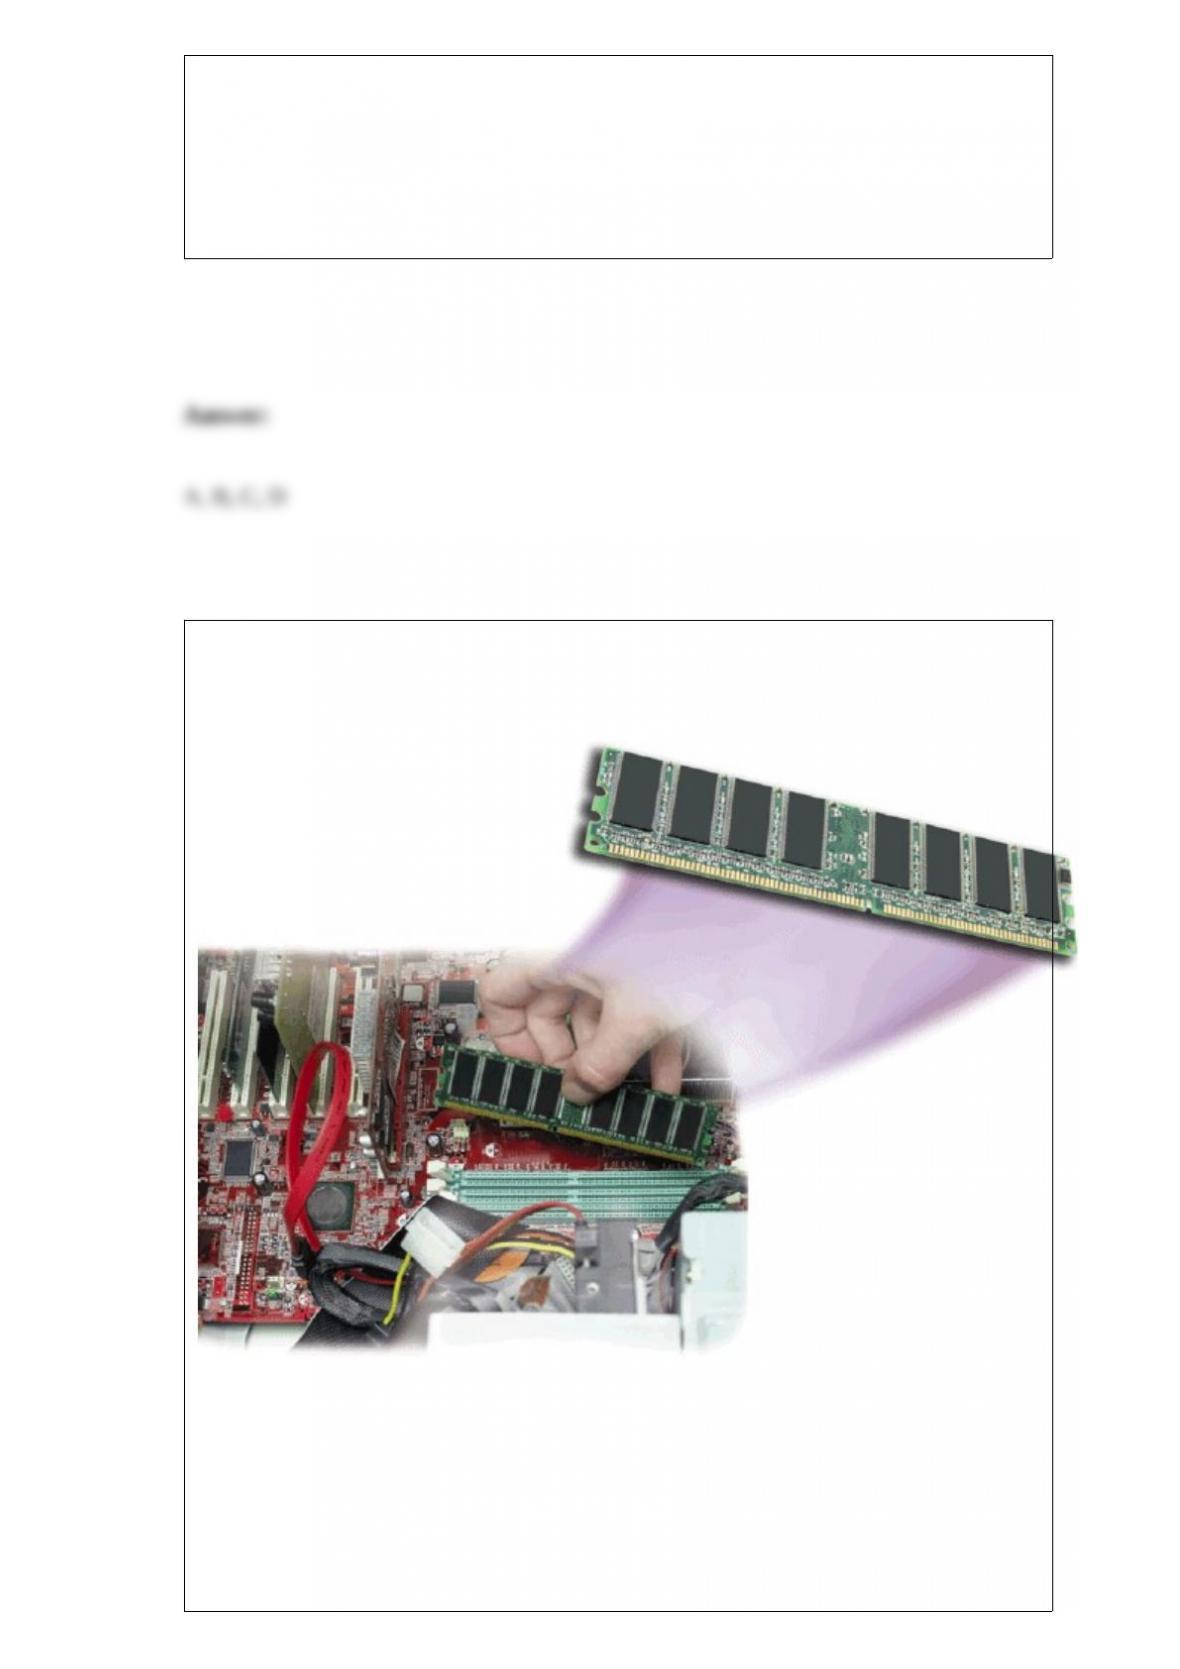
The accompanying figure shows a(n) ____ module, which is a small circuit board
where RAM chips usually reside, being inserted into the motherboard.
a. index
b. memory

c. insertion
d. cooling
Tape cartridges that contain quarter-inch-wide tape are slightly smaller than
audiocassette tapes.
Wireless transmission media are used when it is inconvenient or impossible to install
cables.
When viewing a Web page, pointing to, or positioning the pointer on, a(n)
____________________ on the screen typically changes the shape of the pointer to a
small hand with a pointing index finger.

Programmers develop programs or write the instructions that direct the computer to
process data into information.
Few Web page authoring programs allow users to organize, manage, or maintain Web
sites.
Programmers can use inspections to review solution algorithms during the program
development cycle.

Most ink-jet printers can print from 1200 to ____________________ dpi.
A nanosecond (abbreviated ns) is one ____________________ of a second.
What is TCP/IP and how does it work?

____________________ typically consists of self-directed, self-paced instruction on a
topic.
Wireless access points have high-quality antennas for optimal signals.

Few companies have their own corporate training departments.
Many handheld game consoles have touch screens.
As with an LCD monitor, the greater the video card’s bit depth, the worse the resulting
image. _________________________
When a user sends an e-mail message, an outgoing mail server that is operated by the
user’s Internet access provider determines how to route the message through the Internet
and then sends the message.

The circuitry of the system unit usually is part of or is connected to a circuit board
called the ____________________.
Intrusion detection software is quite inexpensive. _________________________
When printing a document, laser printers process and store the entire page before they
actually print it.