Unlock document.
This document is partially blurred.
Unlock all pages and 1 million more documents.
Get Access

Potential sample members, called sampling units, are:
a. people
b. companies
c. households
d. All of these options
Which of the following functions is not appropriate in cases where we run a single
simulation?
a. RISKMIN
b. RISKMAX
c. RISKPERCENTILE
d. RISKSIMTABLE
e. None of these options
Rounding the solution of a linear programming to the nearest integer values provides
a(n)
a. integer solution that is optimal

b. integer solution that may be neither feasible nor optimal
c. feasible solution that is not necessarily optimal
d. infeasible solution
Which of the following statements is true?
a. The sum of the deviations from the mean is always zero
b. The sum of the squared deviations from the mean is always zero
c. The range is always smaller than the variance
d. The standard deviation is always smaller than the variance
Many statistical packages have three types of equation-building procedures. They are:
a. forward, linear and non-linear
b. forward, backward and stepwise
c. simple, complex and stepwise
d. inclusion, exclusion and linear

In regression analysis, the variables used to help explain or predict the response
variable are called the
a. independent variables
b. dependent variables
c. regression variables
d. statistical variables
A discrete probability distribution:
a. lists all of the possible values of the random variable and their corresponding
probabilities
b. is a tool that can be used to incorporate uncertainty into models
c. can be estimated from long-run proportions
d. is the distribution of a single random variable

Sometimes it is convenient to treat a discrete probability distribution as continuous, and
vice versa.
A sample of a population taken at one particular point in time is categorized as:
a. categorical
b. discrete
c. cross-sectional
d. time-series
NARRBEGIN: SA_114_120
A chemical manufacturer produces two products, chemical X and chemical Y. Each
product is manufactured by a two-step process that involves blending and mixing in
machine A and packaging on machine B. Chemical X provides a $60/unit contribution
to profit, while Chemical Y provides a $50 contribution to profit. The processing times
for the two products on the mixing machine (A) and the packaging machine (B) are as
follows:
For the upcoming two-week period, machine A has available 80 hours and machine B
has available 60 hours of processing time. Forecasts of the markets indicate that the

manufacturer can expect to sell a maximum of 16 units of chemical X and 18 units of
chemical Y.
NARRENDWrite out an algebraic expression for the objective function in this problem.
Tossing a coin is an example of a (n)
a. binomial distribution
b. normal distribution
c. exponential distribution
d. Poisson distribution
Which of the following are possible categorizations of data type?
a. Numerical versus categorical (with subcategories nominal, ordinal)
b. Discrete versus continuous
c. Cross-sectional versus time series
d. All of these options
e. Two of these options

Which of the following is not one of the steps in the modeling process?
a. Select scale for model
b. Collect and summarize data
c. Verify the model
d. Present the results
e. Implement the model and update it through time
Identifiable subpopulations within a population are called:
a. clusters
b. samples
c. blocks
d. strata
e. None of these options

Gender and State are examples of which type of data?
a. Discrete data
b. Continuous data
c. Categorical data
d. Ordinal data
is the:
a. addition rule
b. commutative rule
c. rule of complements
d. rule of opposites

The t-distribution for developing a confidence interval for a mean has _____ degrees of
freedom.
a. n + 2
b. n +1
c. n
d. n " 1
e. n - 2
NARRBEGIN: SA_94_95
Suppose that you are an entrepreneur interested in establishing a new Internet-based
auction service. Furthermore, suppose that you have gathered basic demographic
information on a large number of Internet users. You currently have information on
1000 individuals related to their gender, age, education, marital status, annual
household income, and number of people in household. Assume that these individuals
were carefully selected through stratified sampling.
NARREND
(A) To assess potential interest in your proposed enterprise, you would like to conduct
telephone interviews with a representative subset of the 1000 Internet users. How would
you proceed to stratify the given frame of 1000 individuals to choose 50 for telephone
interviews? Explain your approach.
(B) Explain how you could apply cluster sampling to obtain a sample size of 50 from
this frame. What are the advantages and disadvantages of employing cluster sampling
in this case?

In regression analysis, which of the following causal relationships are possible?
a. X causes Y to vary
b. Y causes X to vary
c. Other variables cause both X and Y to vary
d. All of these options
Given the least squares regression line,
a. the relationship between X and Y is positive
b. the relationship between X and Y is negative
c. as X increases, so does Y
d. as X decreases, so does Y
e. there is no relationship between X and Y
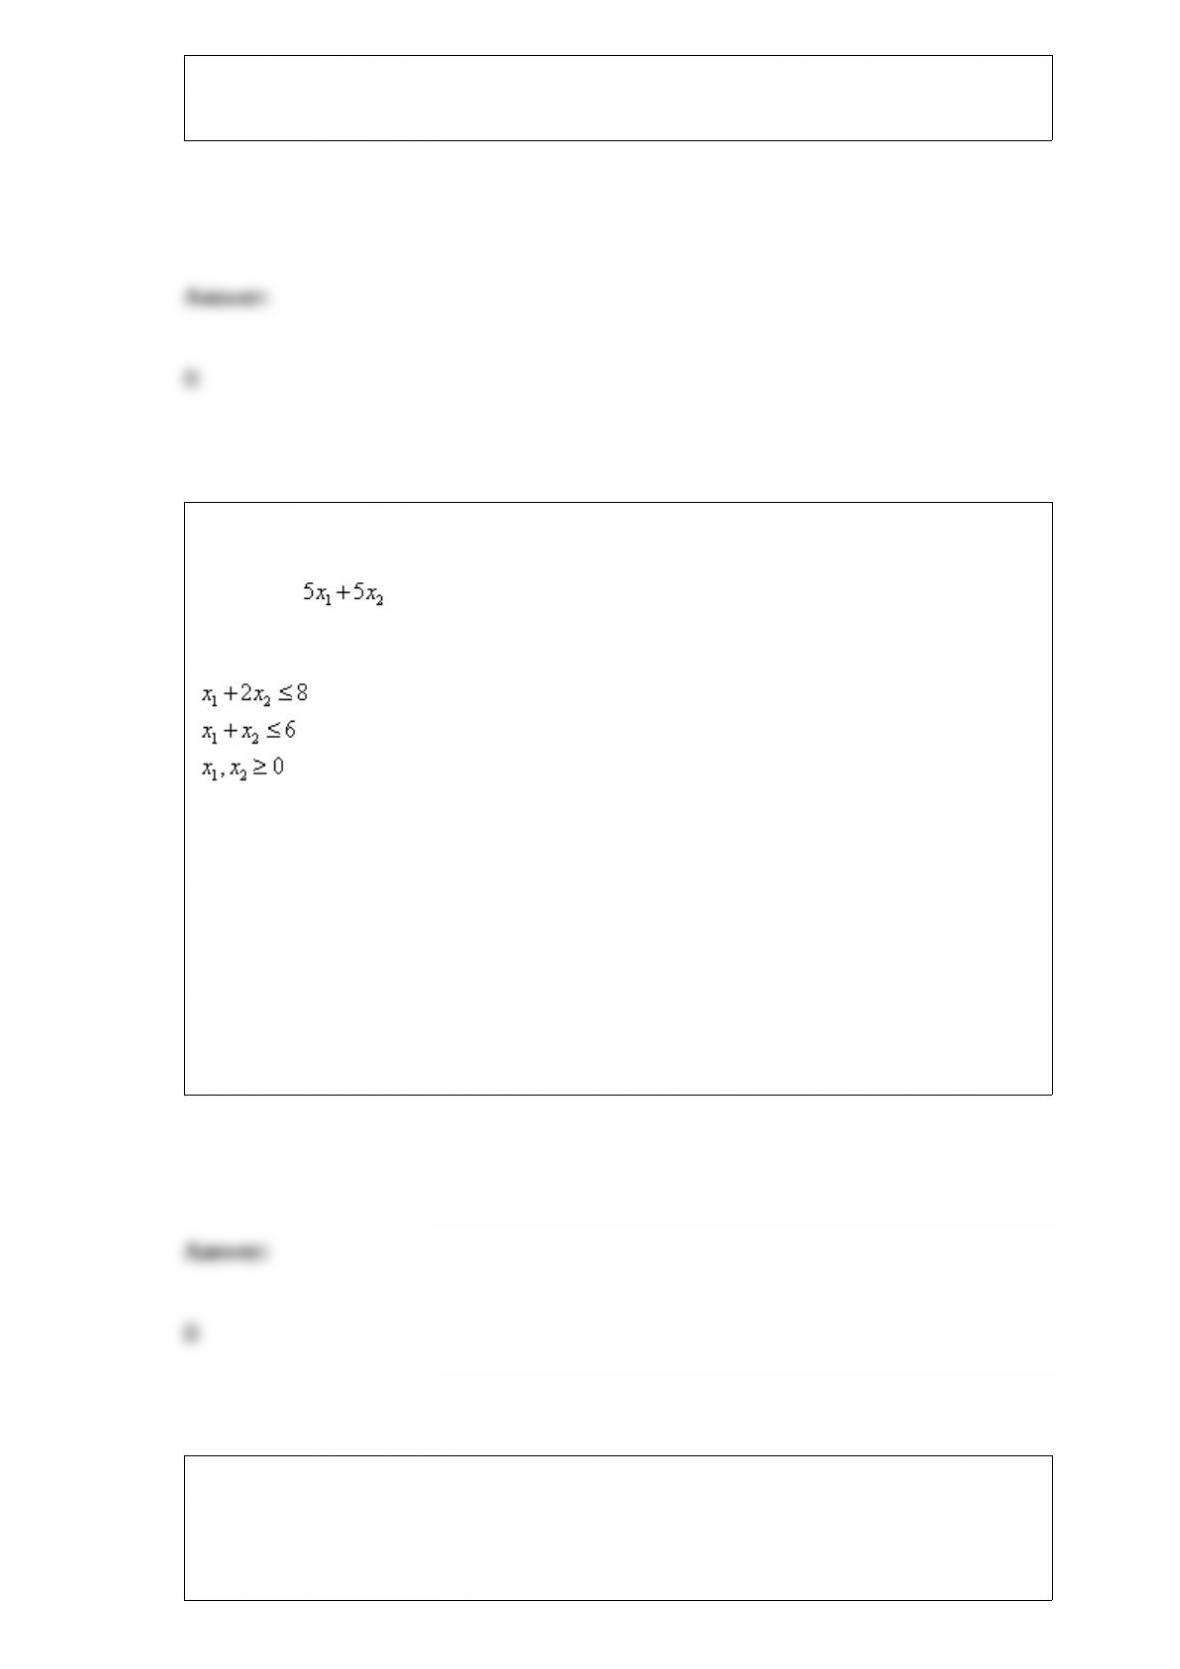
Consider the following linear programming problem:
Maximize
Subject to
The above linear programming problem:
a. has only one optimal solution
b. has more than one optimal solution
c. exhibits infeasibility
d. exhibits unboundedness
A scatterplot that appears as a shapeless mass of data points indicates:
a. a curved relationship among the variables

b. a linear relationship among the variables
c. a nonlinear relationship among the variables
d. no relationship among the variables
NARRBEGIN: SA_62_64
Q-Mart is interested in comparing its male and female customers. Q-Mart would like to
know if its female charge customers spend more money, on average, than its male
charge customers. They have collected random samples of 25 female customers and 22
male customers. On average, women charge customers spend $102.23 and men charge
customers spend $86.46. Some information are shown below.
NARREND
(A) Use a t - value of 2.014 to calculate a 95% confidence interval for the difference
between the average female purchase and the average male purchase. Would you
conclude that there is a significant difference between females and males in this case?
Explain.
(B) What are the degrees of freedom for the t-multiple in this calculation? Explain how
you would calculate the degrees of freedom in this case.

(C) What is the assumption in this case that allows you to use the pooled standard
deviation for this confidence interval?
Which of the following is not one of the types of models described in Data Analysis &
Decision Making book?
a. Algebraic model
b. Spreadsheet model
c. Scale model
d. Graphical model

The null hypothesis usually represents the:
a. theory the researcher would like to prove.
b. preconceived ideas of the researcher
c. perceptions of the sample population
d. status quo
If we want to model the monthly return on a stock, we might choose
a. symmetric distribution around 0
b. positively skewed distribution
c. negatively skewed distribution
d. All of these options
Which of the following is not one of the important themes of your Data Analysis &
Decision Making book?
a. Data analysis
b. Dealing with uncertainty
c. Decision making
d. Data mining

A continuous probability distribution is characterized by:
a. a list of possible values
b. counts
c. an array of individual values
d. a continuum of possible values
There are a variety of deseasonalizing methods, but they are typically variations of:
a. ratio-to-seasonality methods
b. ratio-to-exponential-smoothing methods
c. ratio-to-moving-average methods
d. linear trend

Which of the following statements are false regarding the graph of a continuous
probability distribution?
a. It is characterized by a density function, a smooth curve.
b. It is a series of spikes
c. The height of the density curve above any point is not actually a probabilitythat is, it
is not necessarily between 0 and 1.
d. Heights above the density function indicate relative likelihoods but are not
necessarily values between 0 and 1.
The expected value of sample information (EVSI) is equal to:
a. EMV with posterior information " EMV with prior information
b. EMV with free perfect information " EMV free information
c. EMV with perfect information " EMV without information
d. EMV with free information " EMV without information
e. None of these options

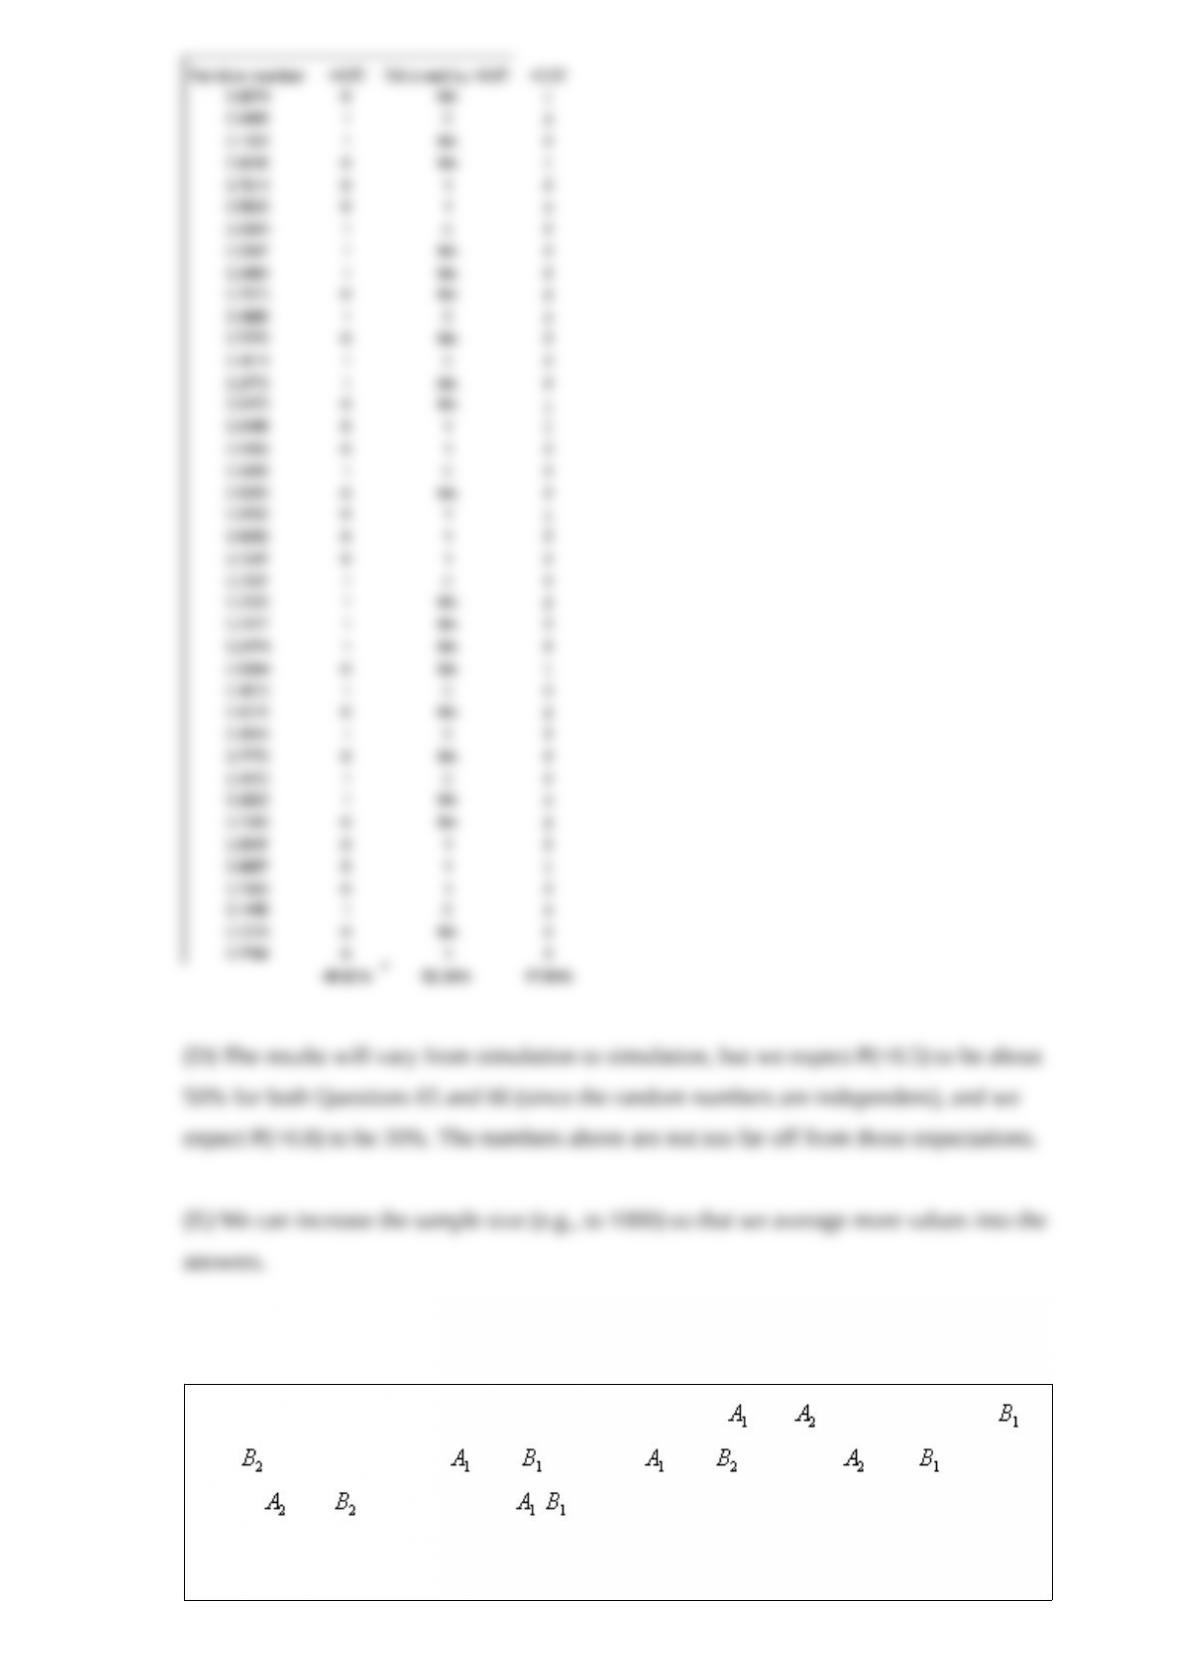
NARRBEGIN: SA_65_70
Generate a set of 40 random numbers in a column in an Excel spreadsheet by using
RAND function. Fix the set of random numbers by copying the column to another
column and using the "Paste Special" command with the "Values" option selected.
NARREND
(A) What fraction of the random numbers are smaller than 0.5?
(B) What fraction of the time is a random number less than 0.5 followed by another
random number less than 0.5?
(C) What fraction of the random numbers are larger than 0.8?
(D) What do you expect the answers to (A), (B) and (C) to be before simulating? Do the
answers you provided to those questions match your expectations? Explain why or why
not.
(E) Suppose your answers to (A), (B) and (C) are not close to the expected answers.
What can you do to obtain answers from the simulation that are closer to the expected
answers?
The joint probabilities shown in a table with two rows, and and two columns,
and , are as follows: P( and ) = .10, P( and ) = .30, P( and ) = .05,
and P( and ) = .55. Then P( | ), calculated up to two decimals, is
a. .33

b. .35
c. .65
d. .67
Two events A and B are said to mutually be exclusive if P(A and B)= 0.
If the objective function has the equation , then the y-intercept of the
objective function line is 40:
The seasonal component of a time series is harder to predict than the cyclic component;
the reason is that cyclic variation is much more regular.

The trend line was calculated from quarterly data for 2000 " 2004,
where t = 1 for the first quarter of 2000. The trend value for the second quarter of the
year 2005 is 0.75.
Scatterplots are used for identifying outliers and quantifying relationships between
variables.
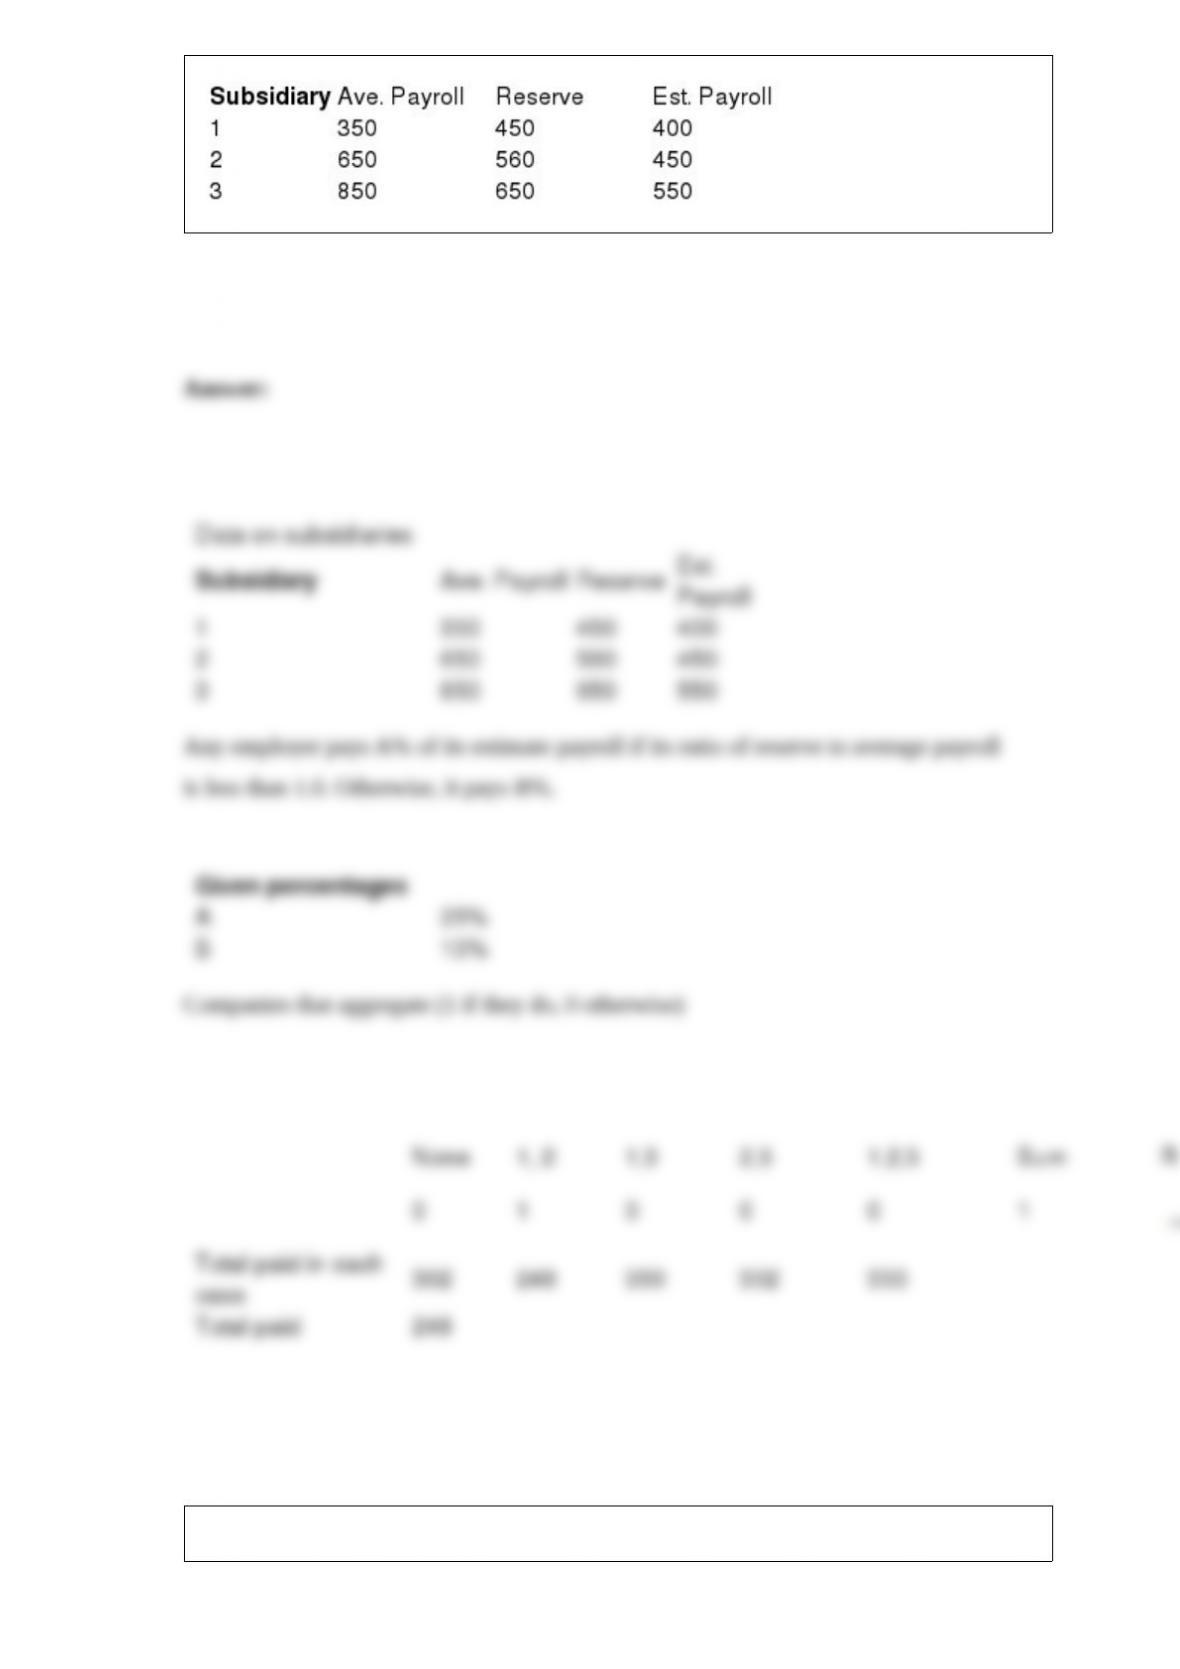
A Michigan company consists of three subsidiaries. Each has the respective average
payroll, unemployment reserve fund, and estimated payroll shown in the table below
(all figures are in millions of dollars). Any employer in the state of Michigan whose
reserve to average payroll ratio is less than 1 must pay 25% of its estimated payroll in
unemployment insurance premiums. Otherwise, if the ratio is at least one, the employer
pays 13%. The company can aggregate its subsidiaries and label them as separate
employers. For example, if subsidiaries 1 and 2 are aggregated, they must pay 25% of
their combined payroll in unemployment insurance premiums. Determine which
subsidiaries should be aggregated.
Churn is an example of the type of uncertain variable we deal with in financial models.

In a simple regression analysis, if the standard error of estimate = 15 and the number
of observations n = 10, then the sum of the residuals squared must be 120.
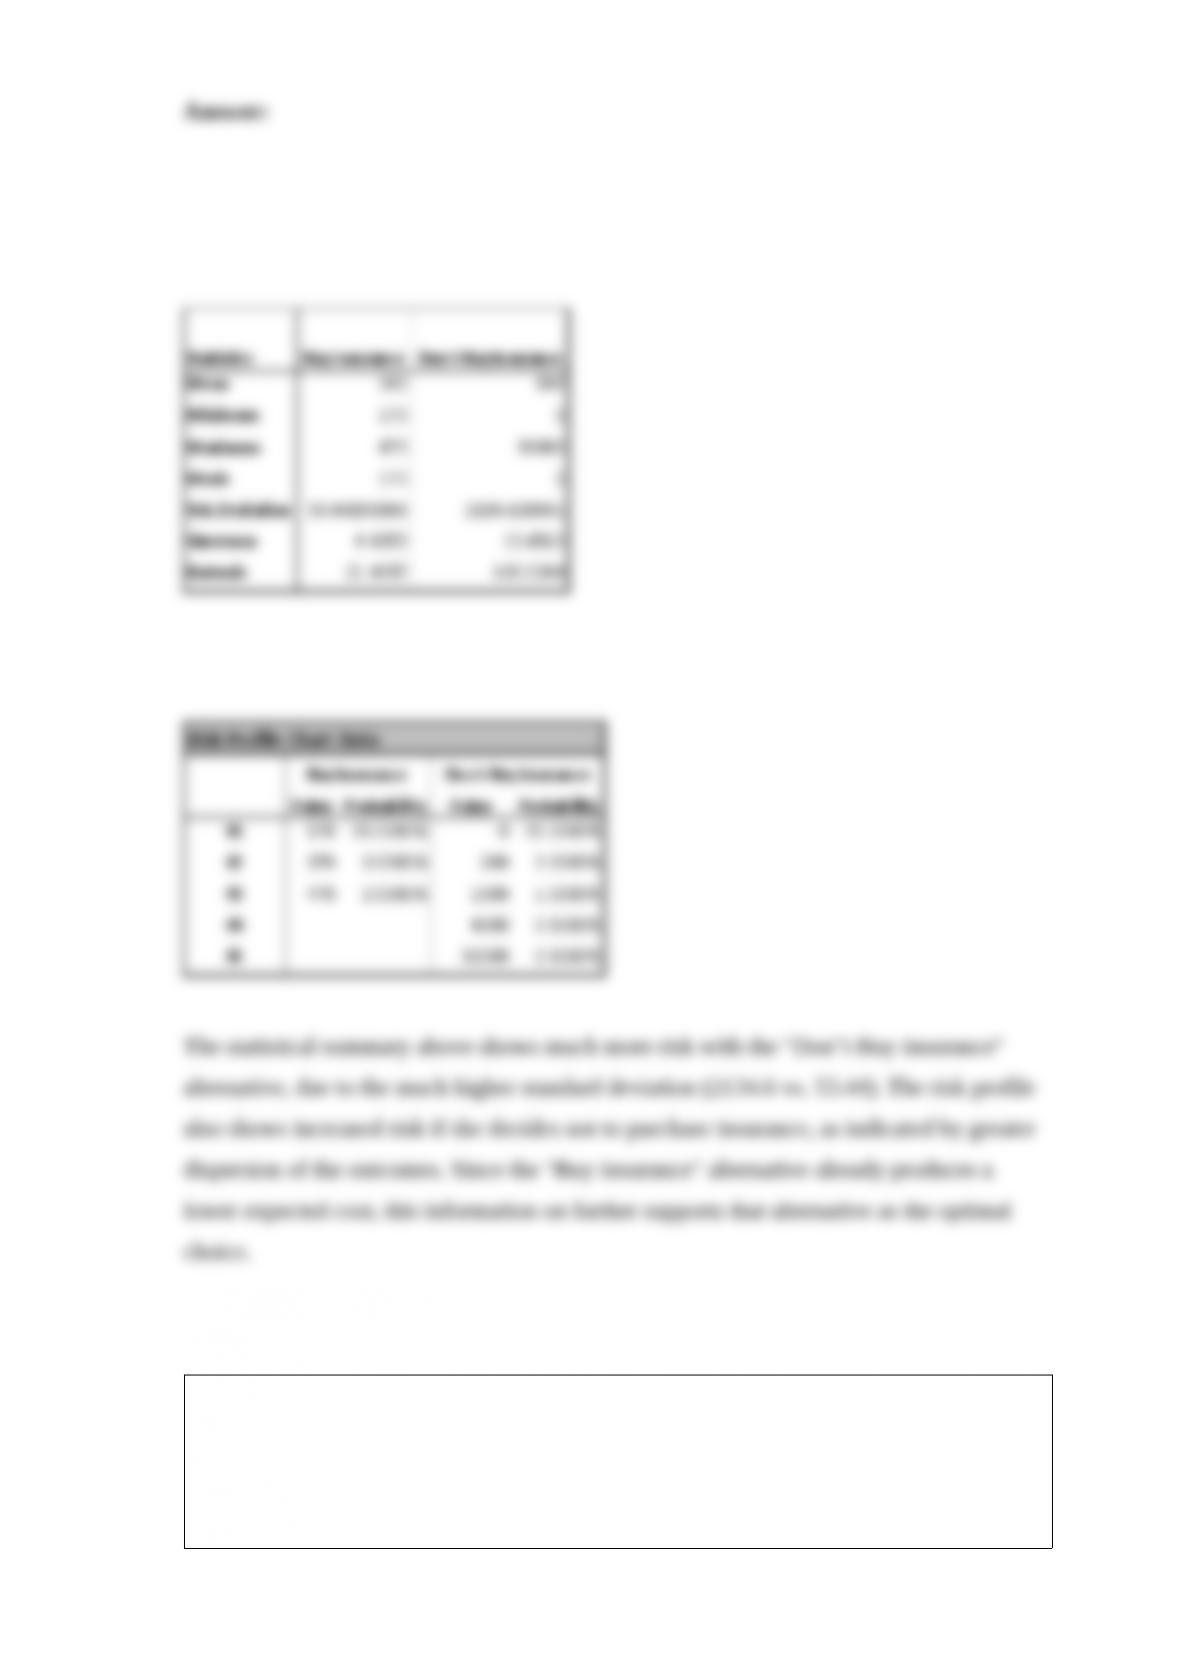
NARRBEGIN: SA_104_112
Mrs. Rich has just bought a new $30,000 car. As a reasonably safe driver, she believes
that there is only a 5% chance of being in an accident in the forthcoming year. If she is
involved in an accident, the damage to her new car depends on the severity of the
accident. The probability distribution for the range of possible accidents and the
corresponding damage amounts (in dollars) are shown in the table below. Mrs. Rich is
trying to decide whether she is willing to pay $170 each year for collision insurance
with a $300 deductible. Note that with this type of insurance, she pays the first $300 in
damages if she causes an accident, and the insurance company pays the remainder.
Distribution of Accident Types and Corresponding Damage Amounts
NARREND
Generate a statistical summary and risk profile for each of Mrs. Rich's possible
decisions. Does this information impact her decision?
NARRBEGIN: SA_89_91
The number of employees on the payroll at a computer software company is recorded at
the start of each month from January 2007 to December 2009. These data are shown
below.
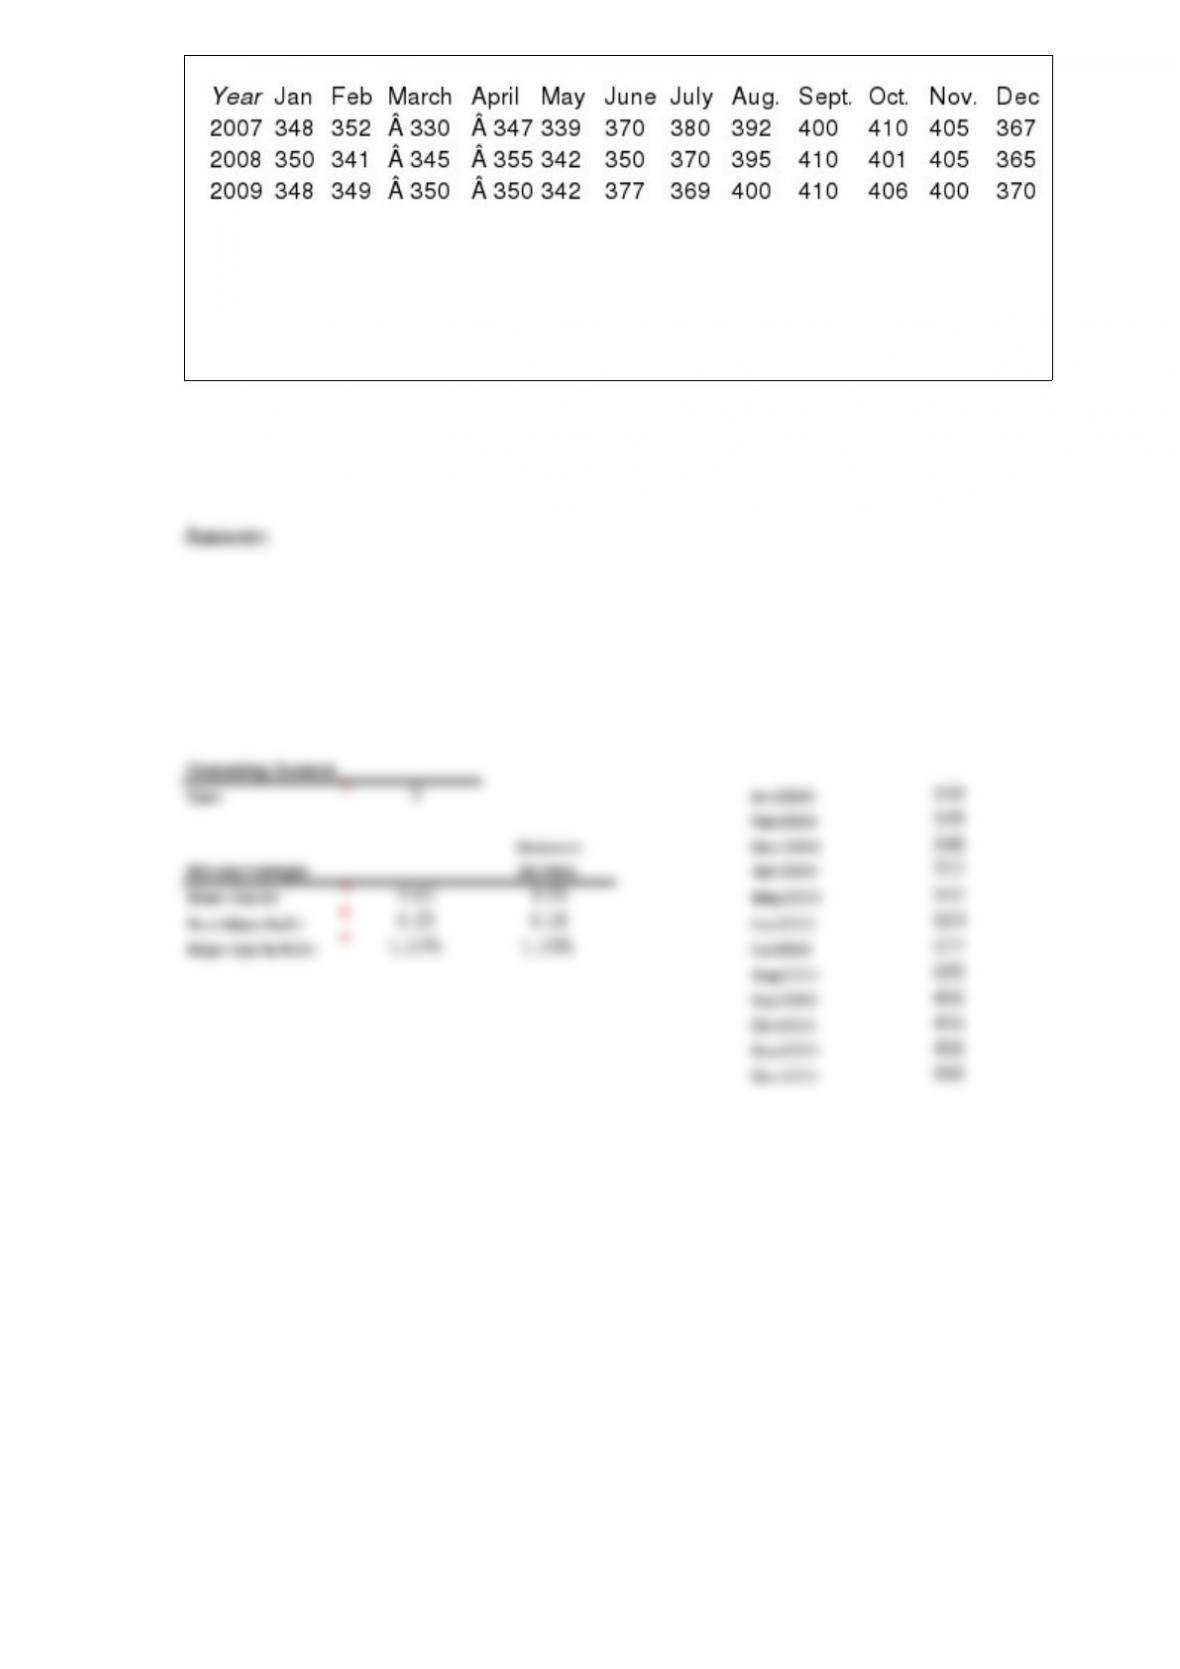
NARREND
Use the method of moving averages with an appropriate span to forecast retail sales for
2010. Do you obtain a good fit? Do you have confidence in your forecast? Explain your
answers.

In a multiplicative seasonal model, we multiply a "base" forecast by an appropriate
seasonal index. These indexes, one for each season, typically average to 1.
As the average monthly revenue associated with the rock format and an A1 audience
varies between about $142,500 and $200,000, what happens to the maximum expected
revenue? Briefly explain why.
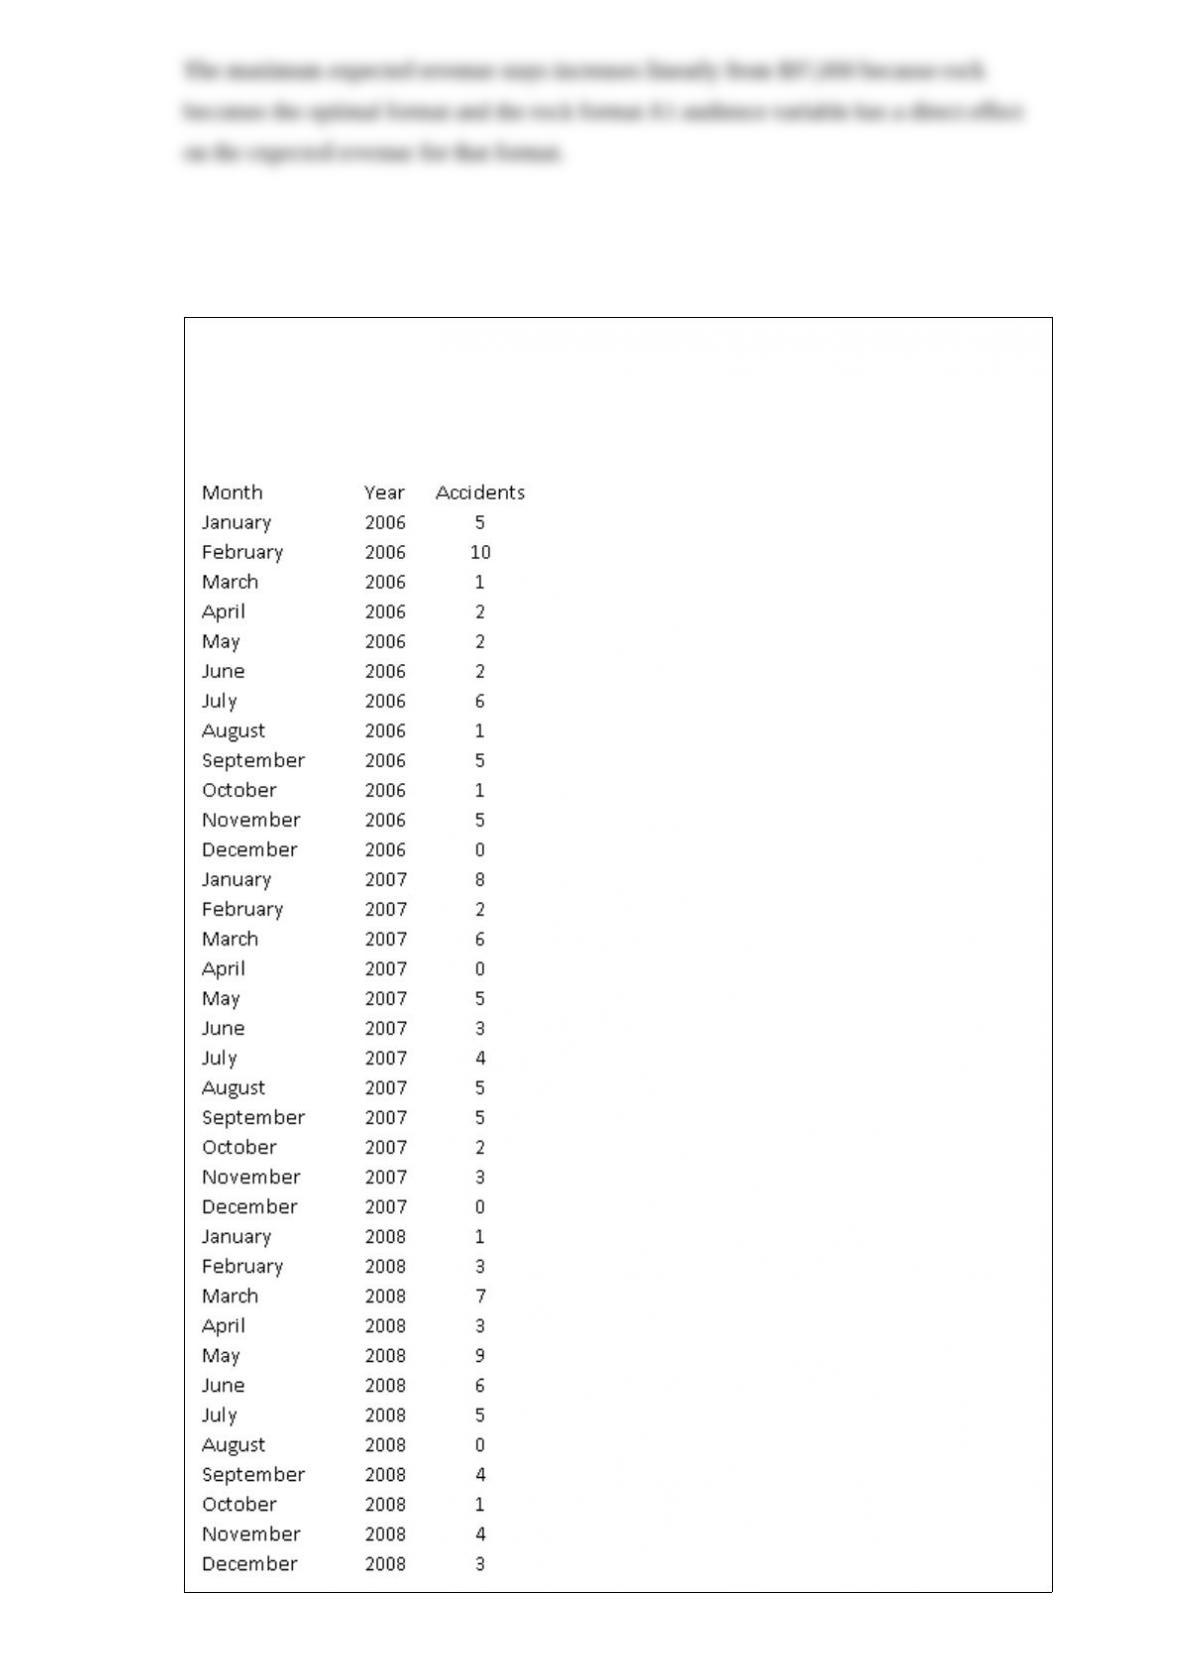
The number of reported accidents at a manufacturing plant located in Flint, Michigan,
was recorded at the start of each month. These data are provided in the table below:

Is this time series random? Perform a runs test and compute a few autocorrelations to
support your answer.
A meandering pattern is an example of a random time series.

Ideally, we prefer estimates that have large standard errors.


