Three important themes run through this book: data analysis, decision-making, and
dealing with uncertainty.
NARRBEGIN: SA_57_64
Amanda is a recent college graduate, and has just started her first job. She would like to
know if she saves $5,000 per year out of her salary over the next 30 years what the
distribution of the value of her retirement fund after 30 years. She has decided that she
will invest all her money in the stock market that she estimates has a return that is
normally distributed with mean 12% per year and standard deviation 25%.
NARREND
What is the standard deviation of the ending balance? What does the distribution look
like? What should Amanda infer from this?
In a simple linear regression problem, if the percentage of variation explained is
0.95, this means that 95% of the variation in the explanatory variable X can be
explained by regression.
NARRBEGIN: SA_113_120
An oil company is planning to drill three exploratory wells in different areas of West
Texas. The company estimates that each of these wells, independent of the others, has
about a 30% chance of being successful.
NARREND
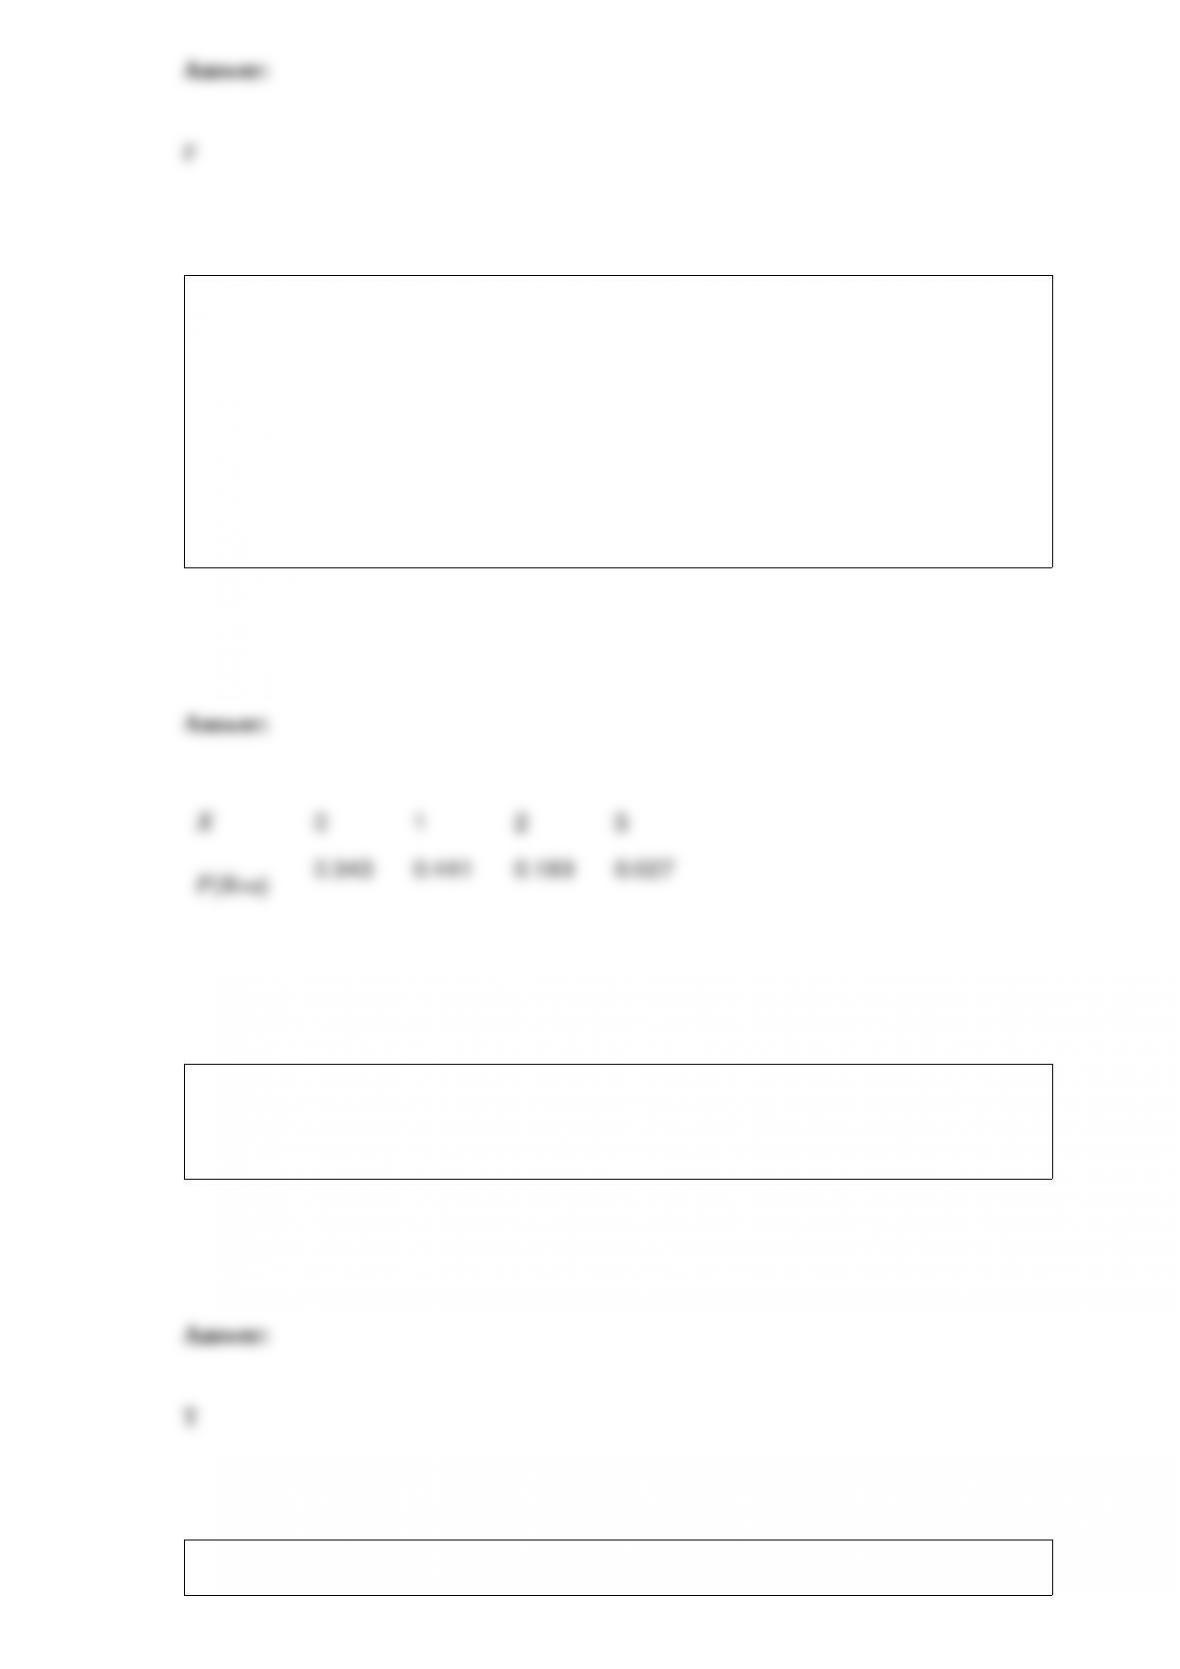
Find the probability distribution of X; the number of oil wells that will be successful.
A correlation matrix must always have 1’s along its diagonal (because a variable is
always perfectly correlated with itself) and the correlations between variables
elsewhere.
A key objective in cash flow models is often to determine the amount of debt that must
be taken out to maintain a minimum cash balance.
NARRBEGIN: SA_104_113
Suppose that patrons of a restaurant were asked whether they preferred beer or whether
they preferred wine. 60% said that they preferred beer. 70% of the patrons were male.
80% of the males preferred beer.
NARREND
Suppose a randomly selected patron prefers beer. What is the probability the patron is a
male?
Solver may be unable to solve some integer programming problems, even when they
have an optimal solution.

NARRBEGIN: SA_56_61
A popular retail store knows that the distribution of purchase amounts by its customers
is approximately normal with a mean of $30 and a standard deviation of $9. Below you
will find normal probability and percentile calculations related to the customer purchase
amounts.
Probability Calculations
P(Sales < $ 15.00) = 0.048, P(Sales < $ 20.00) = 0.133,
P(Sales < $ 25.00) = 0.289, P(Sales < $ 35.00) = 0.711
Percentiles Calculations
1st Percentile = $9.06, 5th Percentile = $15.20,
95th Percentile = $44.80, 99th Percentile = $50.94
NARREND
What is the probability that a randomly selected customer will spend $30 or more?
Graphical models are probably the least intuitive and most quantitative type of model.
When formulating a linear programming spreadsheet model, we specify the constraints
in a Solver dialog box, since Excel does not show the constraints directly.
NARRBEGIN: SA_87_90
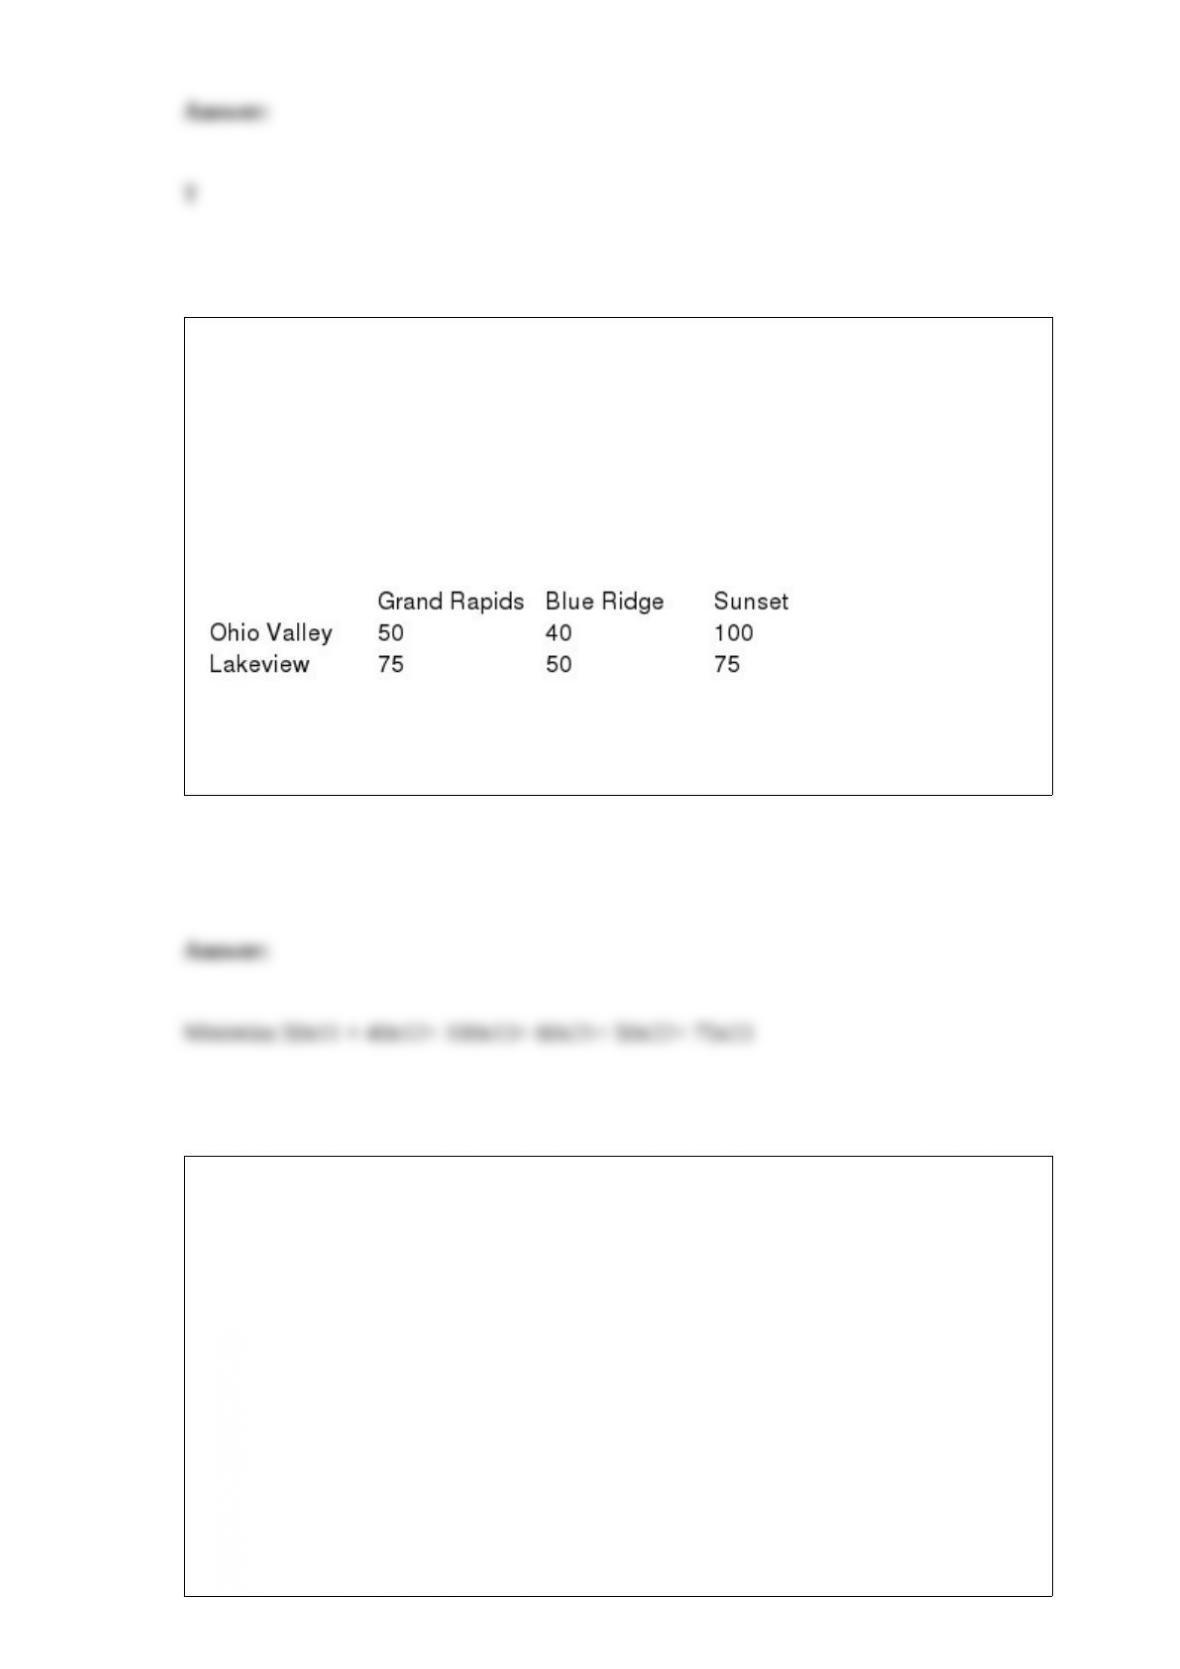
Sinclair Plastics operates two chemical plants which produce polyethylene; the Ohio
Valley plant which produces 5000 tons per month and the Lakeview plant which can
produce 7000 tons per month. Sinclair sells its polyethylene to three different GM auto
plants, Grand Rapids (demand = 3000 tons per month), Blue Ridge (demand = 5000
tons per month), and Sunset (demand = 4000 tons per month). The costs of shipping
between the respective plants is shown in the table below:
NARREND
What is the objective function in this problem?
NARRBEGIN: SA_78_85
Suppose we want to choose capacity for a plant that will produce a new drug. In
particular, we want to choose the capacity that maximizes discounted expected profit
over the next 10 years. We have the following information:
Demand for the drug is expected to be normally distributed ~ Normal (50,000, 12,000).
A unit of capacity costs $16 to build.
The number of units produced will equal the demand, up to capacity limits.
The revenue per unit is $3.70 and the cost per unit is $0.20 (variable cost).
The maintenance cost per unit of capacity is $0.40 (fixed cost).
The discount rate is 10%.
NARREND
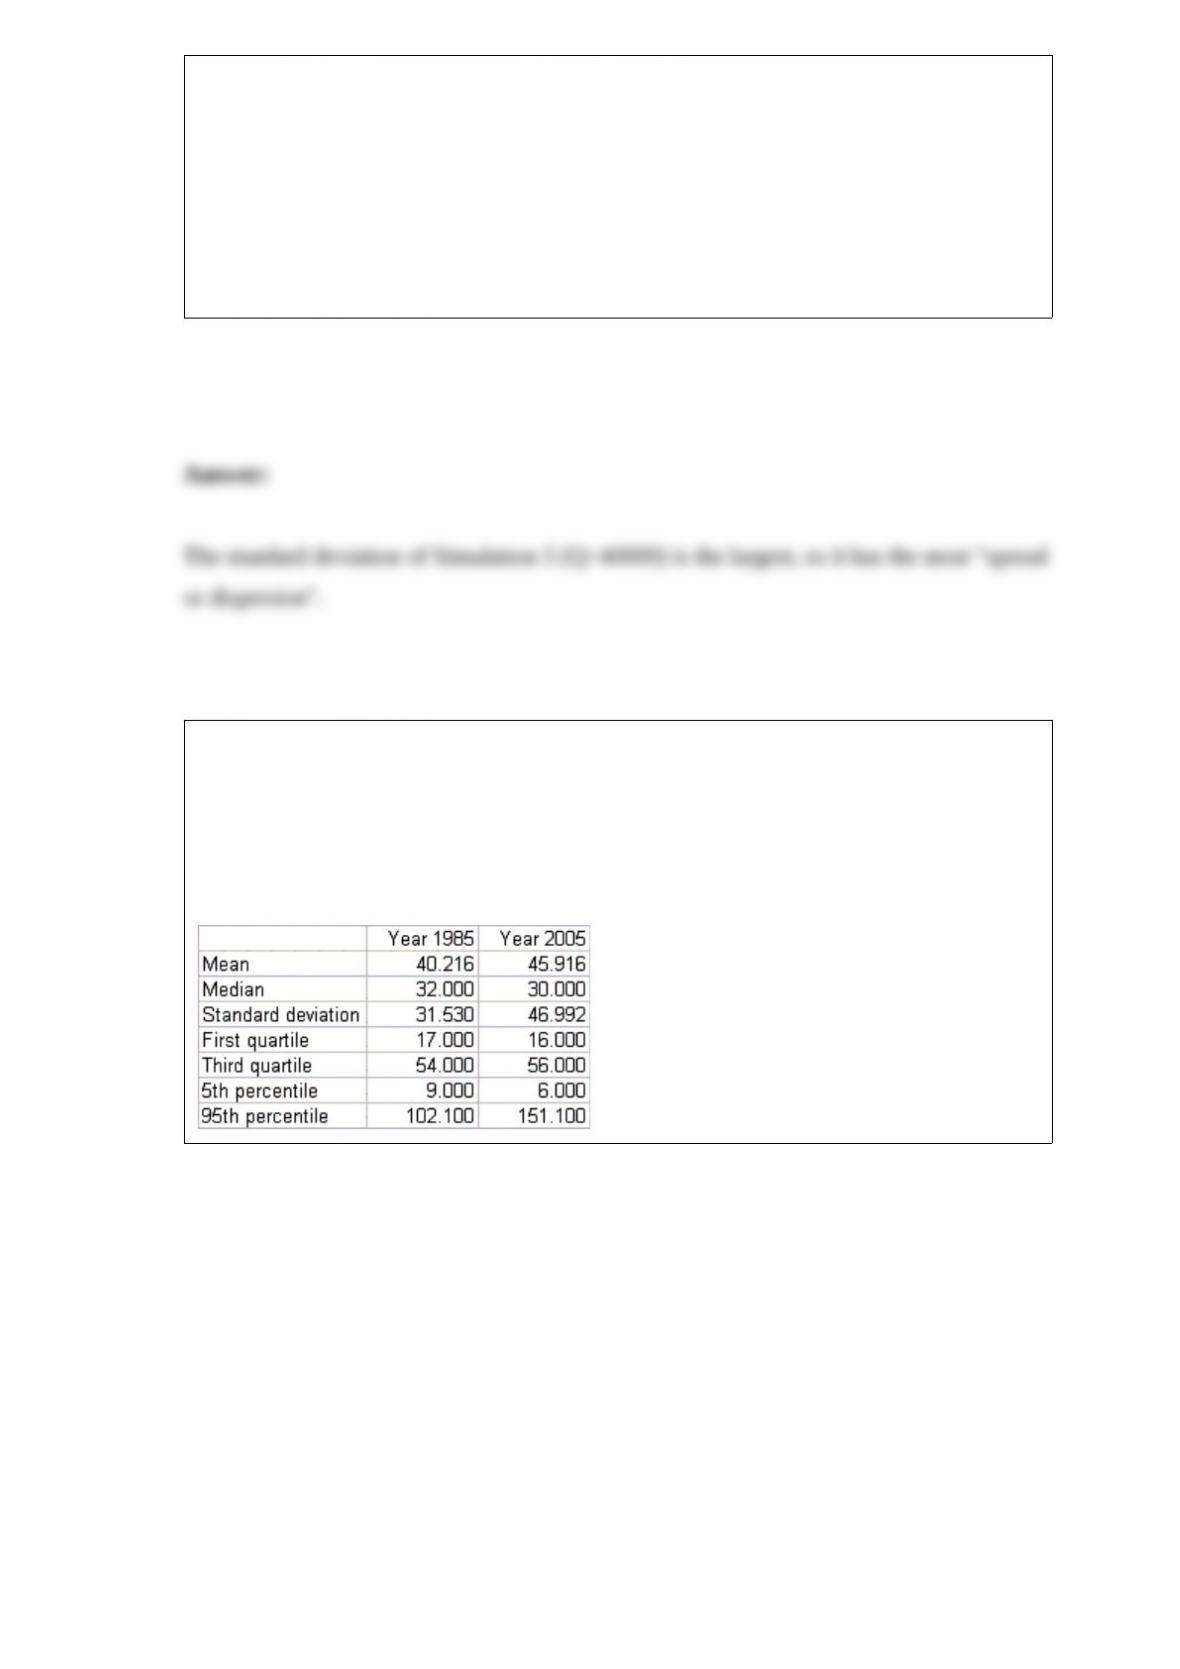
Which simulation has the most risk as measured by spread or dispersion in the data?
Please state clearly what statistic you used to answer this question.
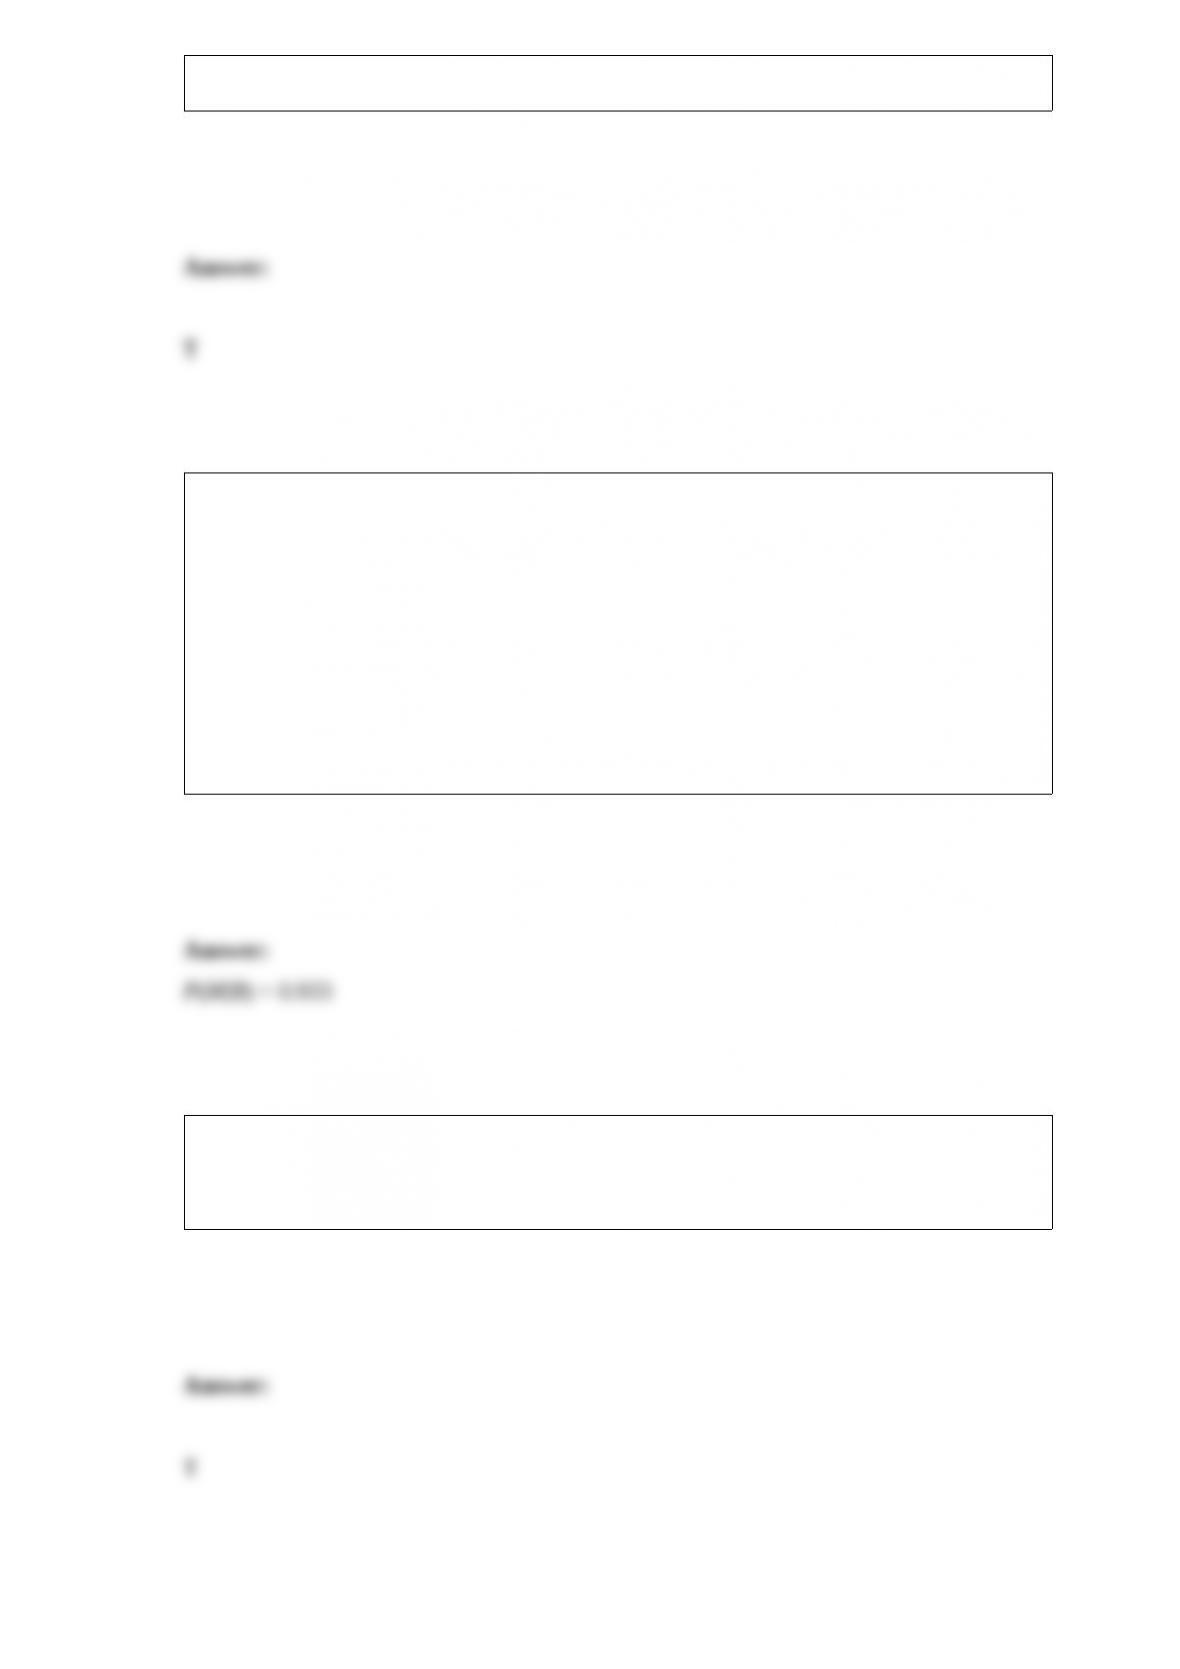
A question of great interest to economists is how the distribution of family income has
changed in the United States during the last 20 years. The summary measures and
histograms shown below are generated for a sample of 500 family incomes, using the
1985 and 2005 income for each family in the sample.
Summary Measures:
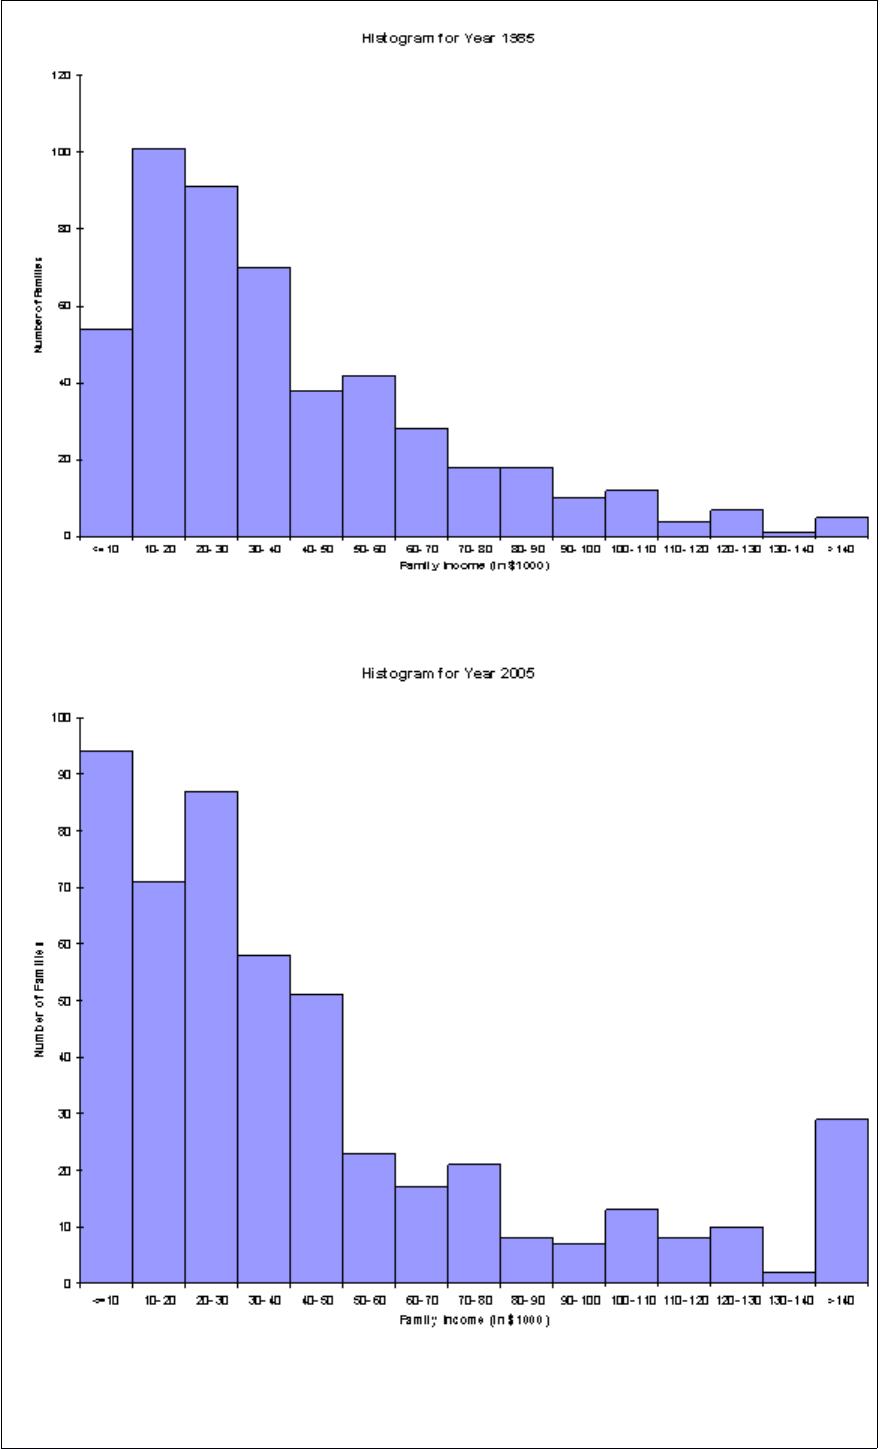
Based on these results, discuss as completely as possible how the distribution of family
income in the United States changed from 1985 to 2005.
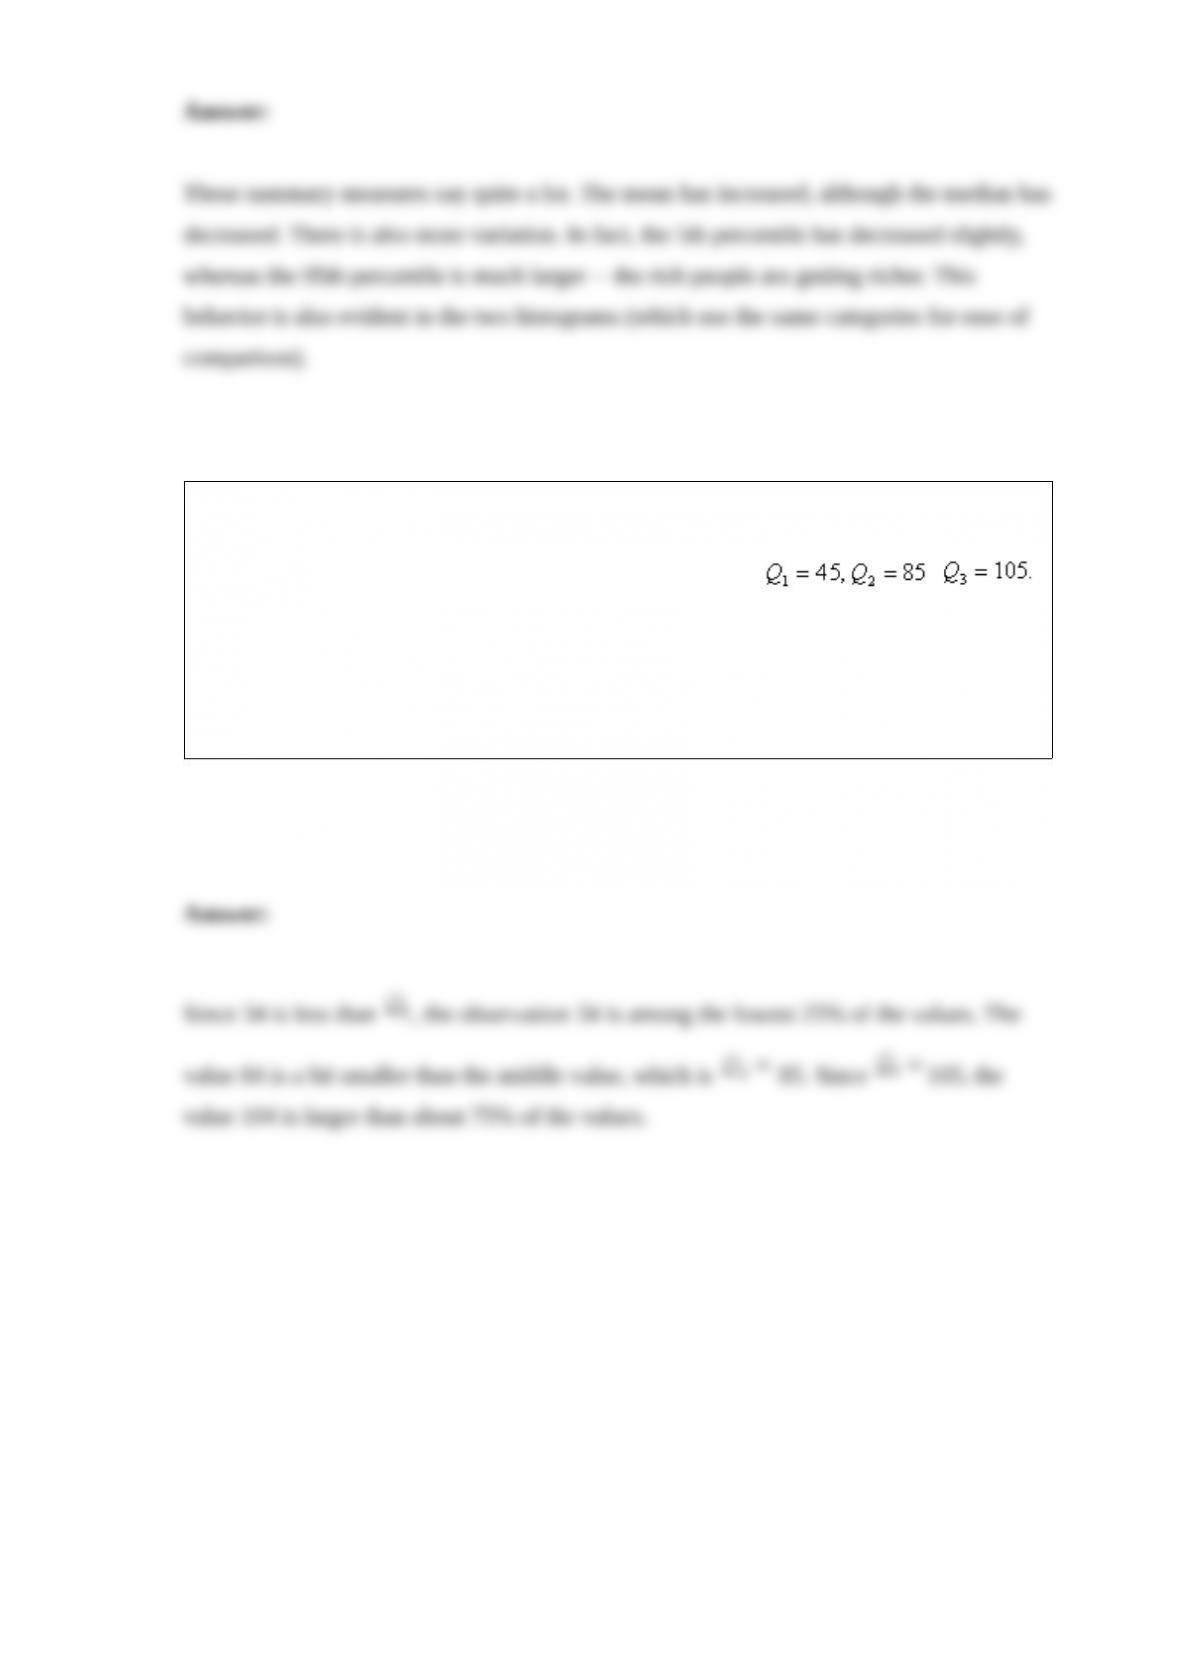
NARRBEGIN: SA_86_88
Suppose that an analysis of a set of test scores reveals that: ,
NARREND
What can you say about the relative position of each of the observations 34, 84, and
104?