
In order to generate random numbers in Excel from a discrete distribution with a finite
number of possible values and corresponding probabilities, we can use
a. only the RAND function
b. only the VLOOKUP function
c. only the VLOOKDOWN function
d. the RAND function along with a VLOOKUP function
Which of the following is an example of a nonlinear regression model?
a. A quadratic regression equation
b. A logarithmic regression equation
c. Constant elasticity equation
d. The learning curve model
e. All of these options
Holt’s model differs from simple exponential smoothing in that it includes a term for:
a. seasonality

b. trend
c. residuals
d. cyclical fluctuations
A key input variable in many marketing models of customer loyalty is the:
a. Mean profit per customer
b. Number of customers
c. Churn rate
d. Time horizon
e. All of these options
Which of the following statements are correct?
a. A point estimate is an estimate of the range of a population parameter
b. A point estimate is a single value estimate of the value of a population parameter
c. A point estimate is an unbiased estimator if its standard deviation is the same as the
actual value of the population standard deviation

d. All of these options
Suppose that a histogram of a data set is approximately symmetric and “bell shaped”.
Approximately what percent of the observations are within two standard deviations of
the mean?
a. 50%
b. 68%
c. 95%
d. 99.7%
e. 100%
Regression analysis asks:
a. if there are differences between distinct populations
b. if the sample is representative of the population
c. how a single variable depends on other relevant variables
d. how several variables depend on each other

The reason the Central Limit Theorem (CLT) is such an important result in statistics is
because:
a. The CLT allows us to assume that the population distribution is approximately
normal, provided n is reasonably large
b. The CLT allows us to estimate the population mean without knowing the exact form
of the population distribution, providedn is reasonably large
c. The CLT allows us to construct confidence intervals for the population mean without
knowing the exact form of the population distribution, providedn is reasonably large
d. All of these options
The ANOVA test is based on which assumptions?
a. The samples are independent and randomly selected from the populations
b. The populations are normally distributed
c. All population variances are equal
d. All of these options
e. None of these options

When we use simulation models to help make decisions, we do not deal with
uncertainty at all, since we often must make inferences from the simulated data.
Which of the following statements is true for the following data values: 7, 5, 6, 4, 7, 8,
and 12?
a. The mean, median and mode are all equal
b. Only the mean and median are equal
c. Only the mean and mode are equal
d. Only the median and mode are equal
If we plot a continuous probability distribution f(x), the total probability under the curve
is
a. -1
b. 0
c. 1
d. 100

A payoff table lists the monetary values (profit or loss) for each possible _____and each
possible _____.
a. mean and standard deviation
b. decision and utility
c. decision and outcome
d. risk profile and outcome
e. None of these options
NARRBEGIN: SA_105_106
A company faces the following demands during the next 3 weeks: week 1, 20 units;
week 2, 10 units; week 3, 15 units. The unit production cost during each week is as
follows: week 1, $13; week 2, $14; week 3, $15. A holding cost of $2 per unit is
assessed against each week’s ending inventory. At the beginning of week 1, the
company has 5 units on hand. Since not all goods produced during a month can be used
to meet the current month’s demand, assume that half of the goods produced during a
week can be used to meet the current week’s demands.
NARREND
(A) Determine how to minimize the cost of meeting the demand for the next three
weeks.
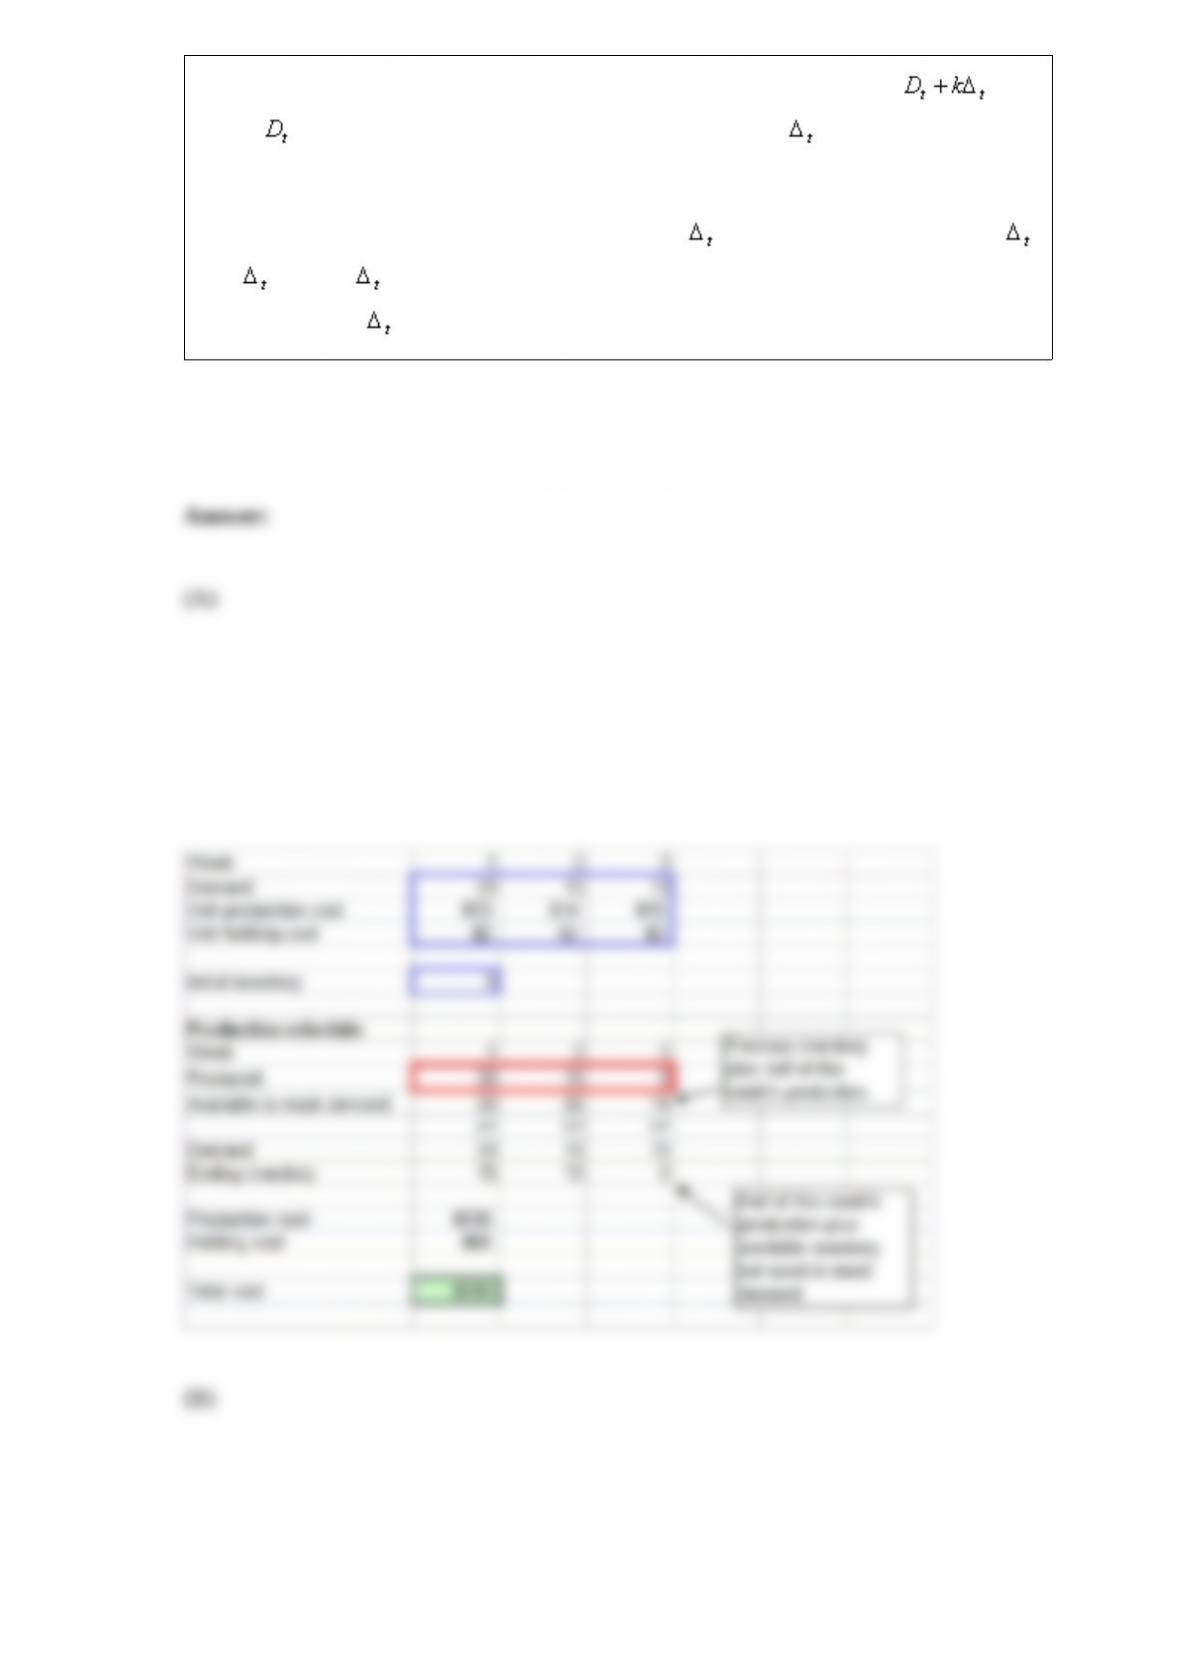
(B) Revise the model in Question 106 so that the demands are of the form ,
where is the original demand in month t, k is a factor, and is an amount of change
in month t. Formulate the model in such away that you can use the SolverTable add-in
to analyze changes in the amounts produced and the total cost when k varies from 0 to
10 in 1-unit increments, for any fixed values of the ‘s. For example, try this when
= 2, = 5, and = 3. Describe the behavior you observe in the table. Can you find
any “reasonable” ‘s that induce positive production levels in week 3?
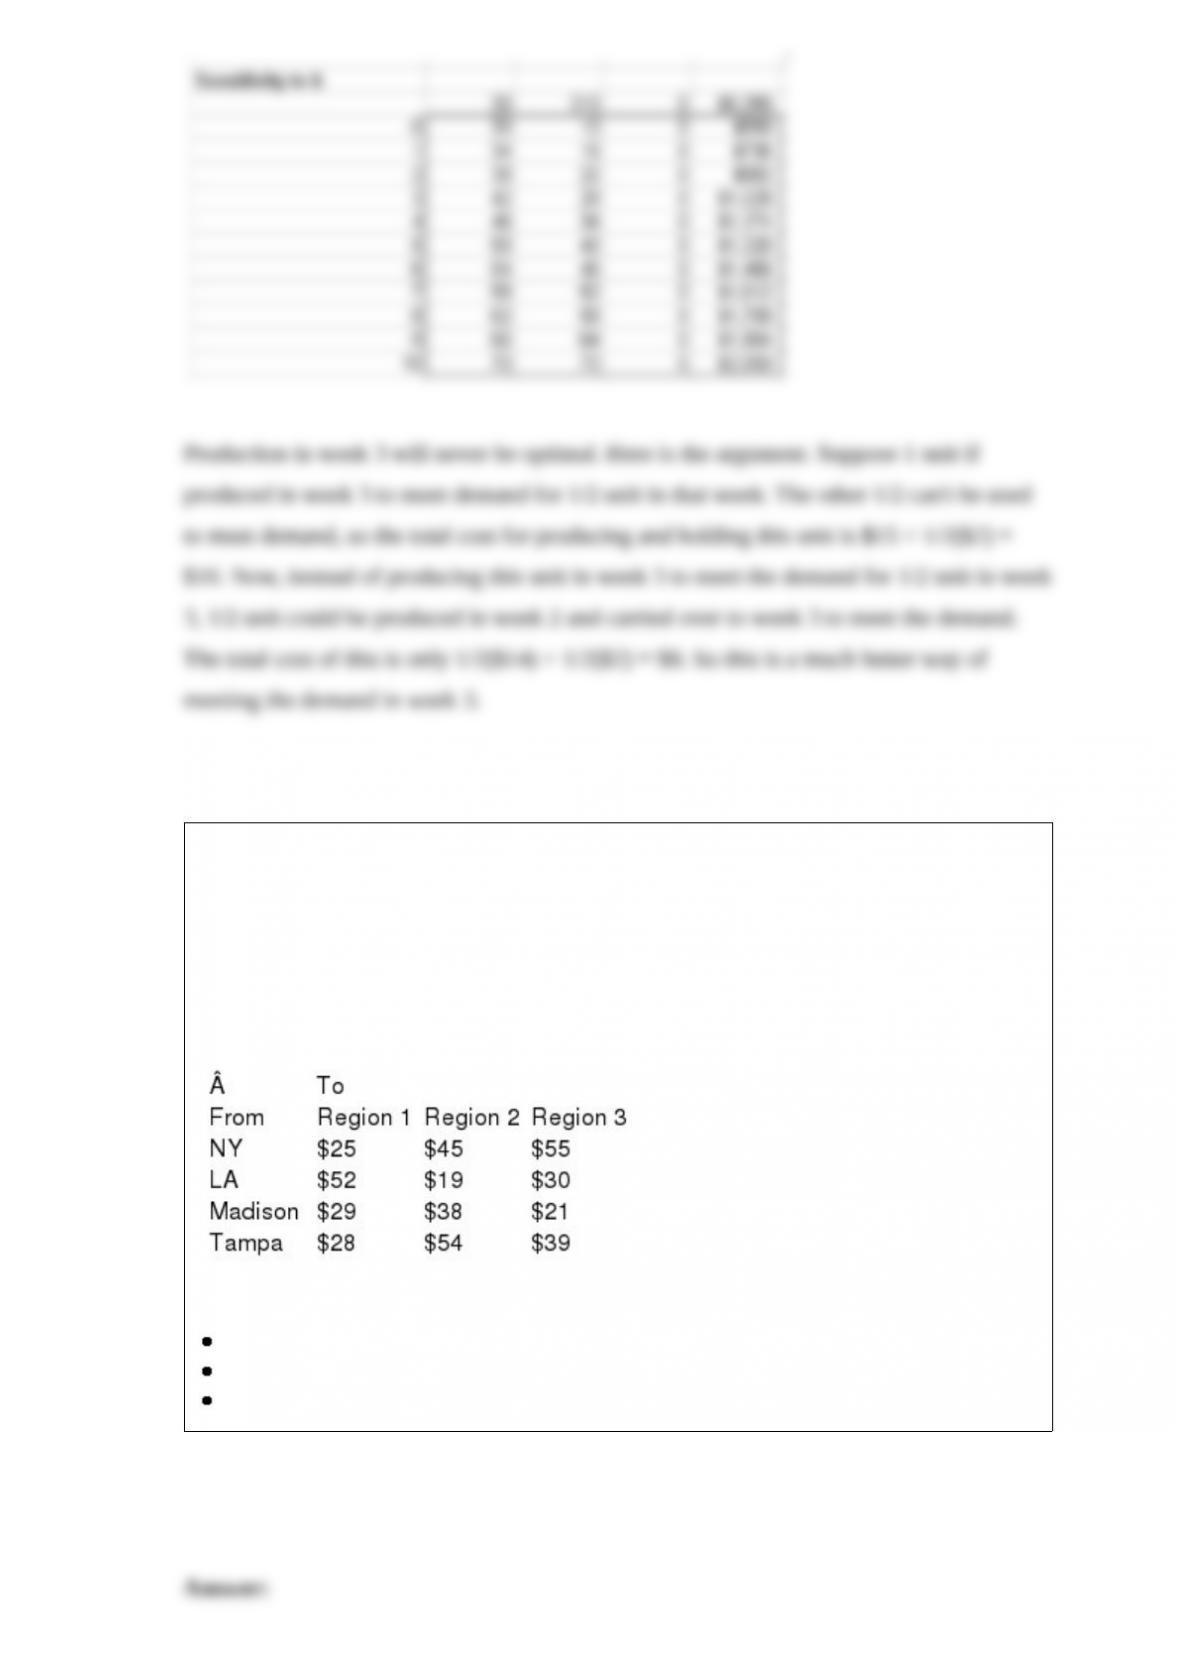
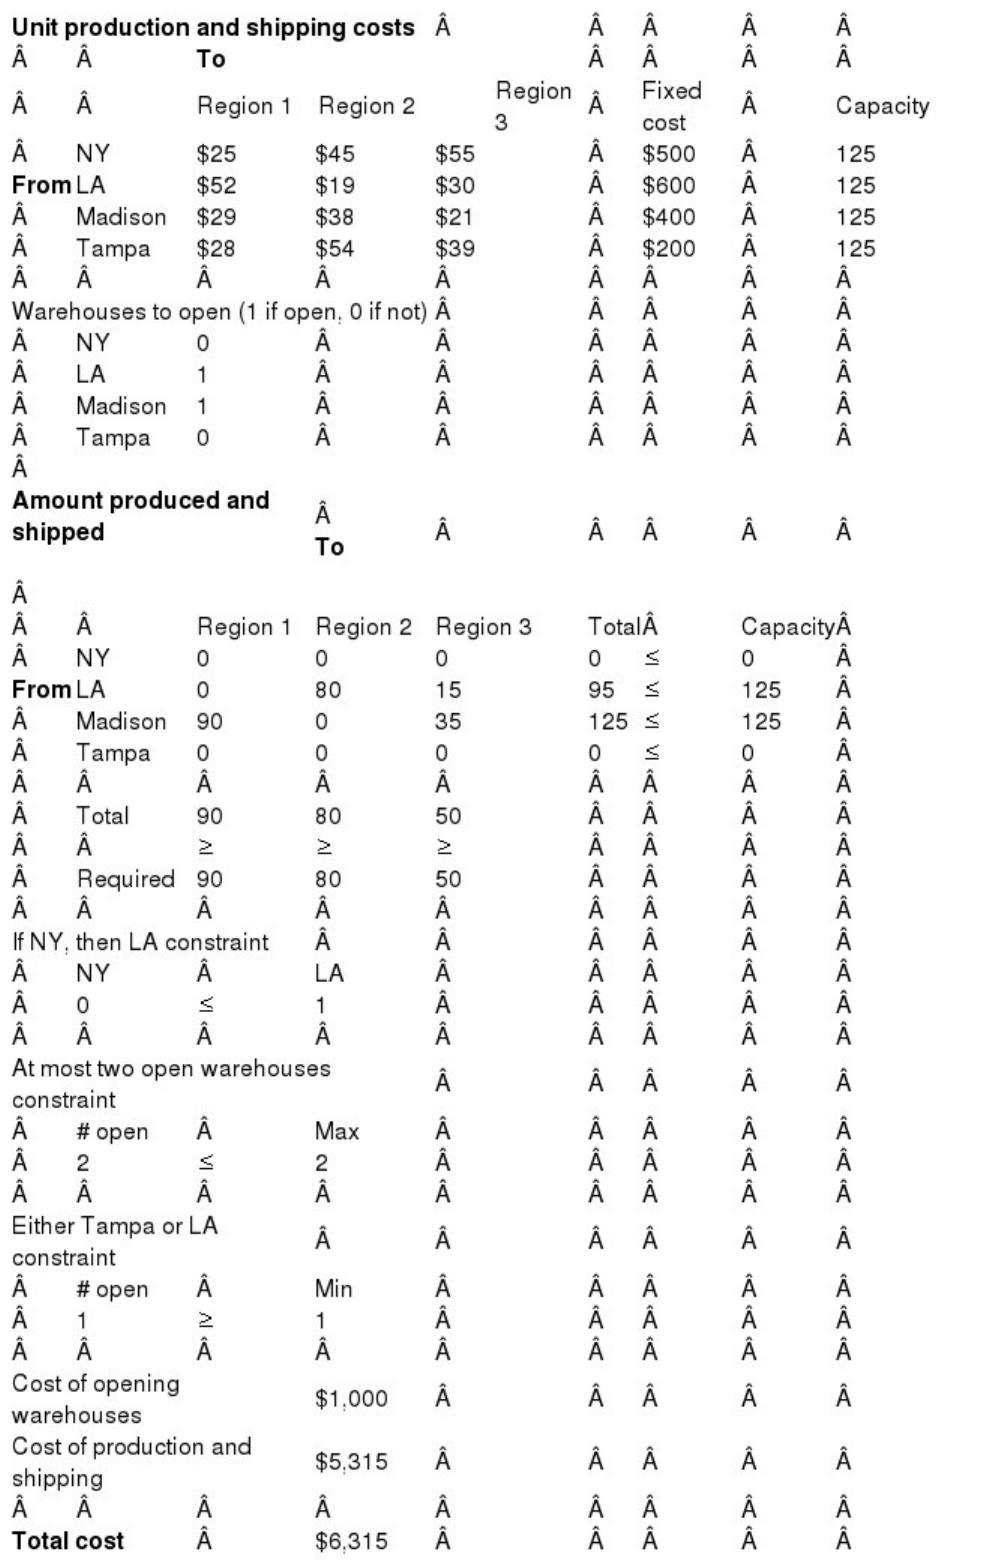
An electronic company is considering opening warehouses in New York, Los Angeles,
Madison, and Tampa. Each warehouse can ship 125 units per week. The weekly fixed
cost for keeping each warehouse open is $500 for New York, $600 for Los Angeles,
$400 for Madison, and $200 for Tampa. Region 1 of the country requires 90 units per
week, region 2 requires 80 units per week, and region 3 requires 50 units per week. The
costs (including production and shipping costs) of sending one unit from a plant to a
region are shown in the table below.
Show how the company can meet weekly demands at a minimum cost, subject to the
above information and the following restrictions:
If the New York warehouse is opened, then Los Angeles must be opened.
At most two warehouses can be opened.
Either the Tampa or the Los Angeles warehouses must be opened.

A point estimate is a single numeric value, a “best guess” of a population parameter,
calculated from the sample data.
The most common data format is
a. Long
b. Short
c. Stacked
d. Unstacked
When we look at a time series plot, we usually look for which two things?
a. “Is there an observable trend?” and “Is there a seasonal pattern?”
b. “Is there an observable trend” and “Can we make predictions?”
c. “Is the sample representative?” and “Is there a seasonal pattern?”
d. “Is there an observable trend?” and “Is the trend symmetric?”

The mean of the sampling distribution of always equals
a. the population mean
b. / n
c. the population standard deviation
d. / n
NARRBEGIN: SA_119_123
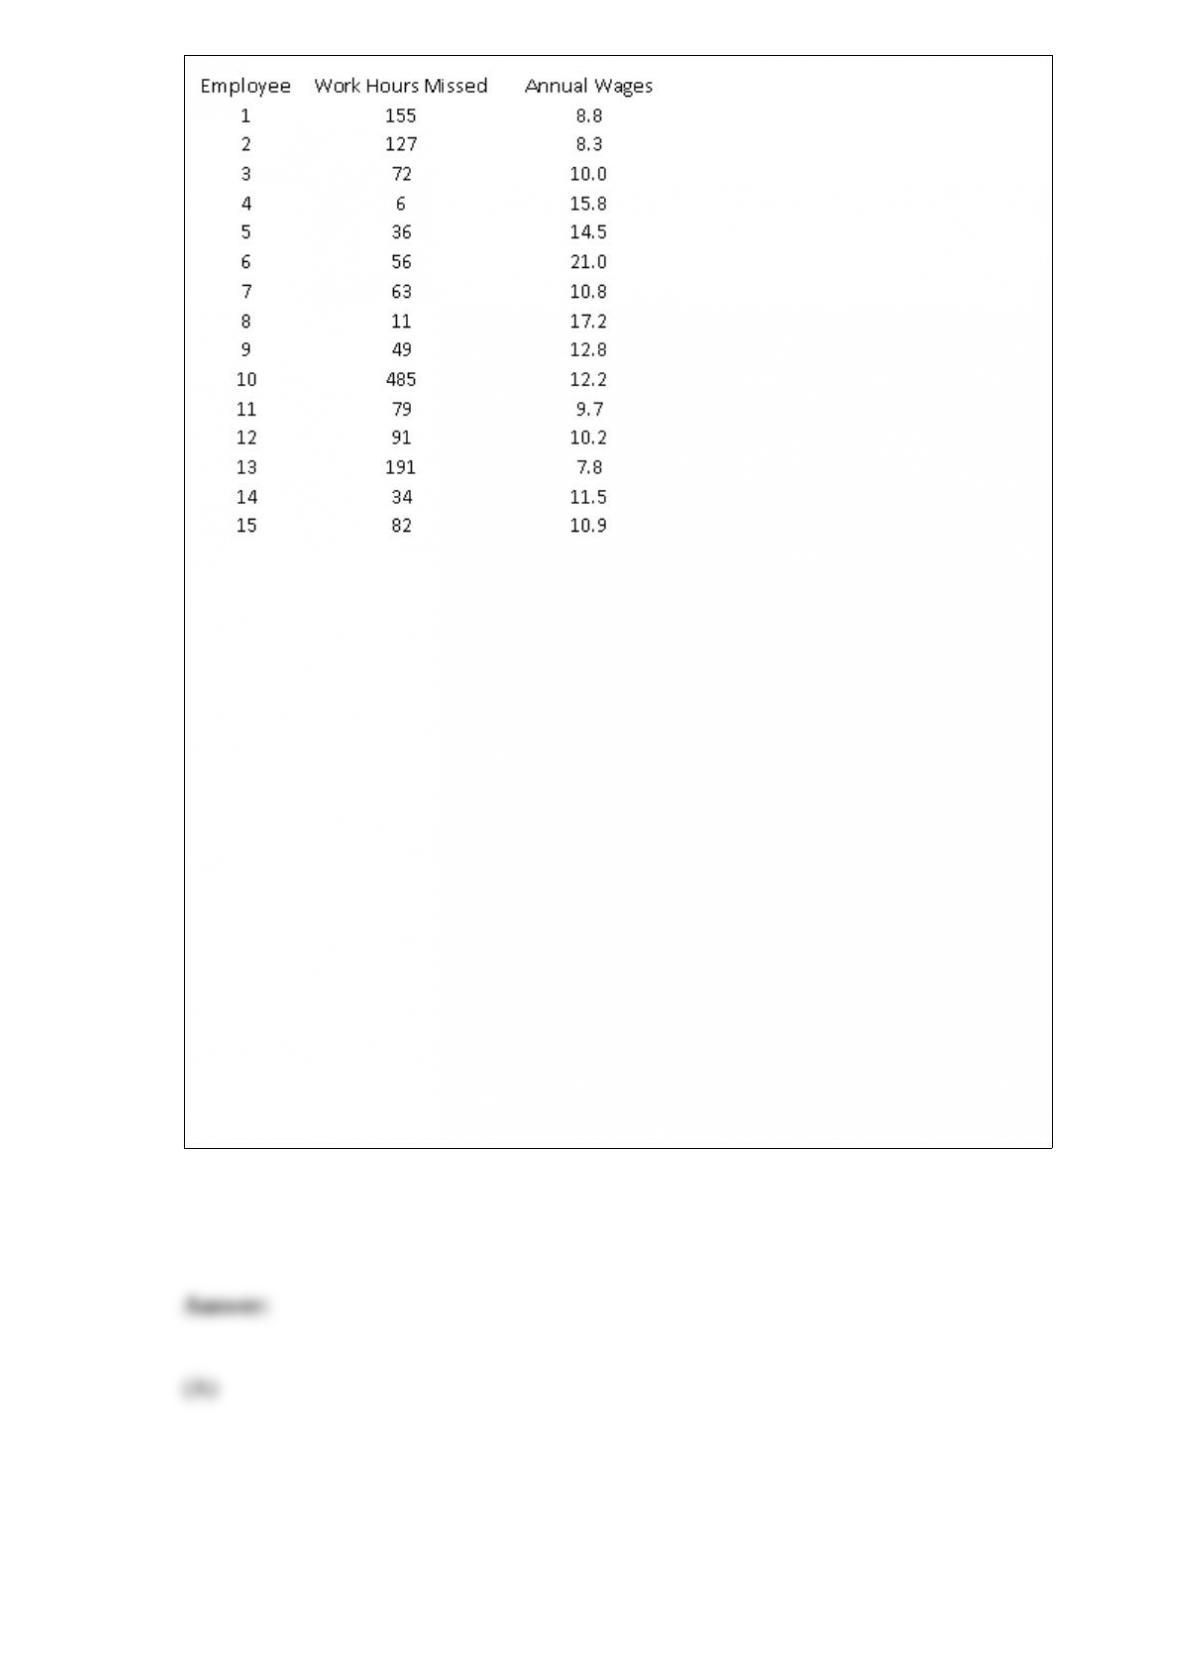
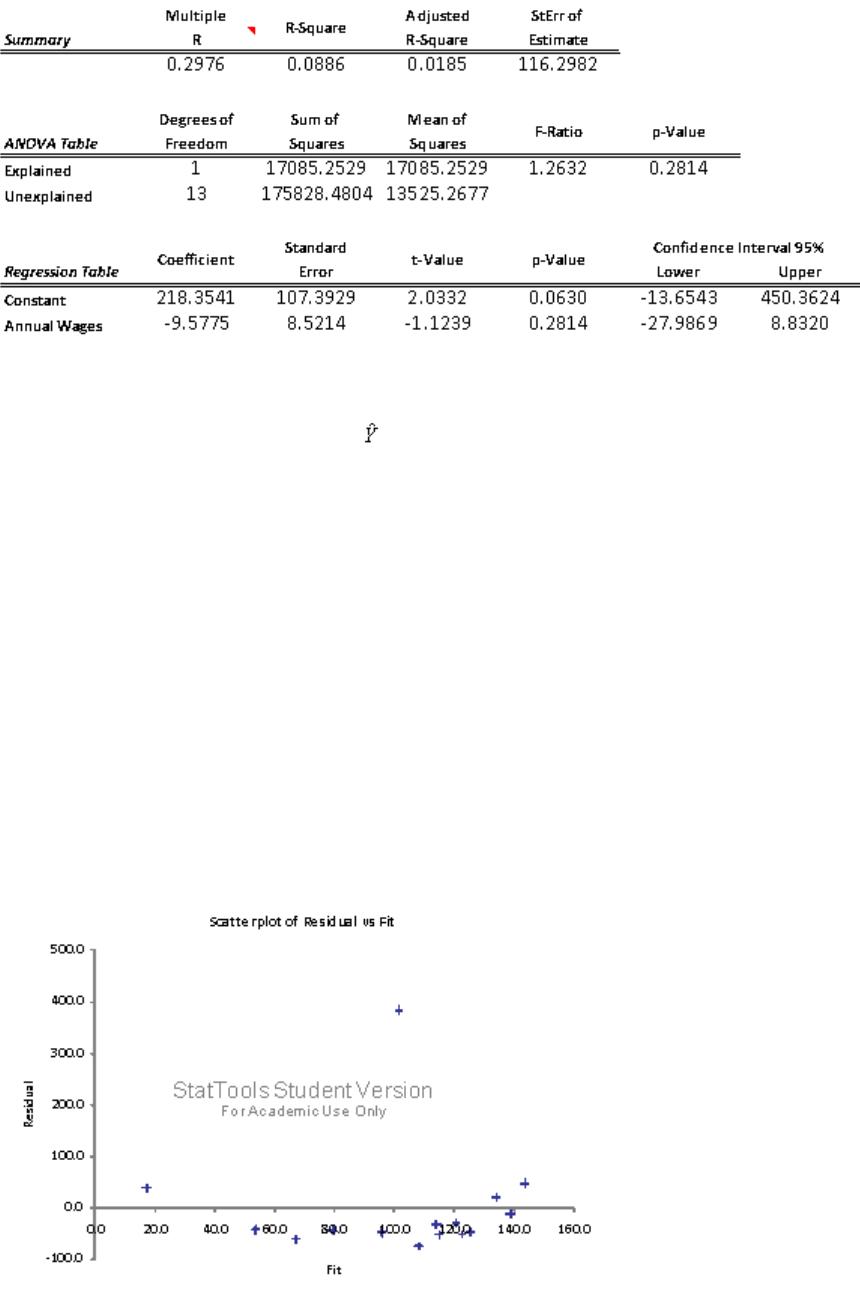
A manufacturing firm wants to determine whether a relationship exists between the
number of work-hours an employee misses per year (Y) and the employee’s annual
wages (X), to test the hypothesis that increased compensation induces better work
attendance. The data provided in the table below are based on a random sample of 15
employees from this organization.
NARREND
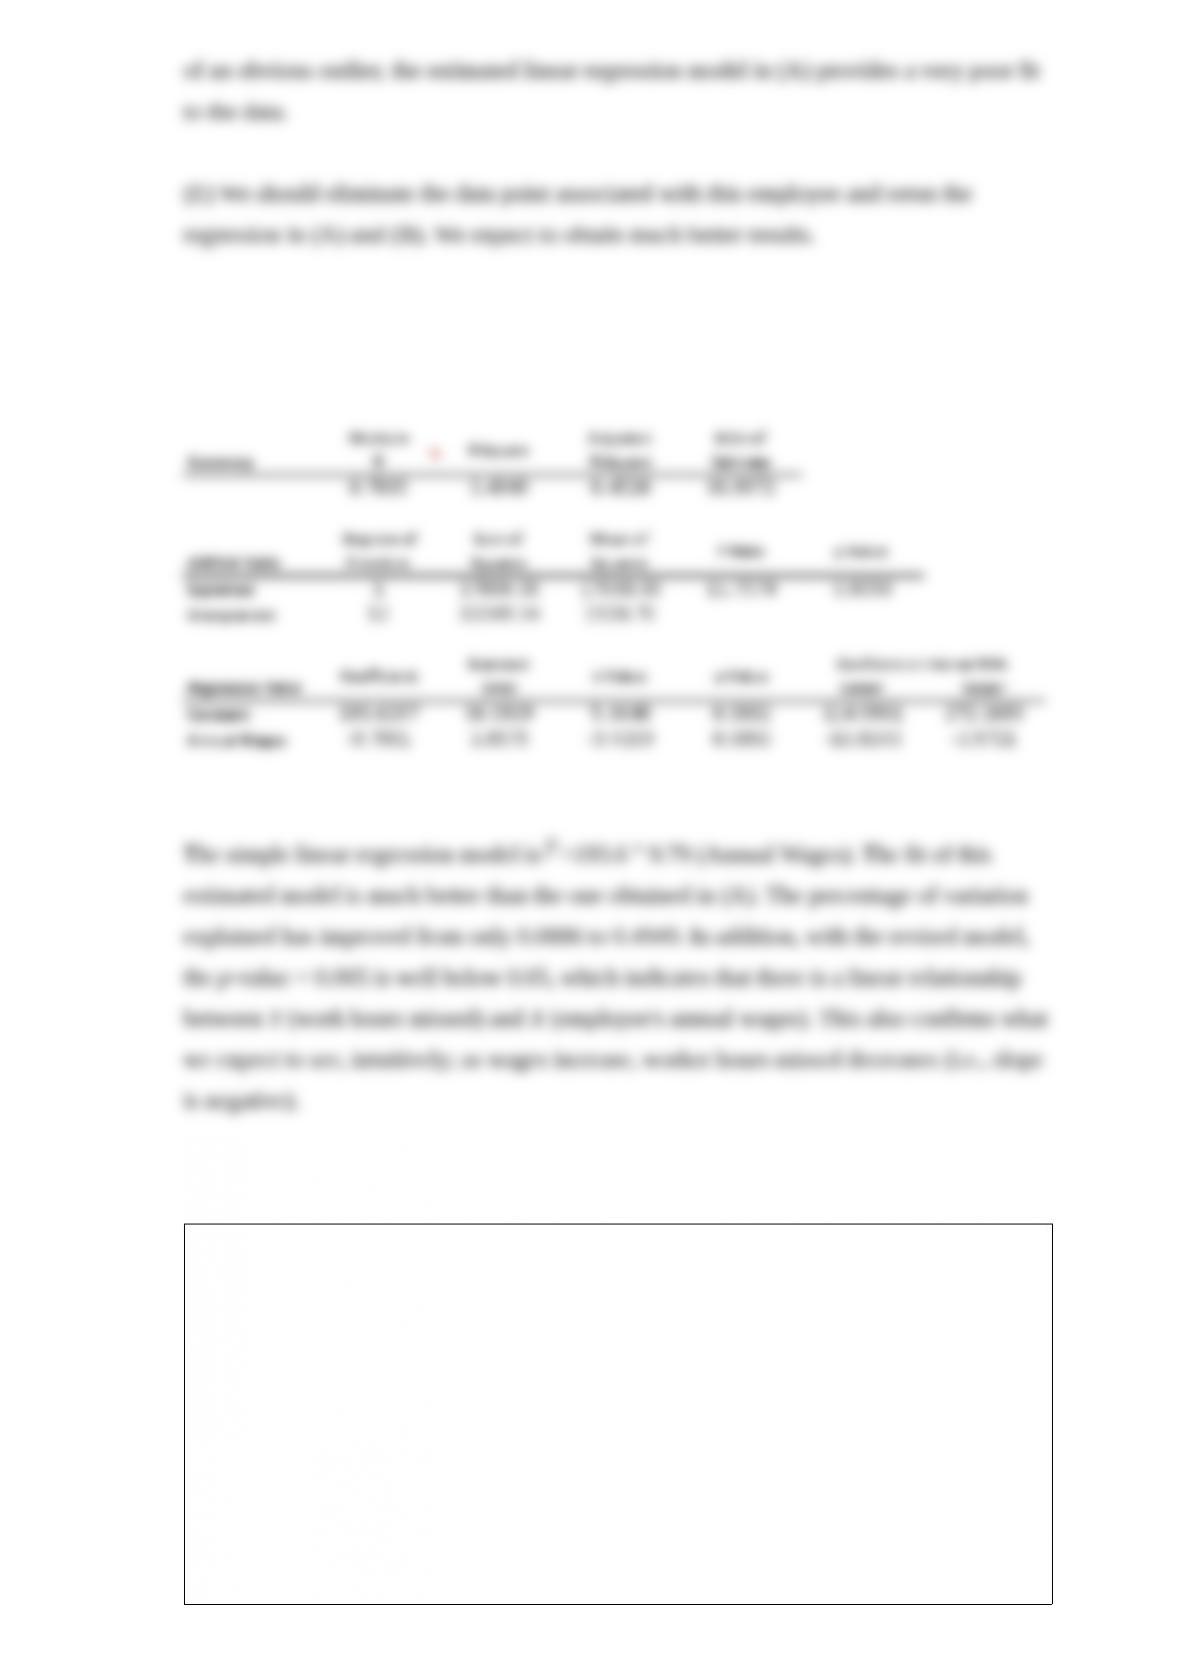
(A) Estimate a simple linear regression model using the sample data. How well does the
estimated model fit the sample data?
(B) Perform an F-test for the existence of a linear relationship between Y and X. Use a
5% level of significance.
(C) Plot the fitted values versus residuals associated with the model in Question 119.
What does the plot indicate?
(D) How do you explain the results you have found in (A) through (C)?
(E) Suppose you learn that the 10th employee in the sample has been fired for missing
an excessive number of work-hours during the past year. In light of this information,
how would you proceed to estimate the relationship between the number of work-hours
an employee misses per year and the employee’s annual wages, using the available
information? If you decide to revise your estimate of this regression equation, repeat
(A) and (B)
NARRBEGIN: SA_106_109
Two teams of workers assemble automobile engines at a manufacturing plant in
Michigan. A random sample of 145 assemblies from team 1 shows 15 unacceptable
assemblies. A similar random sample of 125 assemblies from team 2 shows 8
unacceptable assemblies.
NARREND
(A) Construct a 90% confidence interval for the difference between the proportions of
unacceptable assemblies generated by the two teams.
(B) Based on the confidence interval constructed in (A), is there sufficient evidence to
conclude, at the 10% significance level, that the two teams differ with respect to their
proportions of unacceptable assemblies?
(C) Is there sufficient evidence to conclude, at the 10% significance level, that the two
teams differ with respect to their proportions of unacceptable assemblies? Conduct the
appropriate hypothesis test.
(D) Calculate the p-value and explain how to use it for testing the null hypothesis of
equal proportion.
NARRBEGIN: SA_103_106
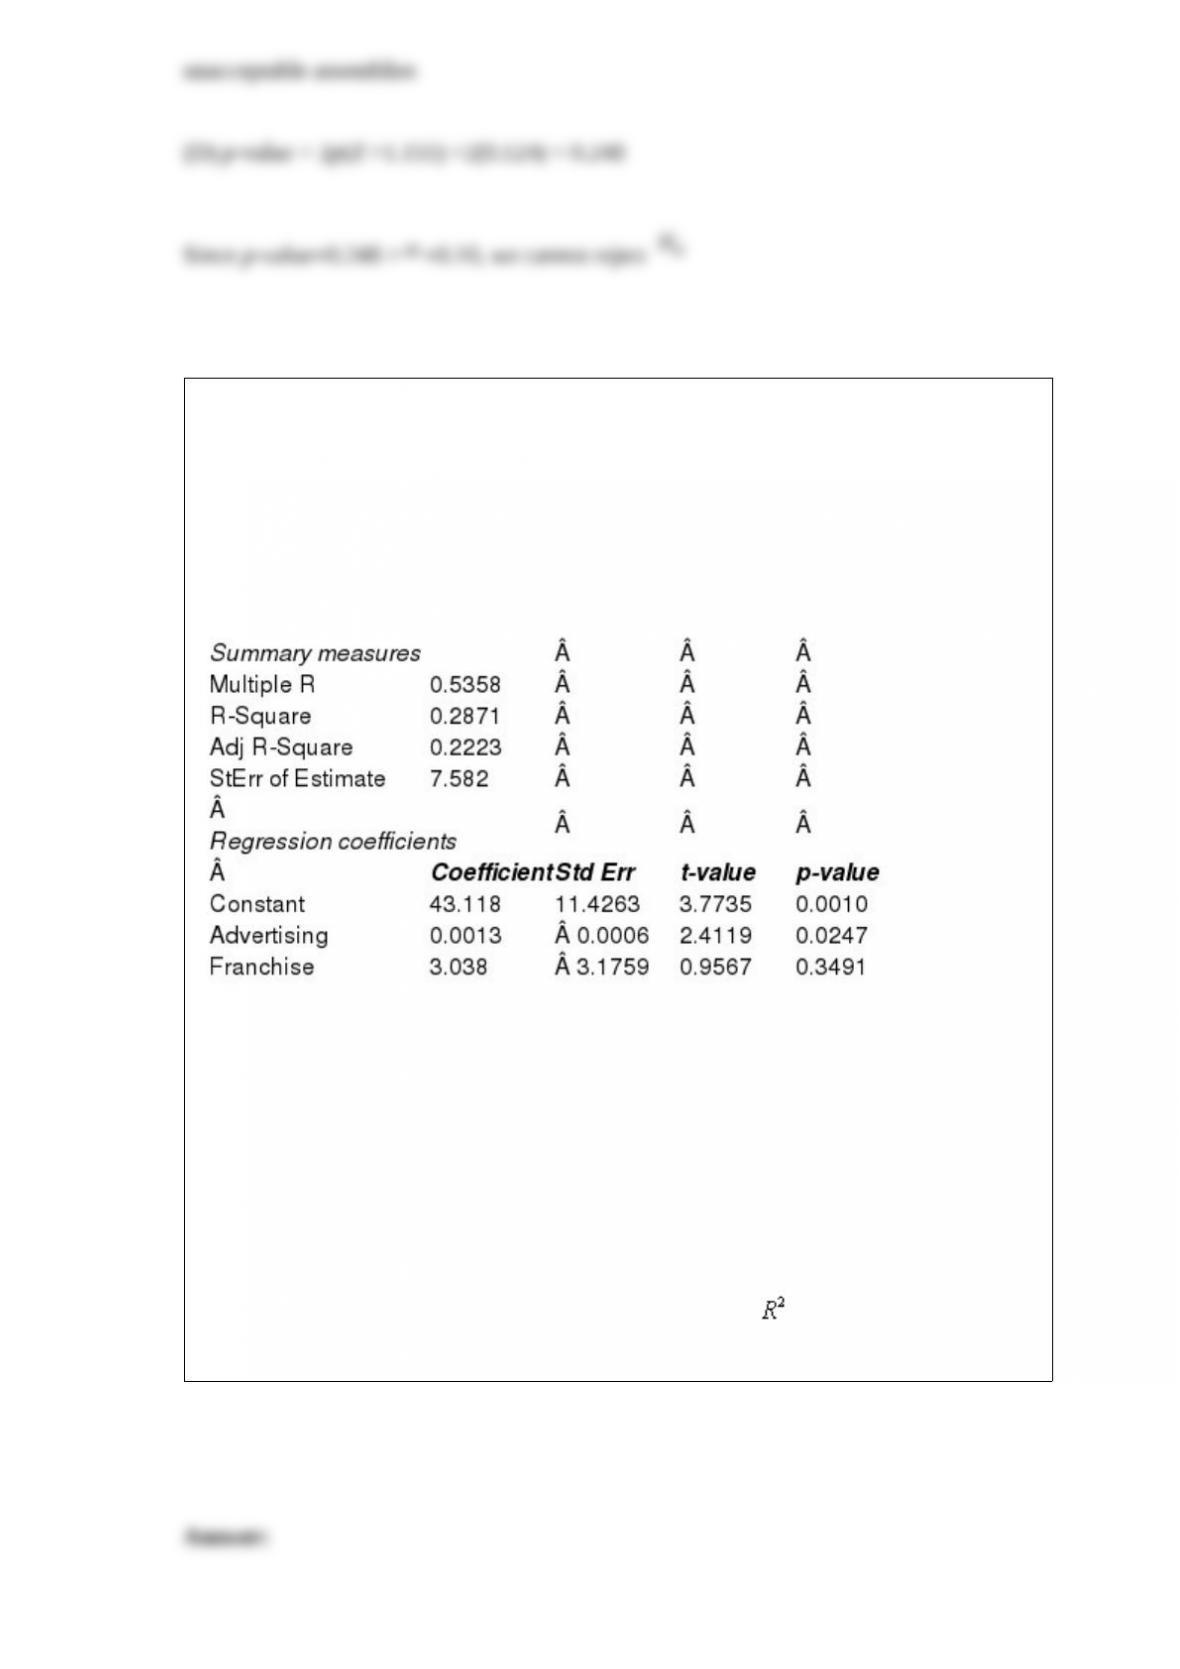
La Cabaa, a popular motel chain in the southwest, is interested in developing a
regression model that can predict the occupancy rate (%) of its motels. Currently, the
company is interested in using two explanatory variables to predict occupancy. They
want to use the amount of advertising (in $) used by each motel and if the particular
location a franchised location. Some regression information is presented below:
NARREND
(A) Use the information above to estimate the linear regression model.
(B) Interpret each of the estimated regression coefficients of the regression model in
(A).
(C) Would any of the variables in this model be considered a dummy variable? Explain
your answer.
(D) Identify and interpret the coefficient of determination ( ) and the standard error of
the estimate (se) for the model in (A).

Which of the following statements are false regarding the numbers generated by the
RAND function in Excel?
a. The numbers are random between 0 and 1
b. The numbers are probabilistically dependent
c. The numbers are probabilistically independent
d. The numbers are uniformly distributed between 0 and 1
NARRBEGIN: SA_84_87
The owner of a popular Internet-based auction site believes that more than half of the
people who sell items on her site are women. To test this hypothesis, the owner sampled
1000 customers who sold items on her site and she found that 53% of the customers
sampled were women. Some calculations are shown in the table below
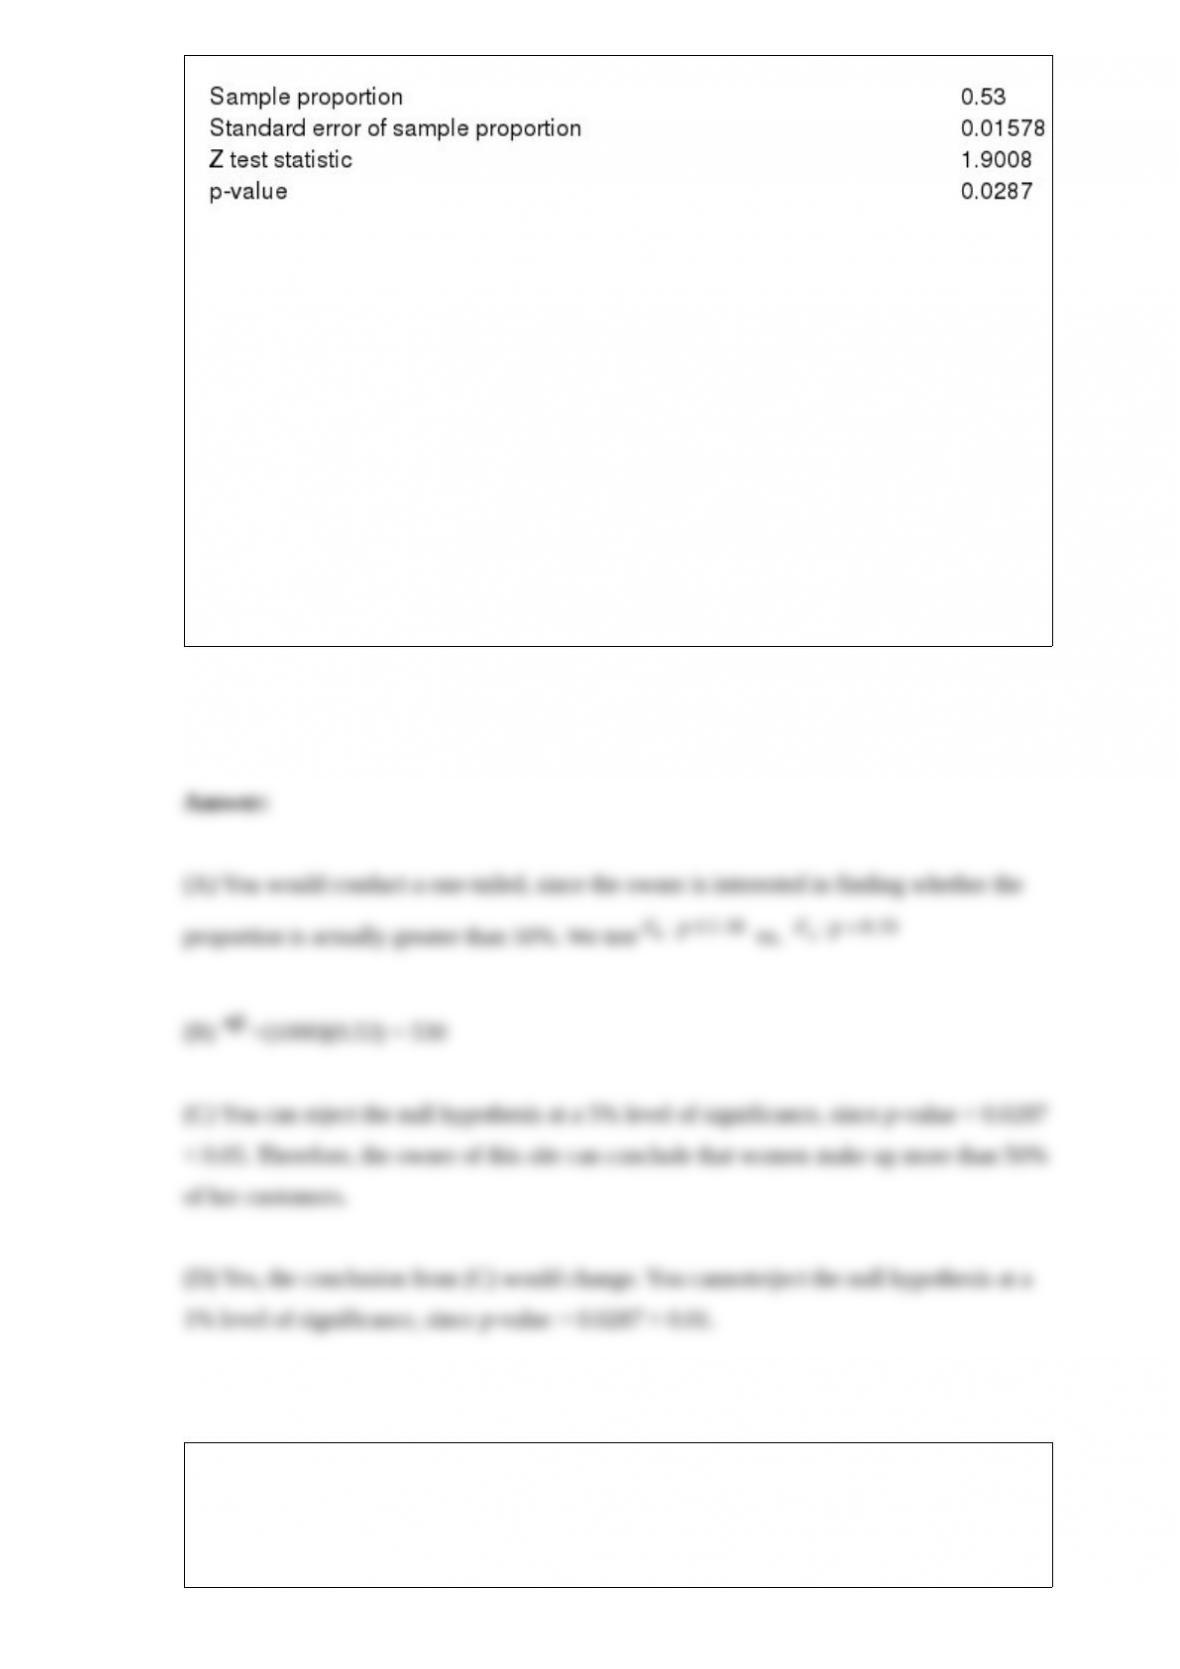
NARREND
(A) If you were to conduct a hypothesis test to determine if greater than 50% of
customers who use this Internet-based site are women, would you conduct a one-tail or
a two-tail hypothesis test? Explain your answer, and state the appropriate null and
alternative hypotheses.
(B) How many customers out of the 1000 sampled must have been women in this case?
(C) Using a 5% significance level, can the owner of this site conclude that women make
up more than 50% of her customers? Explain your answer.
(D) If you were to use a 1% significance level, would the conclusion from (C) change?
Explain your answer.
The number of degrees of freedom needed to construct 90% confidence interval for the
difference between means when the data are gathered from paired samples, with 15
observations in each sample, is:

a. 30
b. 15
c. 28
d. 14
The correlation value ranges from
a. 0 to +1
b. “1 to +1
c. “2 to +2
d. ” to+
NARRBEGIN: SA_57_59
A marketing research consultant hired by Coca-Cola is interested in determining the
proportion of customers who favor Coke over other soft drinks. A random sample of
400 consumers was selected from the market under investigation and showed that 53%
favored Coca-Cola over other brands.
NARREND
(A) Compute a 95% confidence interval for the true proportion of people who favor
Coke. Do the results of this poll convince you that a majority of people favors Coke?
(B) Suppose 2,000 (not 400) people were polled and 53% favored Coke. Would you
now be convinced that a majority of people favor Coke? Why might your answer be
different than in (A)?
(C) How many people would have to be surveyed to be 95% confident that you can
estimate the fraction of people who favor Coca-Cola within 1%?
If systematic sampling is chosen as the sampling technique, it is probably because:
a. Systematic sampling has better statistical properties than simple random sampling
b. Systematic sampling is more convenient

c. Systematic sampling always results in more representative sampling than simple
random sampling
d. None of these options
Smaller p-values indicate more evidence in support of the:
a. null hypothesis
b. alternative hypothesis
c. quality of the researcher
d. None of these options
The variance of a binomial distribution for which n = 100 and p = 0.20 is:
a. 100
b. 80
c. 20
d. 16

The regression line = 3 + 2X has been fitted to the data points (4, 14), (2, 7), and (1,
4). The sum of the residuals squared will be 8.0.
The set of all values of the changing cells that satisfy all constraints, not including the
nonnegativity constraints, is called the feasible region.
In general, increasing the confidence level will narrow the confidence interval, and
decreasing the confidence level widens the interval.

NARRBEGIN: SA_113_120
An oil company is planning to drill three exploratory wells in different areas of West
Texas. The company estimates that each of these wells, independent of the others, has
about a 30% chance of being successful.
NARREND
If a new pipeline will be constructed in the event that all three wells are successful,
what is the probability that the pipeline will be constructed?
NARRBEGIN: SA_97_101
A customer has approached a local credit union for a $20,000 1-year loan at a 10%
interest rate. If the credit union does not approve the loan application, the $20,000 will
be invested in bonds that earn a 6% annual return. Without additional information, the
credit union believes that there is a 5% chance that this customer will default on the
loan, assuming that the loan is approved. If the customer defaults on the loan, the credit
union will lose the $20,000.
NARREND
What should the credit union do? What is their expected profit?
NARRBEGIN: SA_86_89

A buyer for a large sporting goods store chain must place orders for professional
footballs with the football manufacturer six months prior to the time the footballs will
be sold in the stores. The buyer must decide in November how many footballs to order
for sale during the upcoming late summer and fall months. Assume that each football
costs the chain $45. Furthermore, assume that each pair can be sold for a retail price of
$90. If the footballs are still on the shelves after next Christmas, they can be discounted
and sold for $35 each. The probability distribution of consumer demand for these
footballs (in hundreds) during the upcoming season has been assessed by the market
research specialists and is presented below. Finally, assume that the sporting goods store
chain must purchase the footballs in lots of 100 units.
NARREND
What is the optimal strategy for order quantity, and what is the expected profit in that
case?
NARRBEGIN: SA_95_100
A recent survey in Michigan revealed that 60% of the vehicles traveling on highways,
where speed limits are posted at 70 miles per hour, were exceeding the limit. Suppose
you randomly record the speeds of ten vehicles traveling on US 131 where the speed
limit is 70 miles per hour. Let X denote the number of vehicles that were exceeding the
limit.
NARREND
Find P(4 < X < 9).
NARRBEGIN: SA_84_90
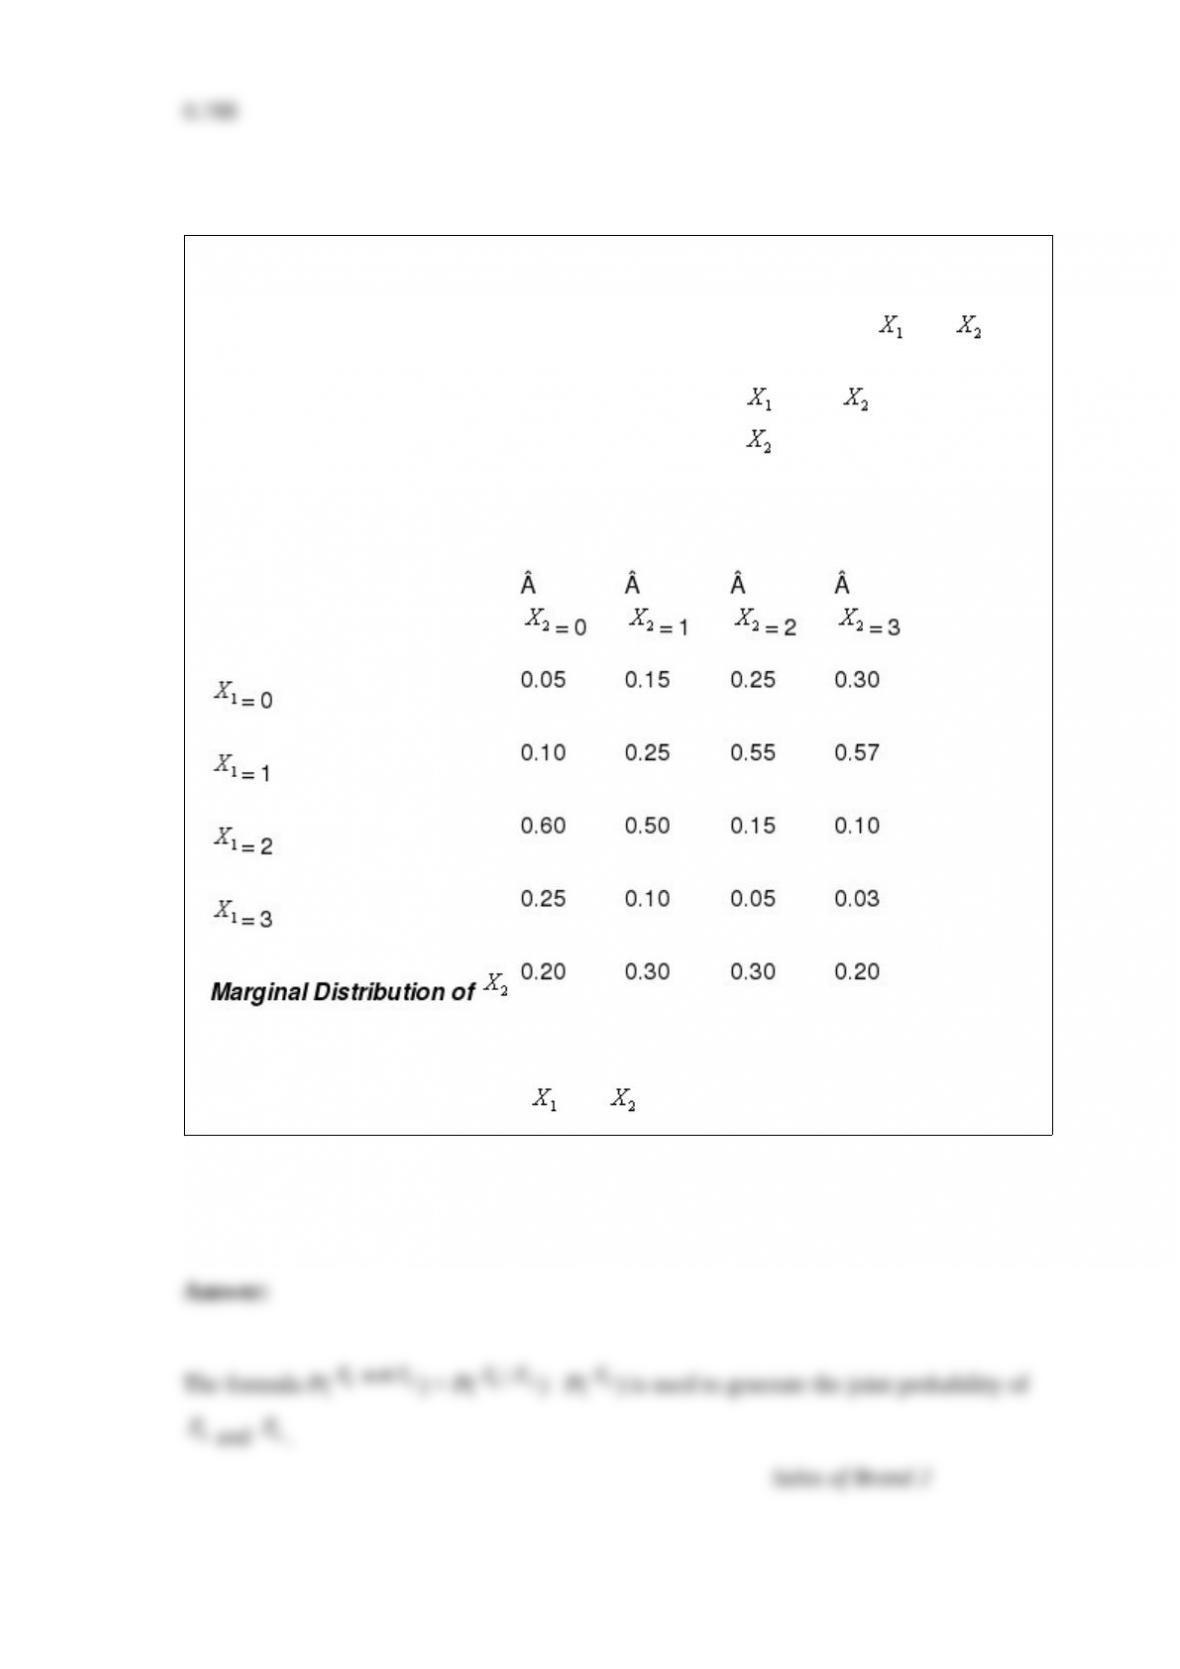
A sporting goods store sells two competing brands of softball bats. Let and be
the numbers of the two brands sold on a typical day at the store. Based on the store
historical data, the conditional probability distribution of given is assessed and
provided in the table below. The marginal distribution of is also given in the bottom
row of the table.
Sales of Brand 1, Given sales of Brand 2
NARREND
Calculate the joint probabilities of and .

The binomial distribution is a discrete distribution that deals with a sequence of
identical trials, each of which has only two possible outcomes.
Nonbinding constraints will always have slack, which is the difference between the two
sides of the inequality in the constraint equation.
Abby has been keeping track of what she spends to rent movies. The last seven week’s
expenditures, in dollars, were 6, 4, 8, 9, 6, 12, and 4. The mean amount Abby spends on
renting movies is $7.

When we wish to determine the probability that at least one of several events will occur,
we would use the addition rule.
The probability that event A will not occur is denoted as .