
NARRBEGIN: SA_107_111
Suppose that the number of customers arriving each hour at the only checkout counter
at a local convenience store is approximately Poisson distributed with an expected
arrival rate of 30 customers per hour. Let X represent the number of customers arriving
per hour. The probabilities associated with X are shown below.
P(X < 5) = 0.0000, P(X < 10) = 0.0000, P(X < 15) = 0.0009,
P(X < 20) = 0.0219, P(X < 25) = 0.1572, P(X < 30) = 0.4757
P(X = 30) = 0.0726, P(X = 31) = 0.0703, P(X = 32) = 0.0659,
P(X = 33) = 0.0599, P(X = 34) = 0.0529, P(X = 35) = 0.0453
NARREND
What is the probability that at least 25 customers arrive at this checkout counter in a
given hour?
The binomial distribution is a discrete distribution that is applied to situations where n
independent and identical “trials” occur, with each trial resulting in a “success” or
“failure,” and we want to generate the random number of successes in the n trials.
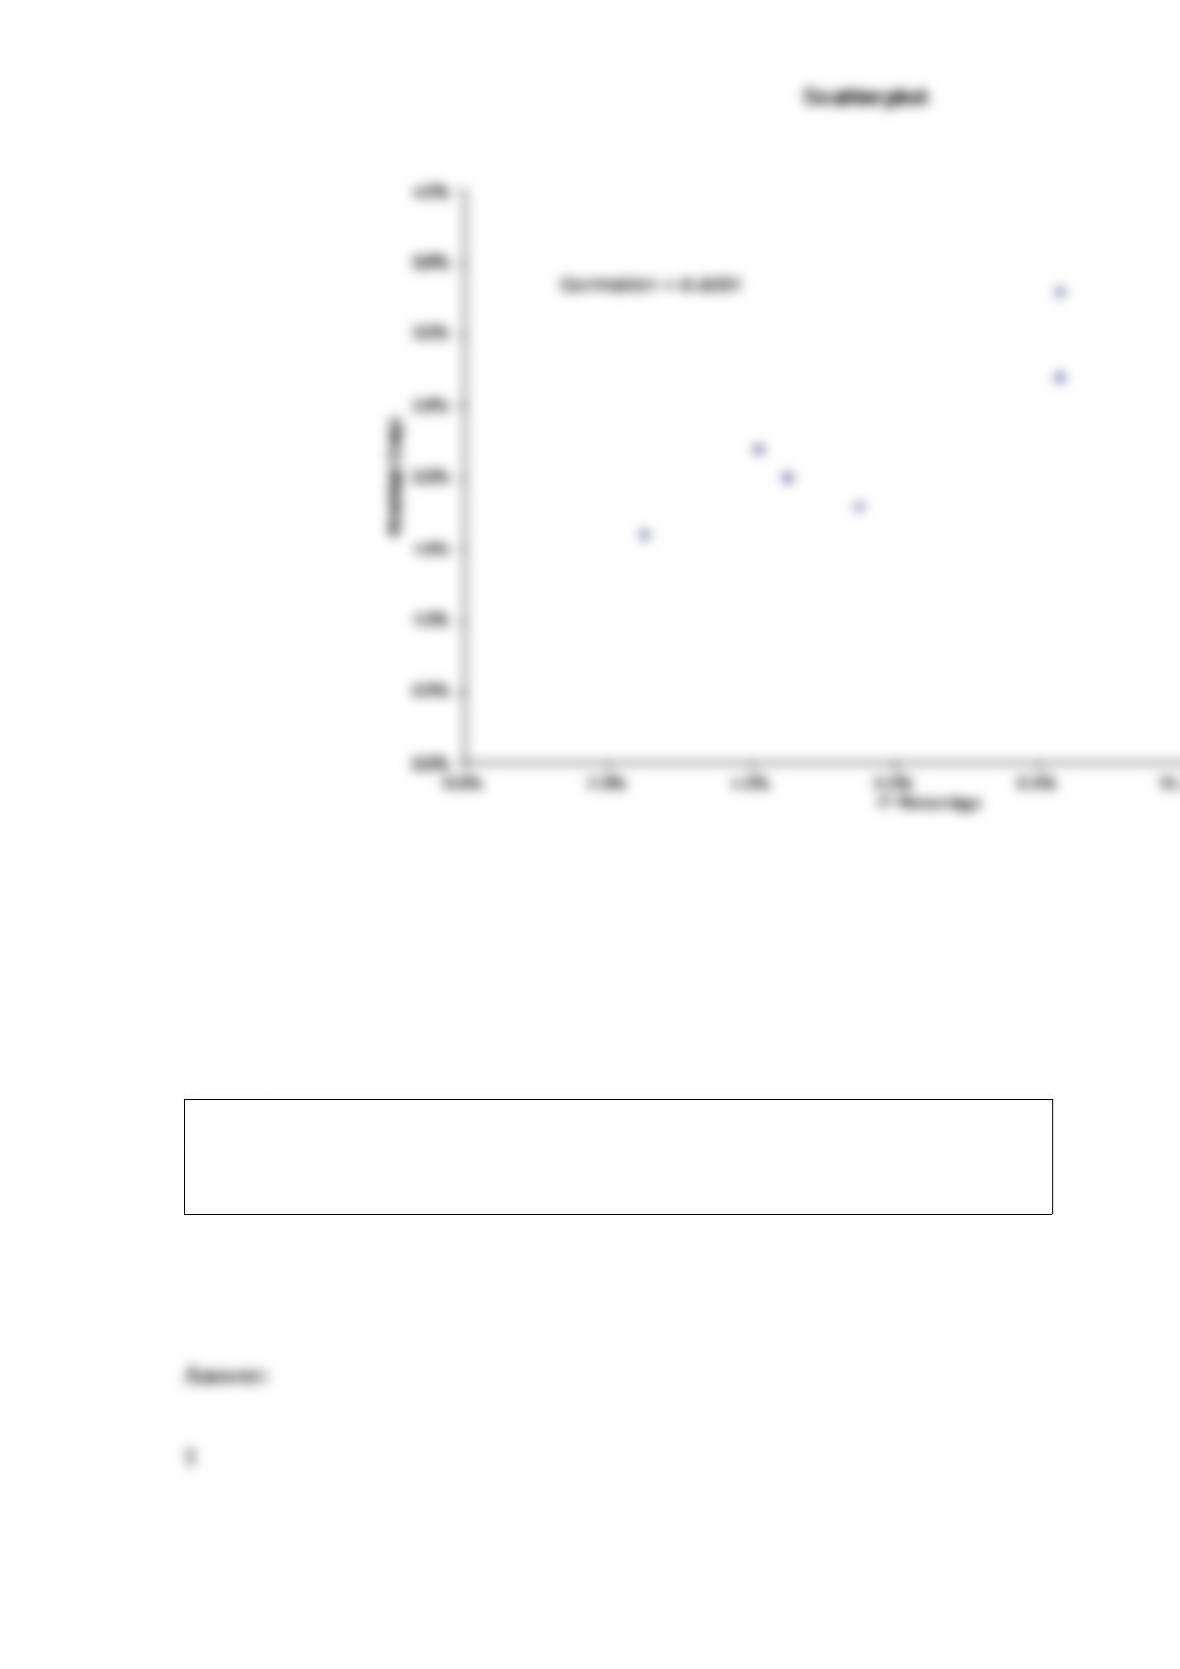
The table shown below contains information technology (IT) investment as a
percentage of total investment for eight countries during the 1990s. It also contains the
average annual percentage change in employment during the 1990s. Explain how these
data shed light on the question of whether IT investment creates or costs jobs. (Hint:
Use the data to construct a scatterplot)

Suppose the allowable increase and decrease for shadow price for a constraint are $25
(increase) and $10 (decrease). If the right hand side of that constraint were to increase
by $10 the optimal value of the objective function would change.

NARRBEGIN: SA_91_103
A sample of 1000 households was selected in Los Angeles to determine information
concerning consumer behavior. Among the questions asked was “Do you enjoy
shopping for clothing?” Of 480 males, 272 answered yes. Of 520 females, 448
answered yes.
NARREND
Does consumer behavior depend on the gender of consumer? Explain using
probabilities.
In cluster sampling, the population is divided into subsets called clusters (such as cities
or city blocks), and then a random sample of the clusters is selected. Once the clusters
are selected, we typically sample all of the members in each selected cluster.
NARRBEGIN: SA_91_103
A sample of 1000 households was selected in Los Angeles to determine information
concerning consumer behavior. Among the questions asked was “Do you enjoy
shopping for clothing?” Of 480 males, 272 answered yes. Of 520 females, 448
answered yes.

NARREND
What is the probability that a respondent chosen at random is a female or enjoys
shopping for clothing?
Multicollinearity is a situation in which two or more of the explanatory variables are
highly correlated with each other.
A logarithmic transformation of the response variable Y is often useful when the
distribution of Y is symmetric.
There are two primary ways to formulate a linear programming problem, the traditional
algebraic way and in spreadsheets.

NARRBEGIN: SA_66_71
The weekly demand for a particular automobile manufacturer follows a normal
distribution with a mean of 40,000 cars and a standard deviation of 10,000. Below you
will find probability and percentile calculations related to the customer purchase
amounts. Use this information to answer the following questions.
Probability Calculations
P(Sales < 2,000,000) = 0.134, P(Sales < 2,050,000) = 0.339
P(Sales < 2,100,000) = 0.609, P(Sales < 2,150,000) = 0.834
Percentiles Calculations
1st percentile = 1,912,245, 5th percentile = 1,961,388
95th percentile = 2,198,612, 99th percentile = 2,247,755
NARREND
Calculate the mean, variance, and standard deviation for the entire year (assume 52
weeks in the year).
The primary purpose of a nonlinear transformation is to “straighten out” the data on a
scatterplot

If the observations of a time series increase or decrease regularly through time, we say
that the time series has a random (or noise) component.
It is often useful to perform sensitivity analysis to see how, or if, the optimal solution to
a linear programming problem changes as we change one or more model inputs.
If a categorical variable is to be included in a multiple regression, a dummy variable for
each category of the variable should be used, but the original categorical variables
should not be sued.
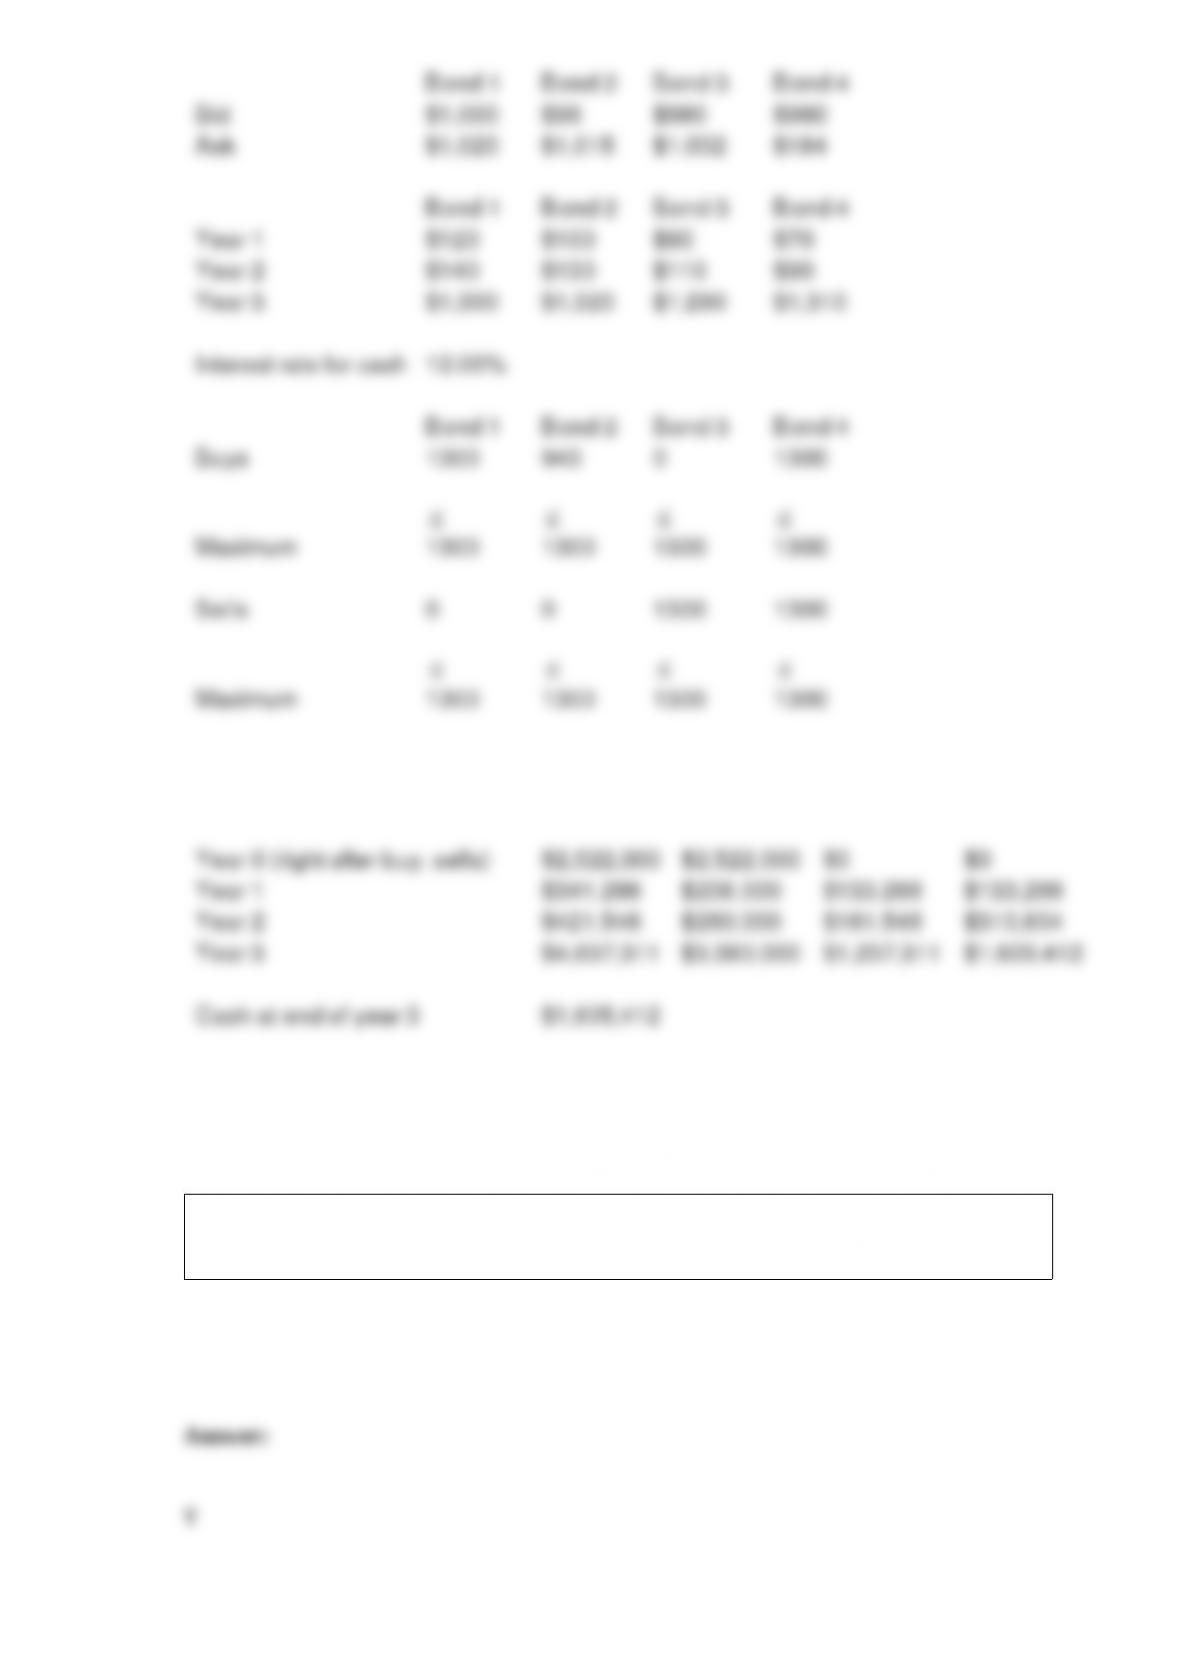
A statistician is currently trying to maximize his profit in the bond market. Four bonds
are available for purchase and sale at the bid and ask prices shown in the table below.
The statistician can buy up to 1300 units of each bond at the ask price or sell up to 1300
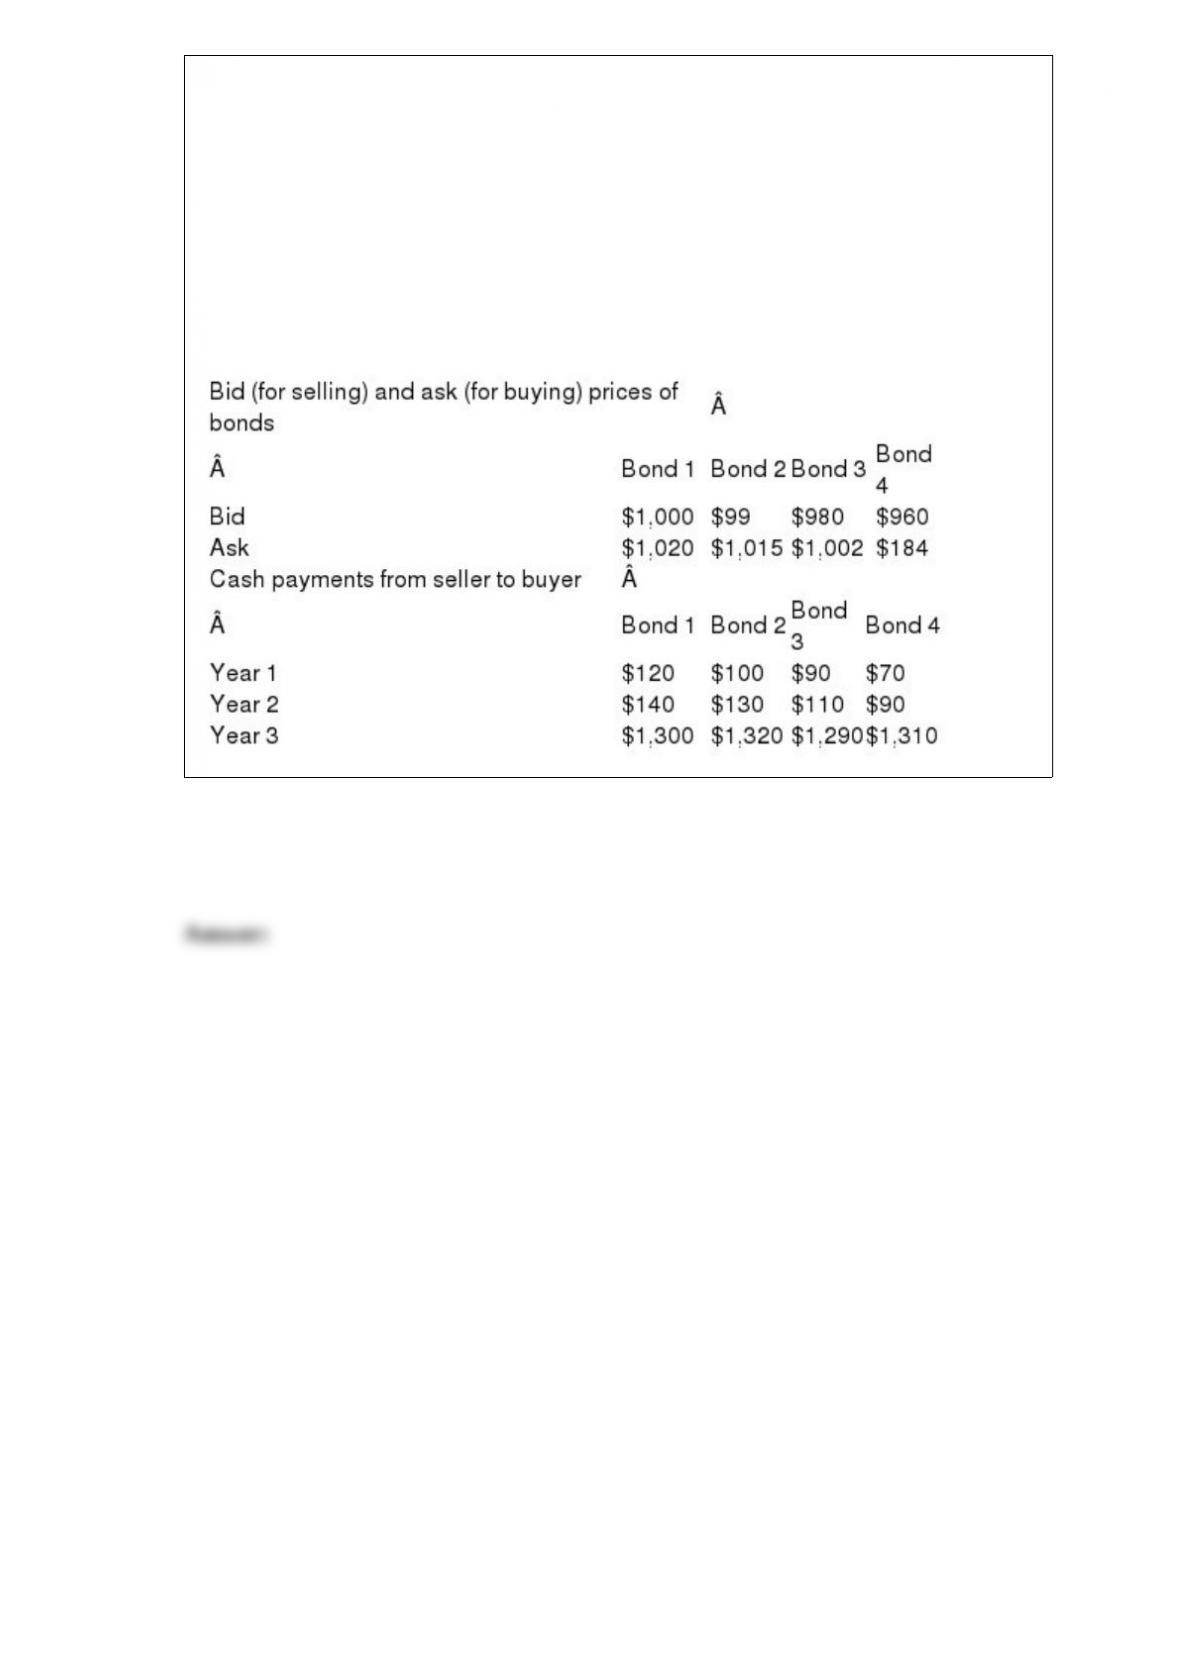
units of each bond at the bid price. During each of the next three years the person who
sells a bond will pay the owner of the bond the cash payments that are also shown in the
table below. The statistician’s goal is to maximize his revenue from selling bonds less
his payments for buying bonds, subject to the constraint that after each year’s payments
are received, his current cash position (due only to cash payments from bonds and not
purchases or sales of bonds) is nonnegative. His current cash position can depend on
past coupons and that cash accumulated at the end of each year earns 12% annual
interest. Determine how to maximize net profit from buying and selling bonds, subject
to the constraints previously described.
The triangular distribution is sometimes used in simulation models because it is more
flexible and intuitive than the normal distribution.

There is often more than one objective in linear programming problems