
A worker-machine chart determines whether worker and machine tasks are strategically
aligned.
Inventory holding costs are an important consideration for the level production strategy.
Poka-yolk is a Japanese term used to describe the removal of waste in a lean production
system.
Extended producer responsibility (EPR) is a concept that holds consumers responsible
for their products following the products’ useful lives.

Common cause (random) variation provides evidence that the process is not in control.
Because the item master file is an input into the MRP process, it should be routinely
updated to reflect any revisions or changes.
Most real-world linear programming problems cannot be solved graphically.
The Monte Carlo technique selects numbers randomly from a probability distribution
for use in a quantitative model.

Six Sigma companies report defective parts per million (PPM) versus the more
traditional defective parts per hundred.
The supply chain for a service tends to be more compacted and less extended than a
supply chain for a manufactured good.
Breakeven analysis examines the cost tradeoffs associated with demand volume when
selecting a process.
One of the basic assumptions for the single-server model is that the calling population
is finite.

Qualitative forecasts use mathematical techniques and statistical formulas.
The range measures the variation within samples versus the variation between samples.
McDonald’s has a reputation for high-quality service resulting from the application of
quality management principles.
The range is the difference between the smallest and largest values in a sample.

Deployment is a step in strategy formulation that evaluates the alignment between core
competencies and order winners.
An order qualifier is the characteristic of a product that wins orders in the marketplace.
Acceptance sampling is based on the premise that a lot contains some acceptable
number of defective items.
A product consists of three components arranged as follows:
If all three components must function for the product to function, then the product’s
overall reliability is approximately
a. 0.812.

b. 0.90.
c. 0.933.
d. 0.95.
Which of the following is not used to calculate probabilistic time estimates?
a) optimistic
b) most likely
c) least likely
d) pessimistic
Consider a production process that produces tires. A quality engineer has taken 15
samples, each containing 200 tires. The total number of defective tires over the 15
samples is 340. The sample standard deviation is
a. 0.005
b. 0.011
c. 0.022
d. 0.028

Inventory turnover is computed by
a. dividing the cost of goods sold by the average aggregate inventory value.
b. dividing the average aggregate inventory value by costs of goods sold.
c. multiplying the average aggregate inventory value by cost of goods sold.
d. subtracting cost of goods sold from the average aggregate inventory value.
Quality function deployment (QFD) is
a. a software systems that uses computer graphics to assist in designing products.
b. a systematic approach to analyzing the causes and effects of product failures.
c. a visual method for analyzing the interrelationships among failures.
d. a structured process that translates the voice of the customer into technical design
requirements.

The difference between planned production and customer orders is known as
a. the master production schedule.
b. available-to-promise.
c. capable-to-promise.
d. the disaggregate plan.
A control chart that uses the actual number of defects per item to monitor a process is
known as a
a. p-chart
b. c-chart
c. R-chart
d. -chart
The estimated mean time for an activity with a most likely time (m) equal to 12 weeks,
an optimistic time (a) equal to 9 weeks, and a pessimistic time (b) equal to 18 weeks is
a. 13.0 weeks.
b. 12.75 weeks.
c. 12.5 weeks.
d. 9.0 weeks.
The project management process encompasses
a. planning.
b. scheduling.
c. control.
d. All of these answer choices are correct.
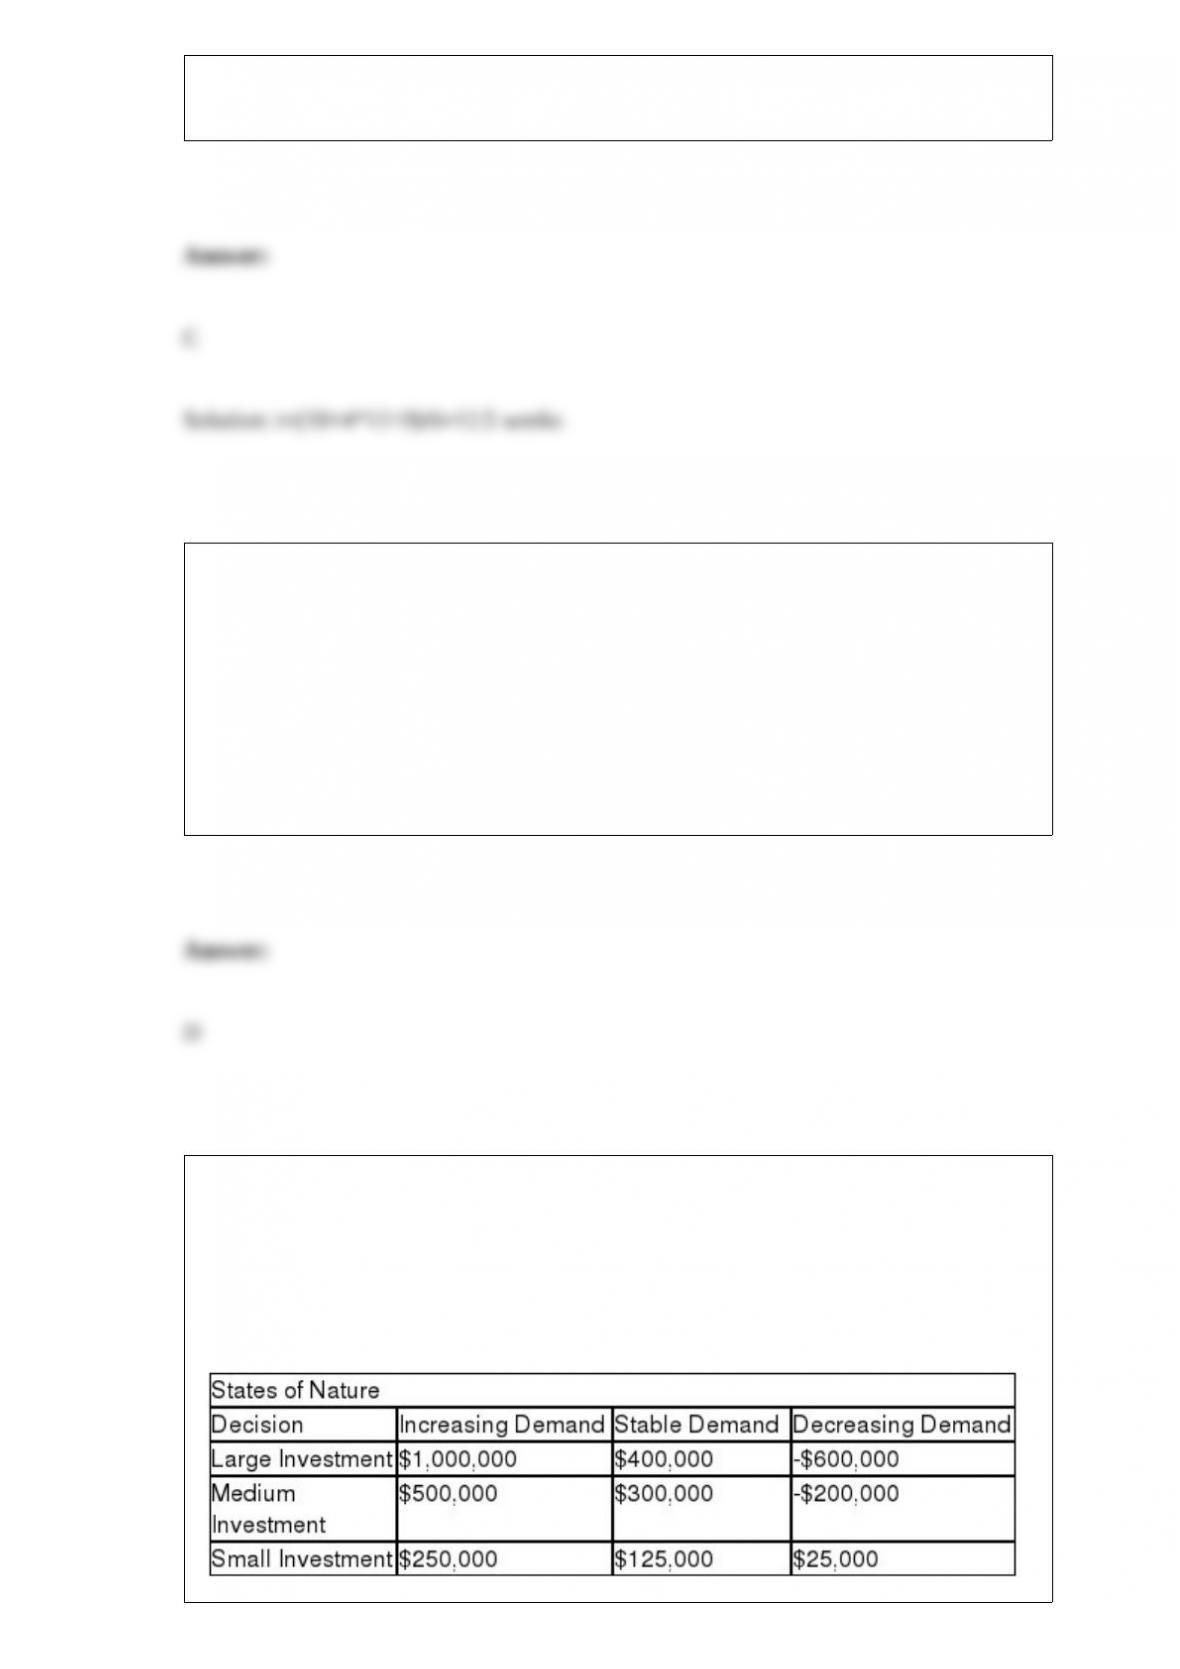
Fairco, a family business, is considering making an investment in its manufacturing
operation. Three decisions are under consideration: (1) a large investment; (2) a
medium investment; and (3) a small investment. The business believes that there are
three possible future outcomes for its product: (1) increasing demand; (2) stable
demand; and (3) decreasing demand. The following payoff table describes the decision
situation.
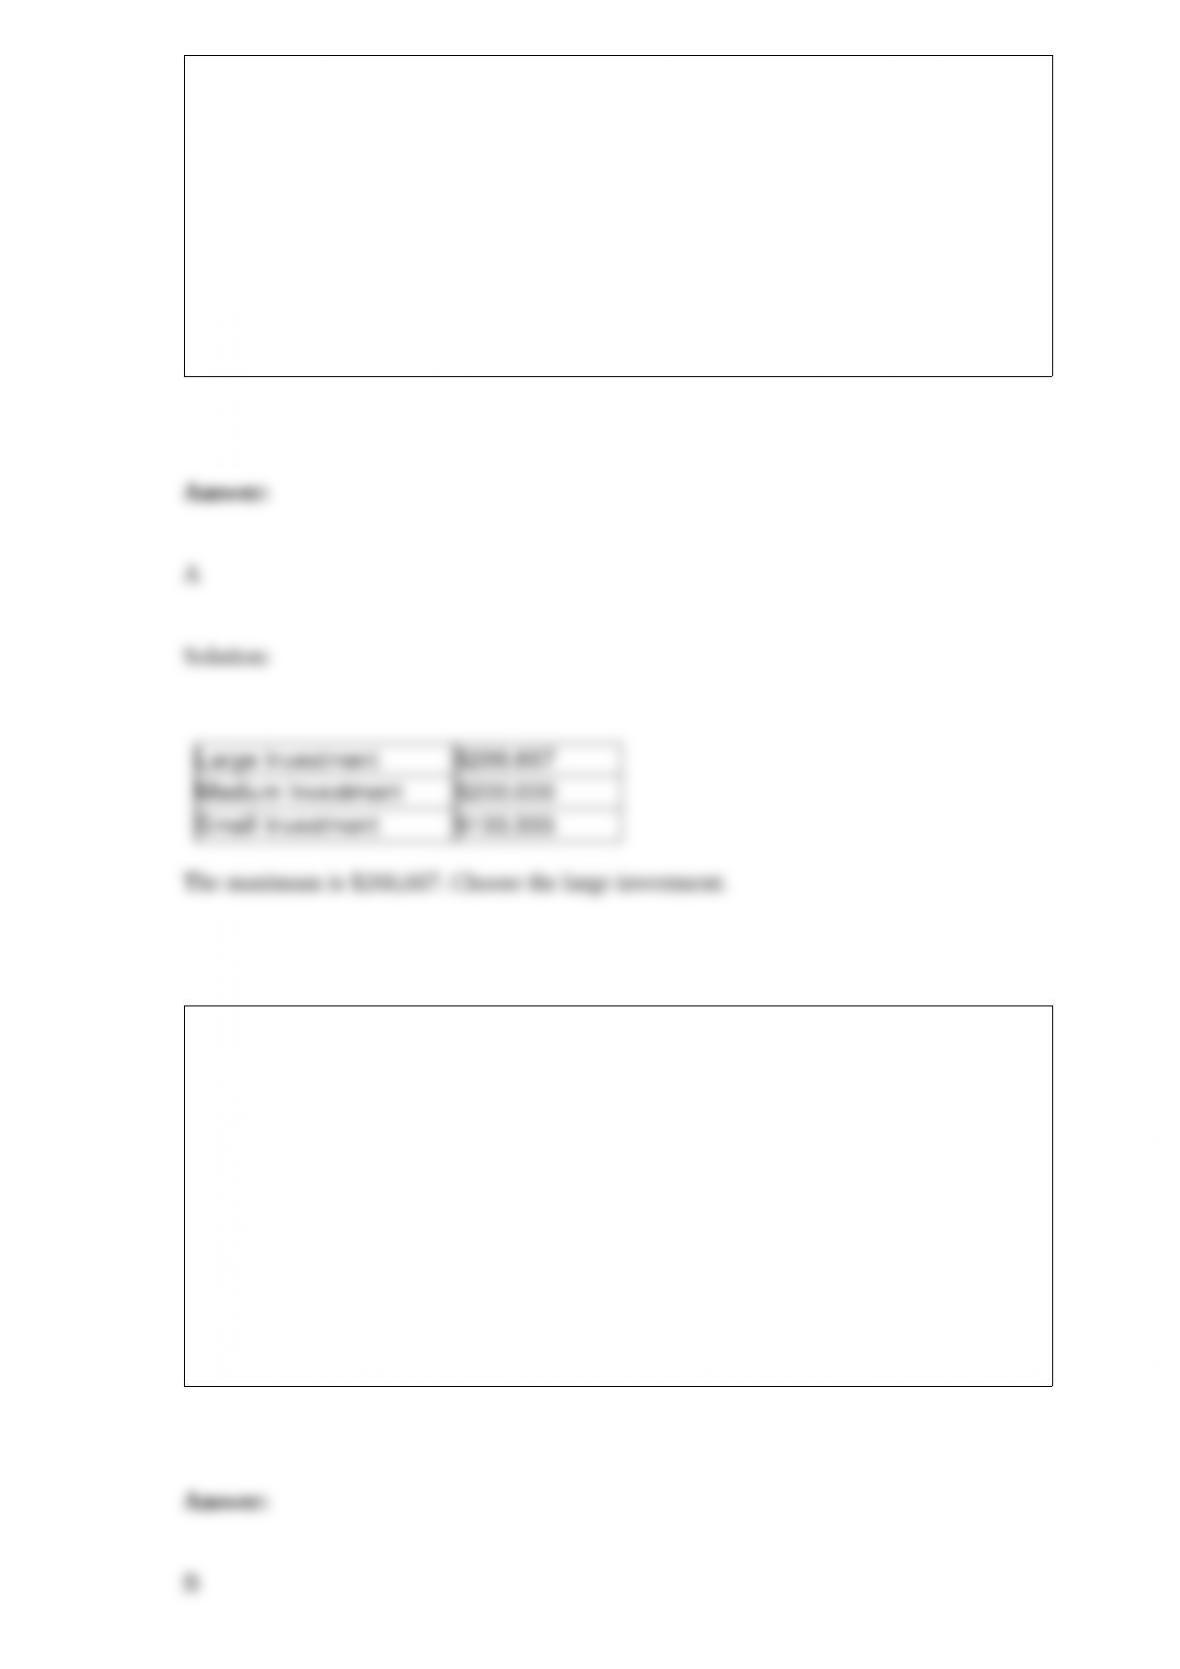
The best decision for Fairco using the equal likelihood criterion would be to
a. make the large investment.
b. make the medium investment.
c. make the small investment.
d. choose increasing demand.
A service counter employs two servers. On average, a server requires 8 minutes to
process a customer and service times follow an exponential distribution. Customers
arrive at the counter at the rate of 12 per hour according to a Poisson distribution. The
service rate per server for this system is
a. 3.75 customers per hour.
b. 7.5 customers per hour.
c. 8 customers per hour.
d. 16 customers per hour.
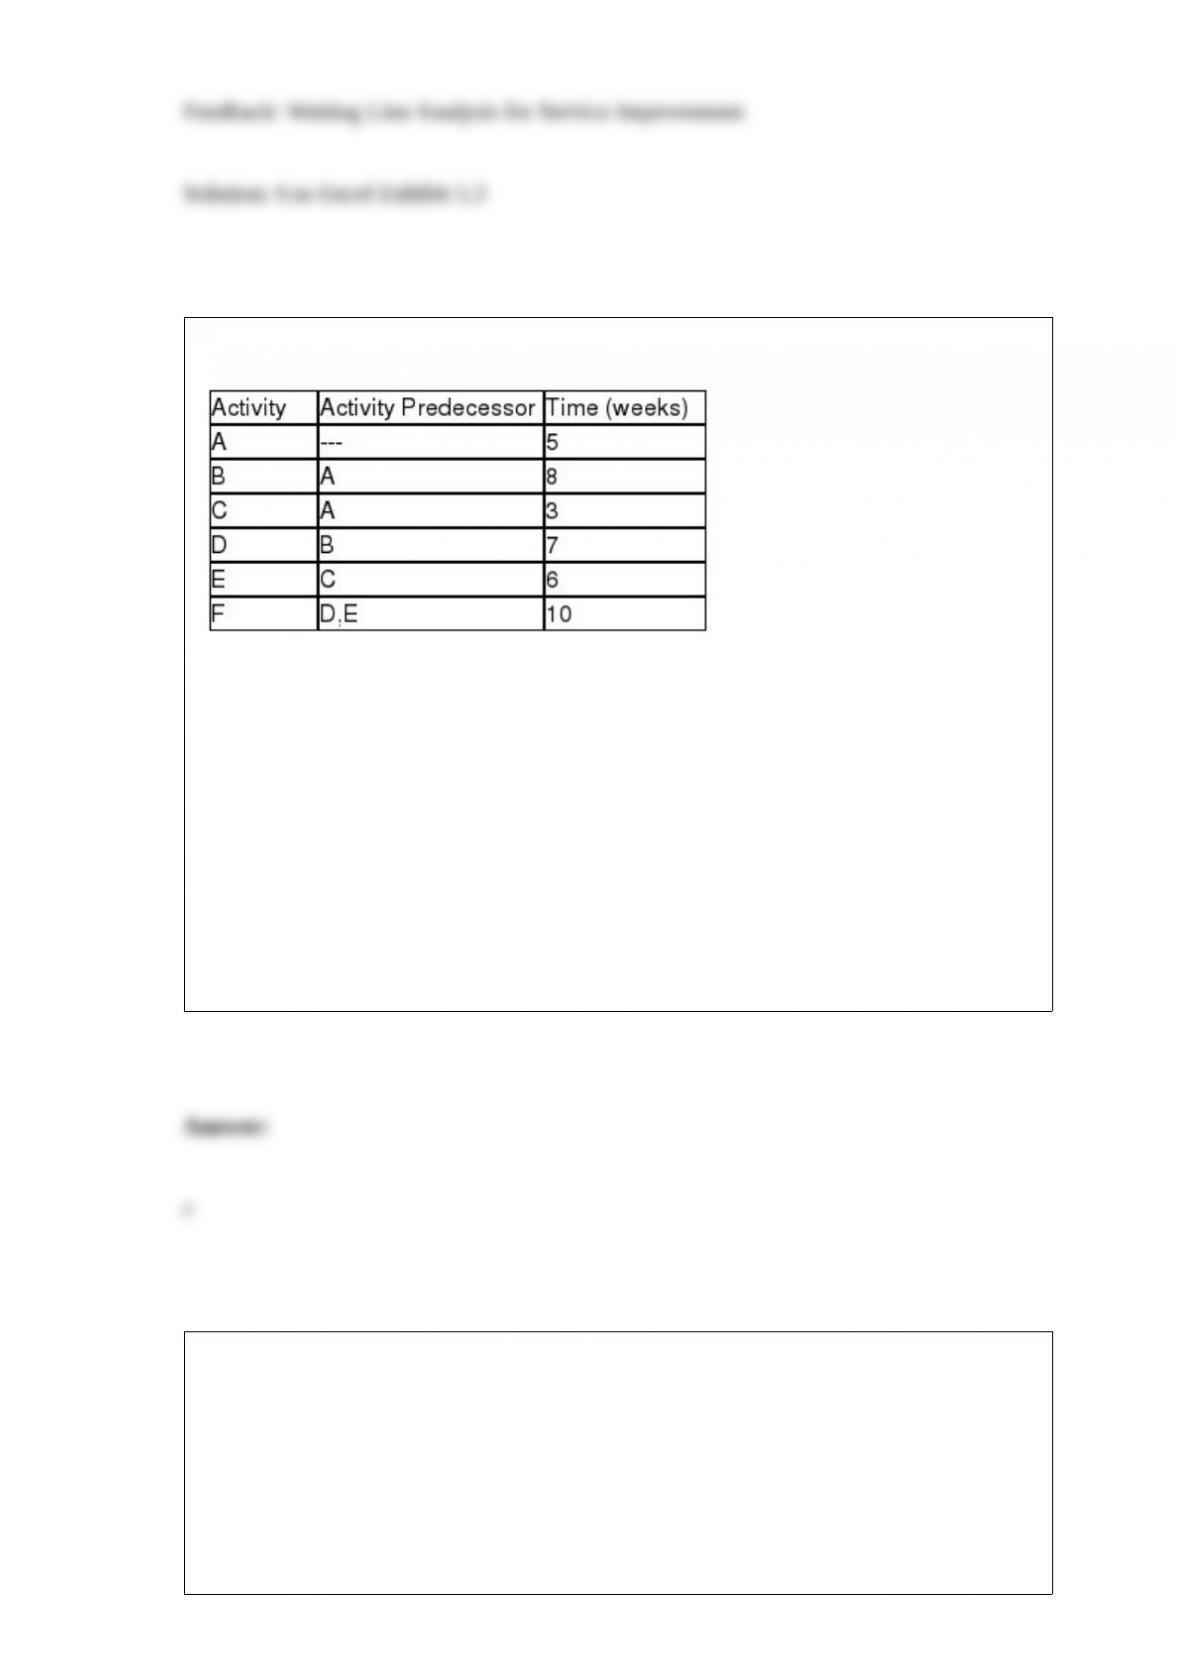
A project consists of the following activities:
Table XX
The amount of slack associated with activity C is
a. 0 weeks.
b. 3 weeks.
c. 6 weeks.
d. None of these answer choices is correct.
The purchasing of goods and services from suppliers is called
a. sourcing.
b. offshoring.
c. procurement.

d. None of these choices is correct.
Cluster analysis is a tool that
a. discovers trends, predicts future events, and assesses possible course of action.
b. searches for exact relationships between variables.
c. identifies groups of data that fall naturally together.
d. None of these answer choices is correct.
The _________________ is the maximumrepresents the upper limit to the number of
defective items a customer will accept in a lot.
a. producer’s risk
b. consumer’s risk
c. average outgoing quality
d. lot tolerance percent defective (LTPD)
_____________ represents what the firm is in the business of doing.
a. Primary task
b. Core competency
c. Positioning
d. Deploying
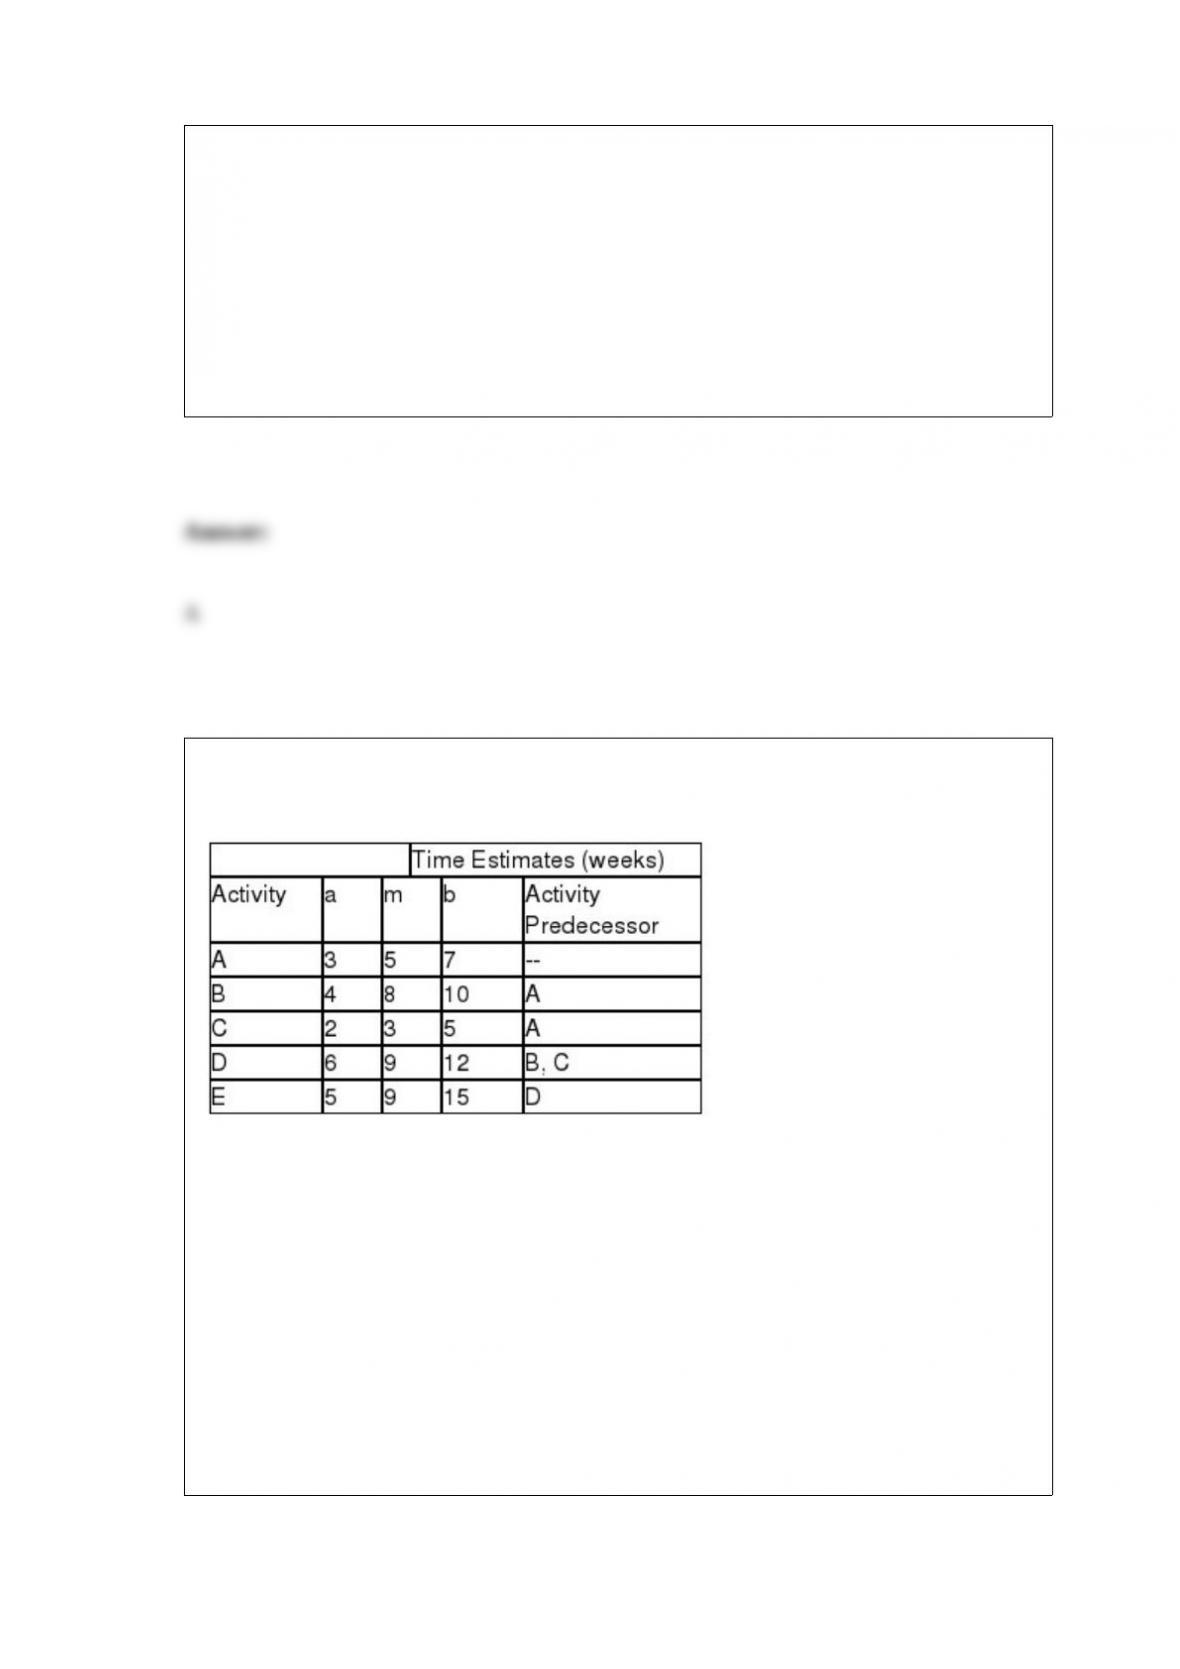
The following table of probabilistic time estimates (in weeks) and activity predecessors
are provided for a project.
Table ZZ
The earliest start (ES) time for activity D is
a. 8.17 weeks.
b. 12.67 weeks.
c. 18.33 weeks.
d. 21.67 weeks.

Analyzing process flow and eliminating waste is referred to as
a. just-in-time.
b. the Toyota Production System.
c. value stream mapping
d. total productive maintenance.
Which of the following is a quantitative measure of reliability?
a. reliability bar
b. maintainability
c. mean time between failures (MTBF)
d. mean time to repair (MTTR)
Briefly discuss the two primary objectives of aggregate planning.
Explain the concept of landed cost and discuss how it is used to make global sourcing
decisions.
Explain the relationship between ordering costs and carrying costs in the economic
order quantity (EOQ) model.
What is the master production schedule (MPS) and what role does in play in the
material requirements planning (MRP) process?
What is the bullwhip effect and how does it occur?