Consider the following discrete nonlinear programming problem.
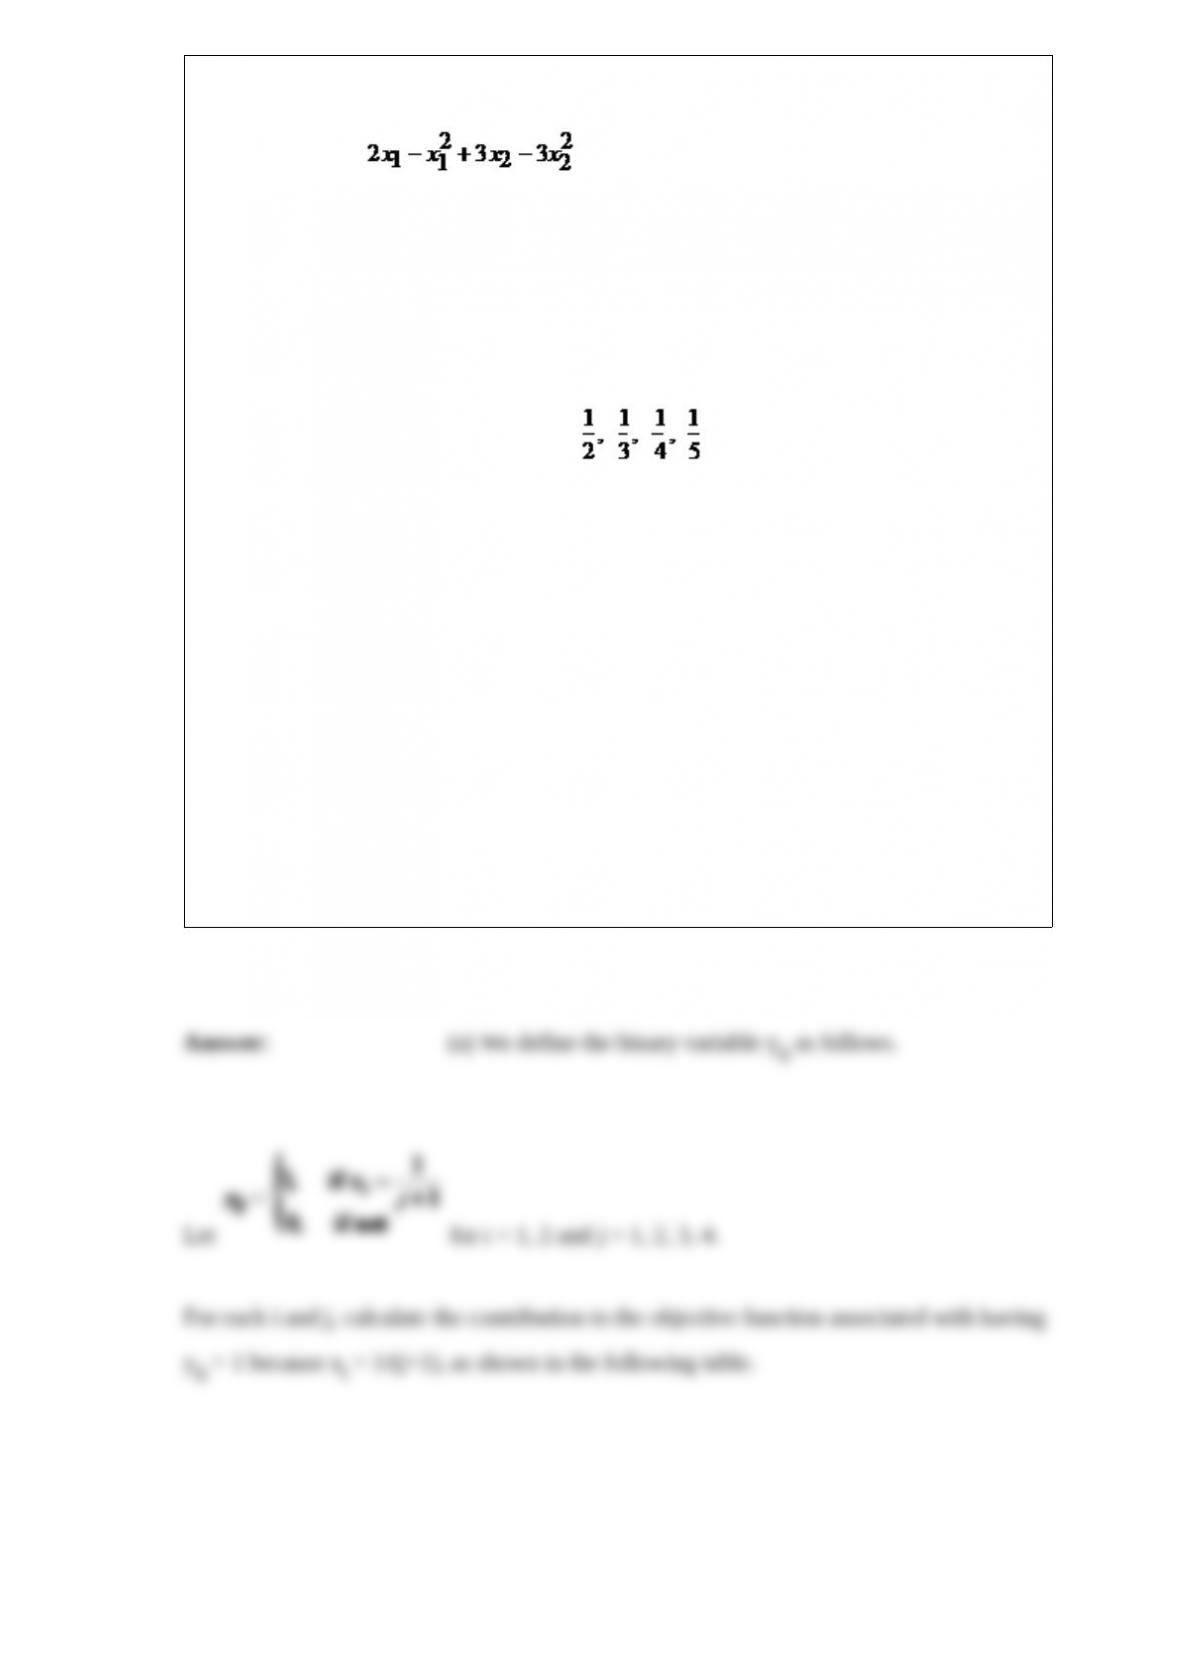
Maximize Z = ,
subject to
x1 + x2 =< 0.75
and
each variable is restricted to the values: .
(a) Reformulate this problem as a pure binary integer linear programming problem.
(b) Use the following outline in designing the main features of a branch-and-bound
algorithm for solving this problem (and similar problems) directly without
reformulation.
(1) Specify the tightest possible nonlinear programming relaxation that has only
continuous variables, and so can be solved efficiently by nonlinear programming
techniques.
(2) Specify the fathoming tests.
(3) Specify a branching procedure that involves specifying two ranges of values for a
single variable.
Ken and Larry, Inc., supplies its ice cream parlors with three flavors of ice cream:
chocolate, vanilla, and banana. Due to extremely hot weather and a high demand for its

products, the company has run short of its supply of ingredients: milk, sugar, and
cream. Hence, they will not be able to fill all the orders received from their retail
outlets, the ice cream parlors. Due to these circumstances, the company has decided to
choose the amount of each flavor to produce that will maximize total profit, given the
constraints on supply of the basic ingredients.
The chocolate, vanilla, and banana flavors generate, respectively, $1.00, $0.90, and
$0.95 of profit per gallon sold. The company has only 200 gallons of milk, 150 pounds
of sugar, and 60 gallons of cream left in its inventory. The linear programming
formulation for this problem is shown below in algebraic form.
Let C = gallons of chocolate ice cream produced,
V = gallons of vanilla ice cream produced,
B = gallons of banana ice cream produced.
Maximize Profit = 1.00 C + 0.90 V + 0.95 B,
subject to
Milk: 0.45 C + 0.50 V + 0.40 B =< 200 gallons
Sugar: 0.50 C + 0.40 V + 0.40 B =< 150 pounds
Cream: 0.10 C + 0.15 V + 0.20 B =< 60 gallons
and
C >= 0, V >= 0, B >= 0.
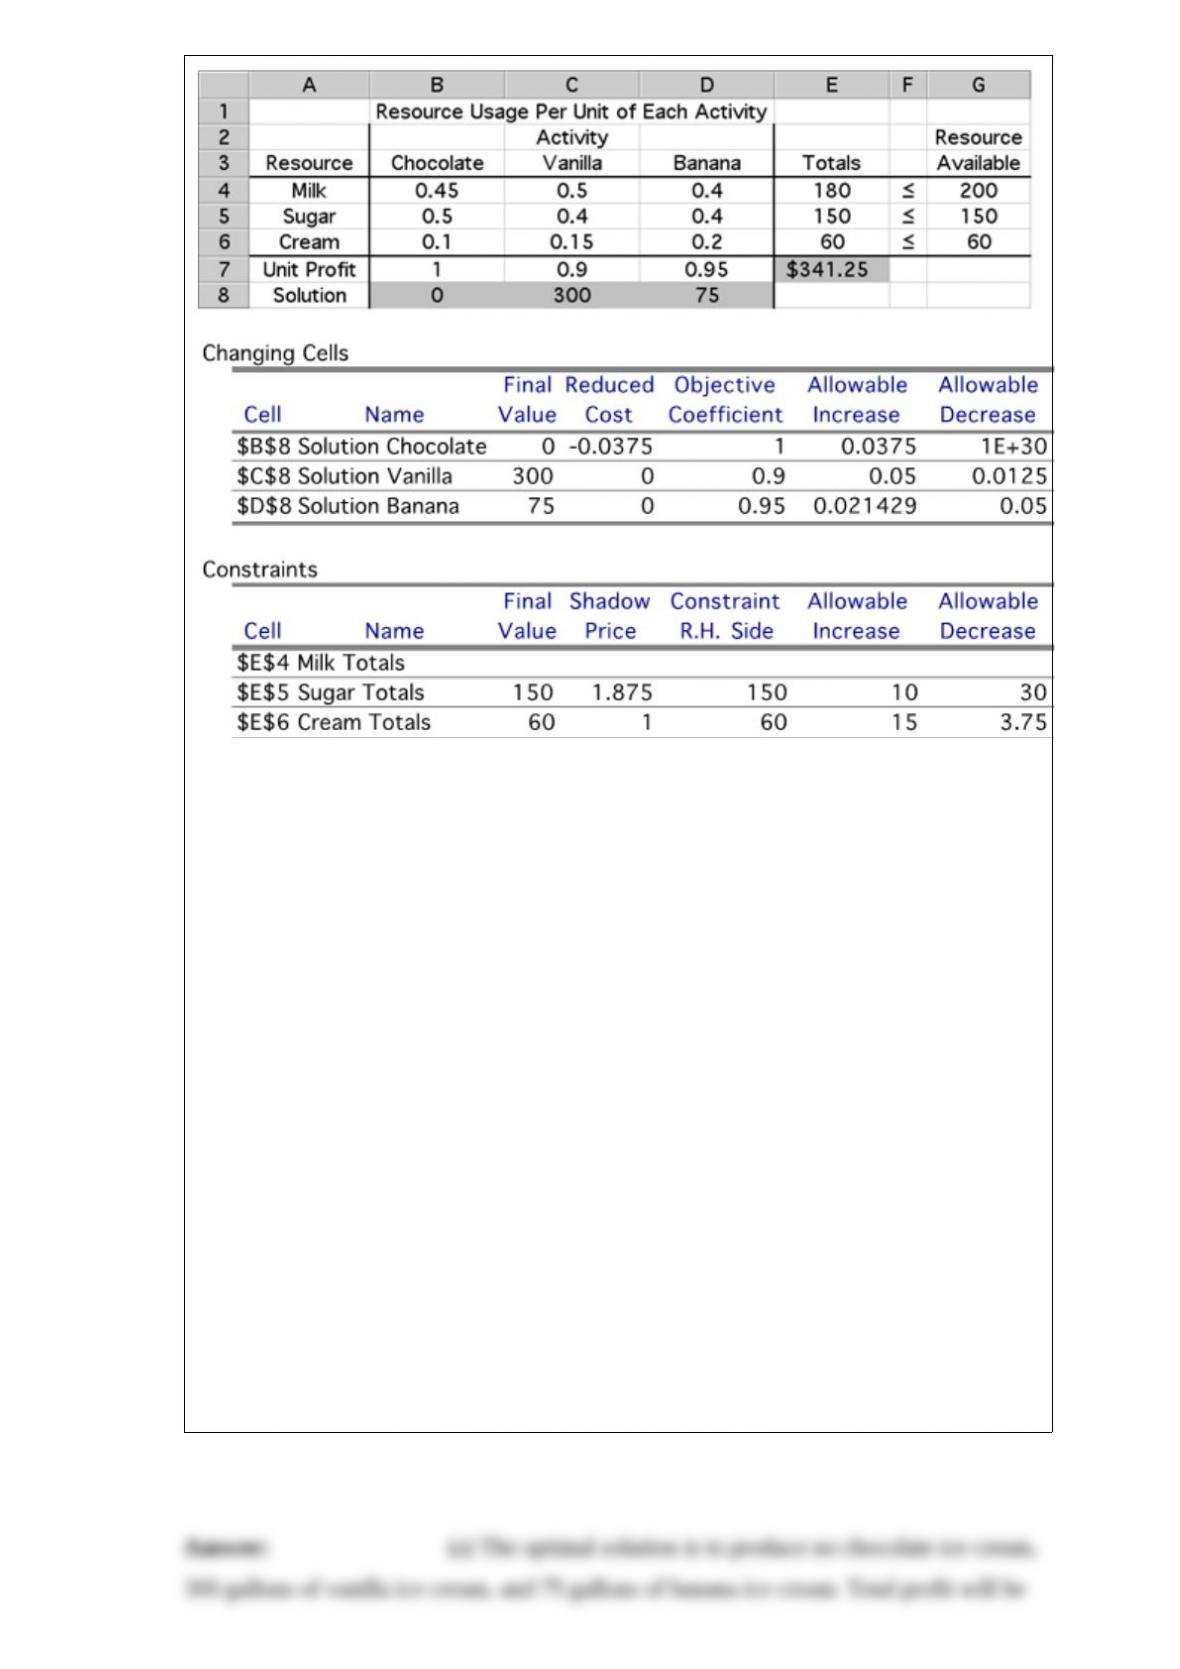
This problem was solved using the Excel Solver. The spreadsheet (already solved) and
the sensitivity report are shown below. [Note: The numbers in the sensitivity report for
the milk constraint are missing on purpose, since you will be asked to fill in these
numbers in part (f).]
For each of the following parts, answer the question as specifically and completely as is
possible without solving the problem again on the Excel Solver. Note: Each part is
independent (i.e., any change made to the model in one part does not apply to any other
parts).
(a) What is the optimal solution and total profit?
() Suppose the profit per gallon of banana changes to $1.00. Will the optimal solution
change, and what can be said about the effect on total profit?
(c) Suppose the profit per gallon of banana changes to 92¢. Will the optimal solution
change, and what can be said about the effect on total profit?
(d) Suppose the company discovers that 3 gallons of cream have gone sour and so must
be thrown out. Will the optimal solution change, and what can be said about the effect
on total profit?
(e) Suppose the company has the opportunity to buy an additional 15 pounds of sugar at
a total cost of $15. Should they? Explain.
(f) Fill in all the sensitivity report information for the milk constraint, given just the
optimal solution for the problem. Explain how you were able to deduce each number.
Consider the following problem.
Maximize Z = 3x1 + x2 + 2x3,
subject to
x1 – x2 + 2x3 =< 20
2x1 + x2 – x3 =< 10
and
x1 >= 0, x2 >= 0, x3 >= 0.
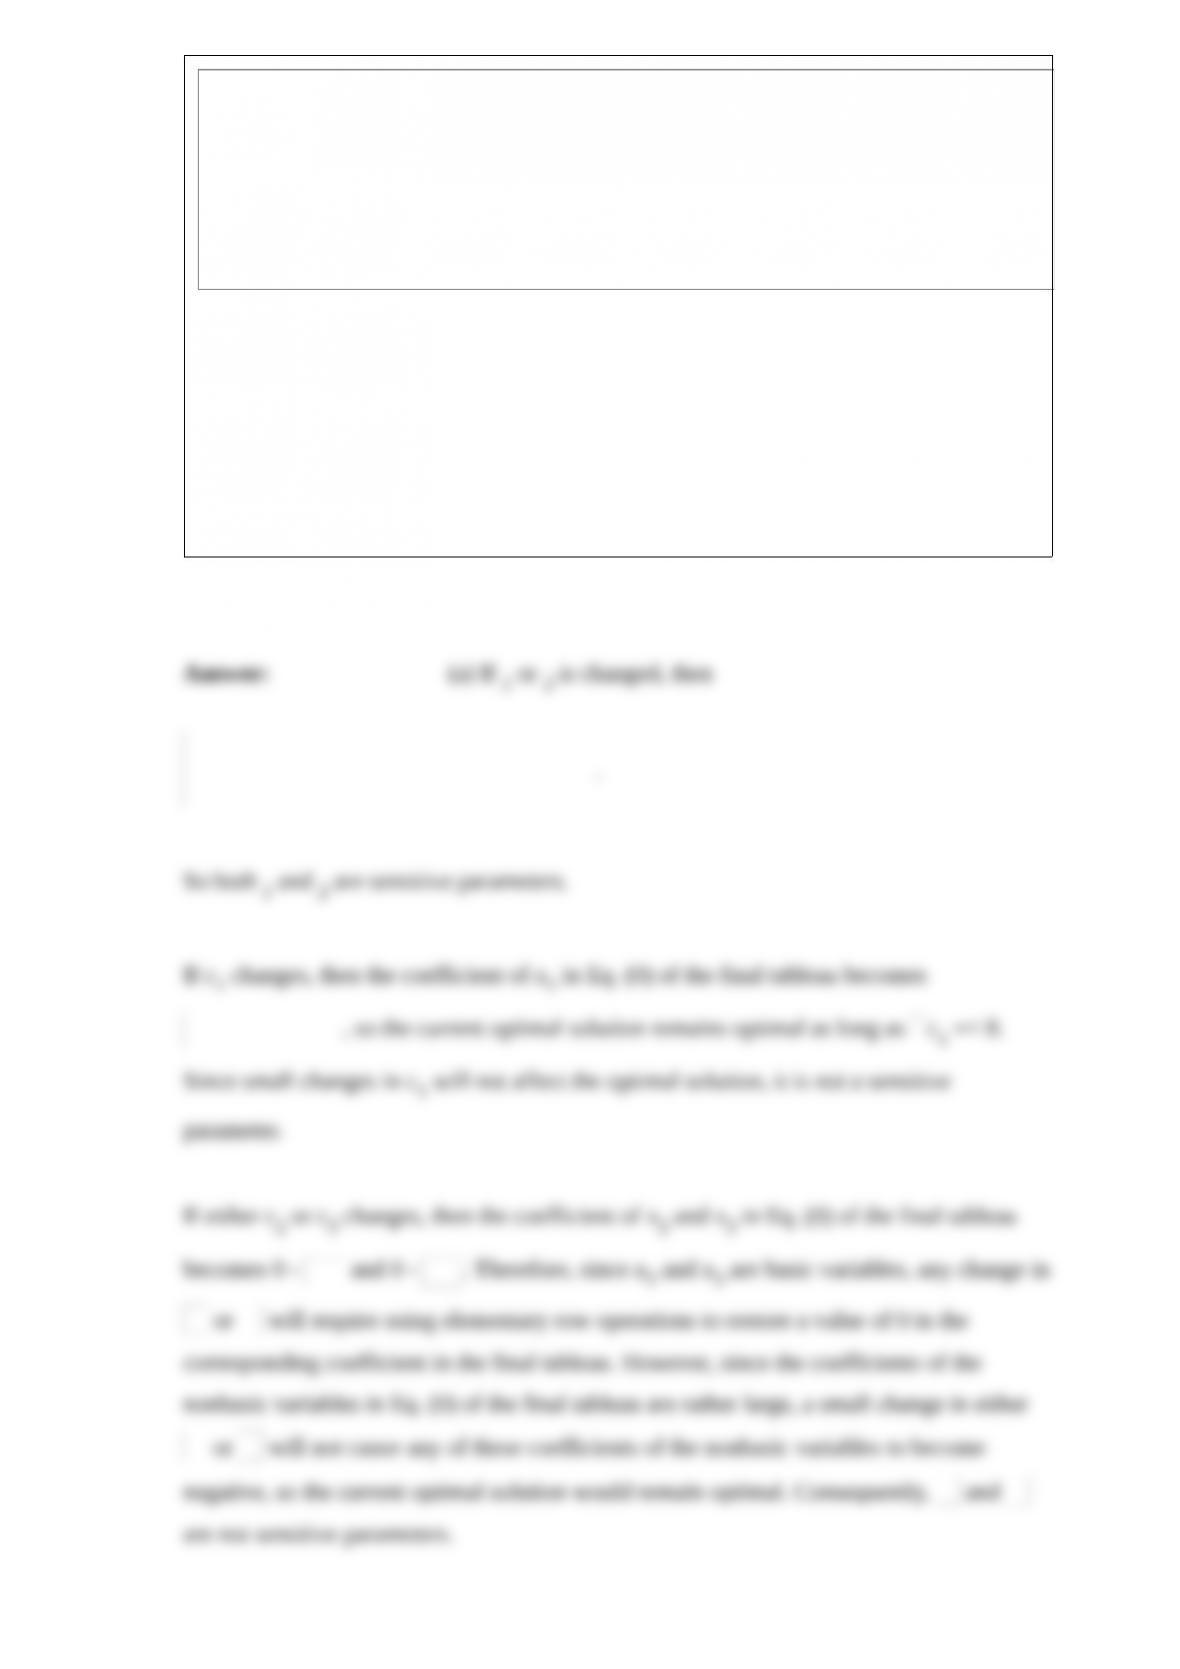
Let x4 and x5 denote the slack variables for the respective functional constraints. After
we apply the simplex method, the final simplex tableau is
(a) Perform sensitivity analysis to determine which of the 11 parameters of the model
are sensitive parameters in the sense that even small changes in just that parameter’s
value might change the optimal solution.
(b) Use algebraic analysis to find the allowable range to stay optimal for each cj..
(c) Use algebraic analysis to find the allowable range for each i.

Consider a single-server queueing system with a Poisson input, where the server must
perform two distinguishable tasks in sequence for each customer, so the total service
time is the sum of the two task times (which are statistically independent), where times
are being expressed in units of a minute.
(a) Suppose that the first task time has an exponential distribution with a mean of 3
minutes and that the second task time has an Erlang distribution with a mean of 9
minutes and with the shape parameter k = 3. Which queueing theory model should be
used to represent this system? Also identify the parameters of the model.
(b) Suppose that part (a) is modified so that the first task time also has an Erlang
distribution with the shape parameter k = 3 (but with the mean still equal to 3 minutes).
Which queueing theory model should be used to represent this system? Also identify
the parameters of the model.
Exxo 76 is an oil company that operates the pipeline network shown below, where each
pipeline is labeled with its maximum flow rate in million cubic feet (MMcf) per day. A
new oil well has been constructed near A. They would like to transport oil from the well
near A to their refinery at G. Formulate and solve a network optimization model to
determine the maximum flow rate from A to G.



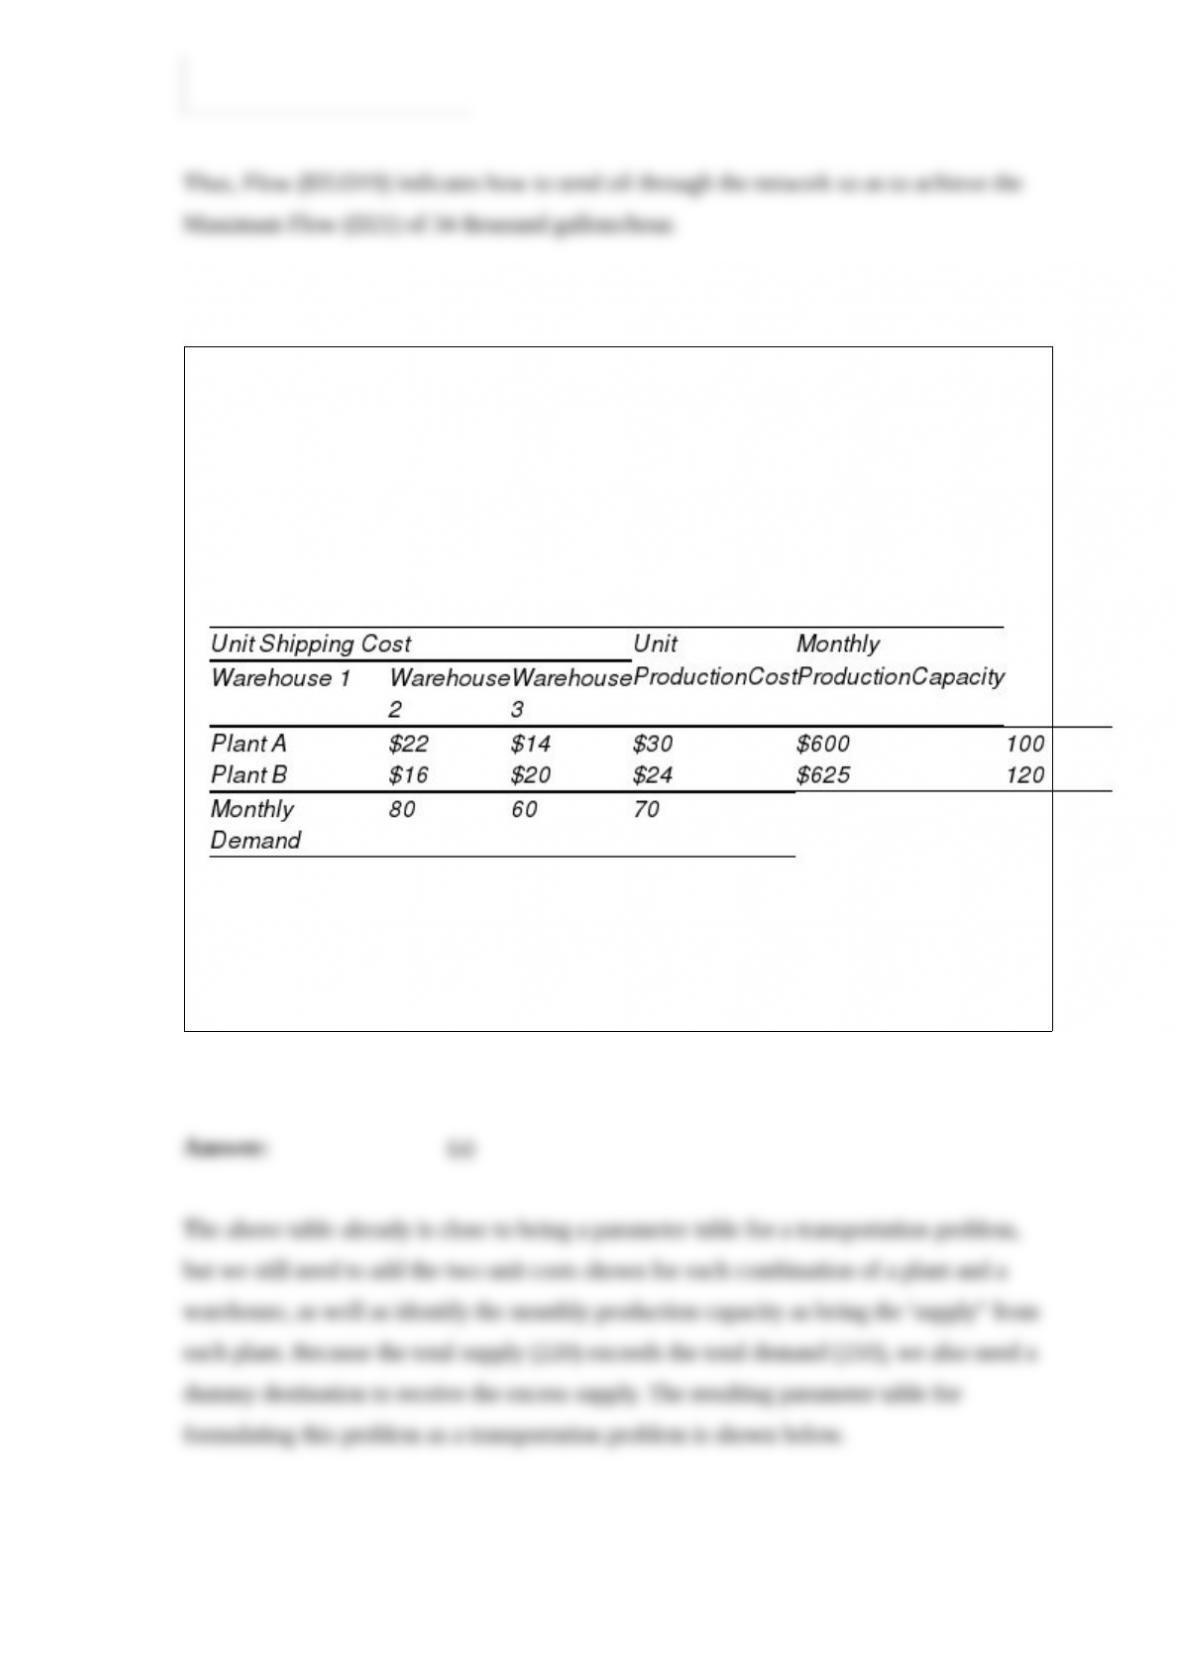
Heart Start produces automated external defibrillators (AEDs) in each of two different
plants (A and B). The unit production costs and monthly production capacity of the two
plants are indicated in the table below. The AEDs are sold through three wholesalers.
The shipping cost from each plant to the warehouse of each wholesaler along with the
monthly demand from each wholesaler are also indicated in the table. How many AEDs
should be produced in each plant, and how should they be distributed to each of the
three wholesaler warehouses so as to minimize the combined cost of production and
shipping?
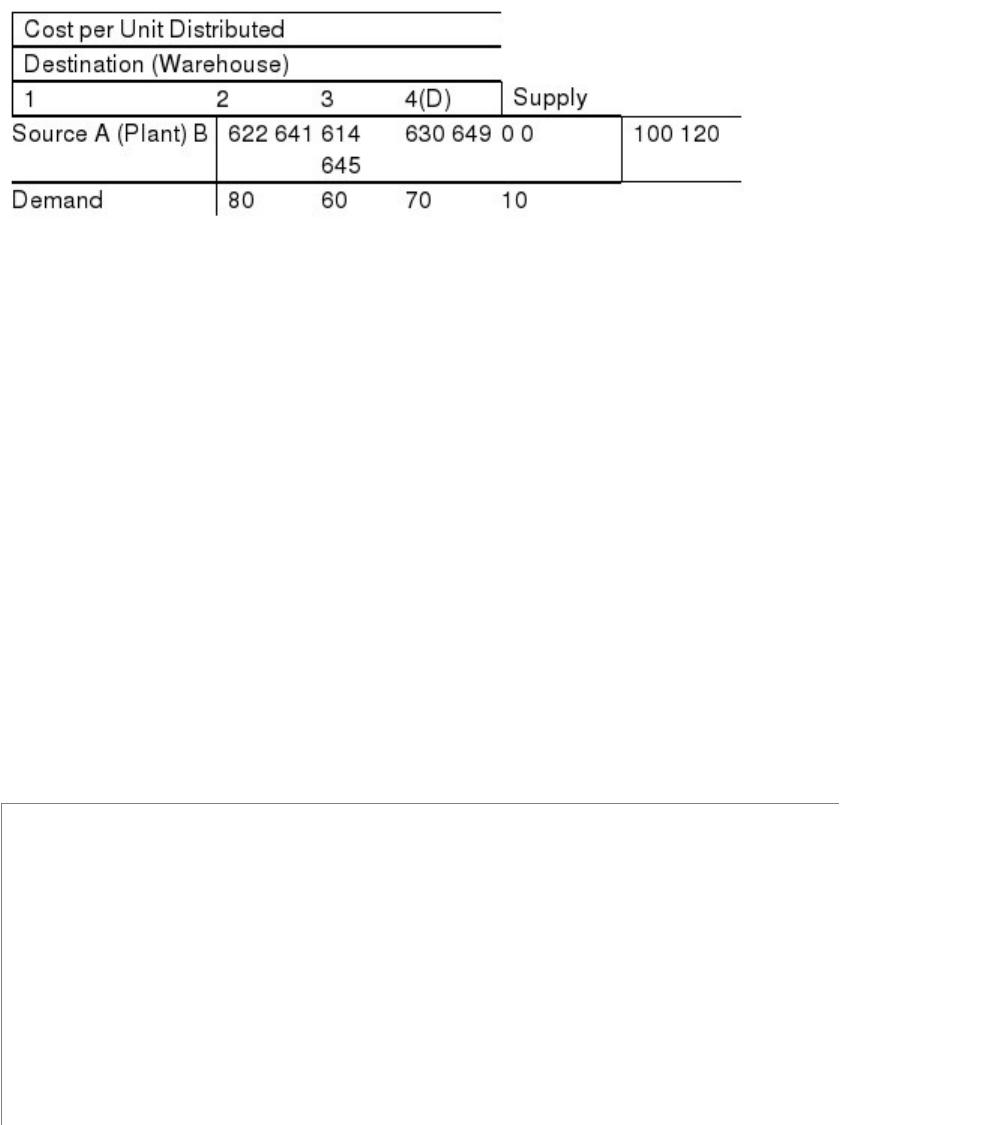
(a) Formulate this problem as a transportation problem by constructing the appropriate
parameter table.
(b) Formulate and solve a linear programming model in a spreadsheet for this problem.



Decora Accessories manufactures a variety of bathroom accessories, including
decorative towel rods and shower curtain rods. Each of the accessories includes a rod
made out of stainless steel. However, many different lengths are needed: 12″, 18″, 24″,
40″, and 60″. Decora purchases 60″ rods from an outside supplier and then cuts the rods
as needed for their products. Each 60″ rod can be used to make a number of smaller
rods. For example, a 60″ rod could be used to make a 40″ and an 18″ rod (with 2″ of
waste), or 5 12″ rods (with no waste). For the next production period, Decora needs 25
12″ rods, 52 18″ rods, 45 24″ rods, 30 40″ rods, and 12 60″ rods. What is the fewest
number of 60″ rods that can be purchased to meet their production needs?
(a) Formulate an integer programming model in algebraic form for this problem.
(b) Formulate and solve an integer programming model in a spreadsheet for this
problem.

The Copy Shop is open 5 days per week for copying materials that are brought to the
shop. It has three identical copying machines that are run by employees of the shop.
Only two operators are kept on duty to run the machines, so the third machine is a spare
that is used only when one of the other machines breaks down. When a machine is
being used, the time until it breaks down has an exponential distribution with a mean of
2 weeks. If one machine breaks down while the other two are operational, a service
representative is called in to repair it, in which case the total time from the breakdown
until the repair is completed has an exponential distribution with a mean of 0.2 week.
However, if a second machine breaks down before the first one has been repaired, the
third machine is shut off while the two operators work together to repair this second
machine quickly, in which case its repair time has an exponential distribution with a
mean of only 1/15 week. If the service representative finishes repairing the first
machine before the two operators complete the repair of the second, the operators go
back to running the two operational machines while the representative finishes the
second repair, in which case the remaining repair time has an exponential distribution
with a mean of 0.2 week.
(a) Letting the state of the system be the number of machines not working, construct the
rate diagram for this queueing system.
(b) Use the balance equations to find the steady-state distribution of the number of
machines not working.
(c) What is the expected number of operators available for copying?
Suppose you are applying a simulated annealing algorithm to a certain problem, where
T is the parameter that measures the tendency to accept the current candidate to be the
next trial solution. You now have come to an iteration where the current value of T is T
= 4, the value of the objective function for the current trial solution is 40, and the value
of the objective function for the current candidate to be the next trial solution is 36.
(a) Using the standard move selection rule, determine the probability of accepting this
candidate to be the next trial solution when the objective is maximization of the
objective function.
What is this probability when the objective is instead minimization of the objective
function?
The General Ford Motors Corporation (GFMC) is planning the introduction of a brand
new SUV – the Vector. There are two options for production. One is to build the Vector
at the company’s existing plant in Indiana, sharing production time with its line of
minivans that are currently being produced there. If sales of the Vector are just
moderate, this will work out well as there is sufficient capacity to produce both types of
vehicles at the same plant. However, if sales of the Vector are strong, this option would
require the operation of a third shift, which would lead to significantly higher costs. A
second option is to open a new plant in Georgia. This plant would have sufficient
capacity to meet even the largest projections for sales of the Vector. However, if sales
are only moderate, the plant would be underutilized and therefore less efficient. This is
a new design, so sales are hard to predict. However, GFMC predicts that there would be
about a 60% chance of strong sales (annual sales of 100,000), and a 40% chance of
moderate sales (annual sales of 50,000). The average revenue per Vector sold is
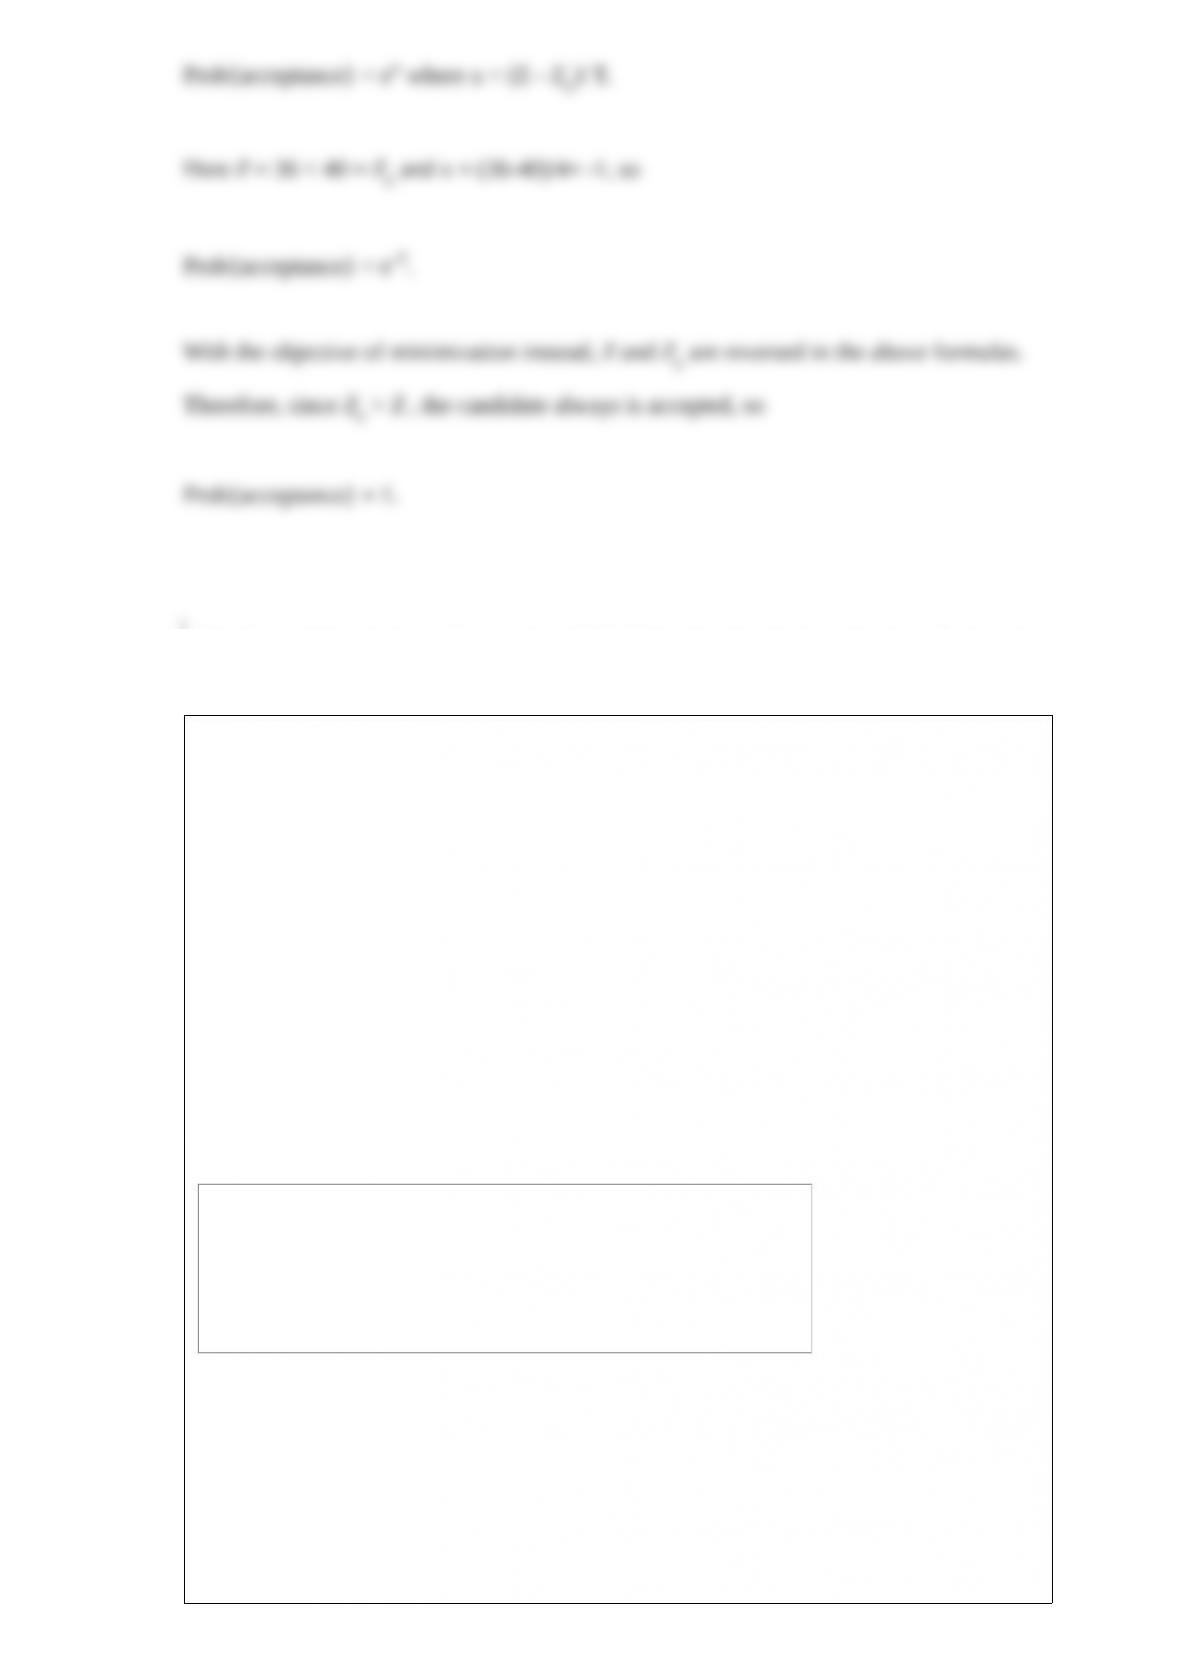
$30,000. Production costs per vehicle for the two production options depend upon sales,
as indicated in the table below.
The amortized annual cost of plant construction and other associated fixed costs for the
Georgia plant would total $400 million per year (regardless of sales volume). The fixed
costs for adding Vector production to the plant in Indiana would total $200 million per
year (regardless of sales volume).
Construct a decision tree to determine which production option maximizes the expected
annual profit, considering fixed costs, production costs, and sales revenues.
Due to the uncertainty in expected sales for the Vector, GFMC is considering
conducting a marketing survey to determine customer attitudes toward the Vector and
better predict the likelihood of strong sales. The marketing survey would give one of
two results – a positive attitude or a negative attitude toward the design. GFMC has
used this marketing survey for other vehicles. For vehicles that eventually had strong
sales, the marketing survey indicated positive attitudes toward the design 70% of the
time and negative attitudes 30% of the time. For vehicles that eventually had moderate
sales, the marketing survey indicated positive attitudes toward the design 20% of the
time and negative attitudes 80% of the time. Assuming GFMC conducts such a survey,
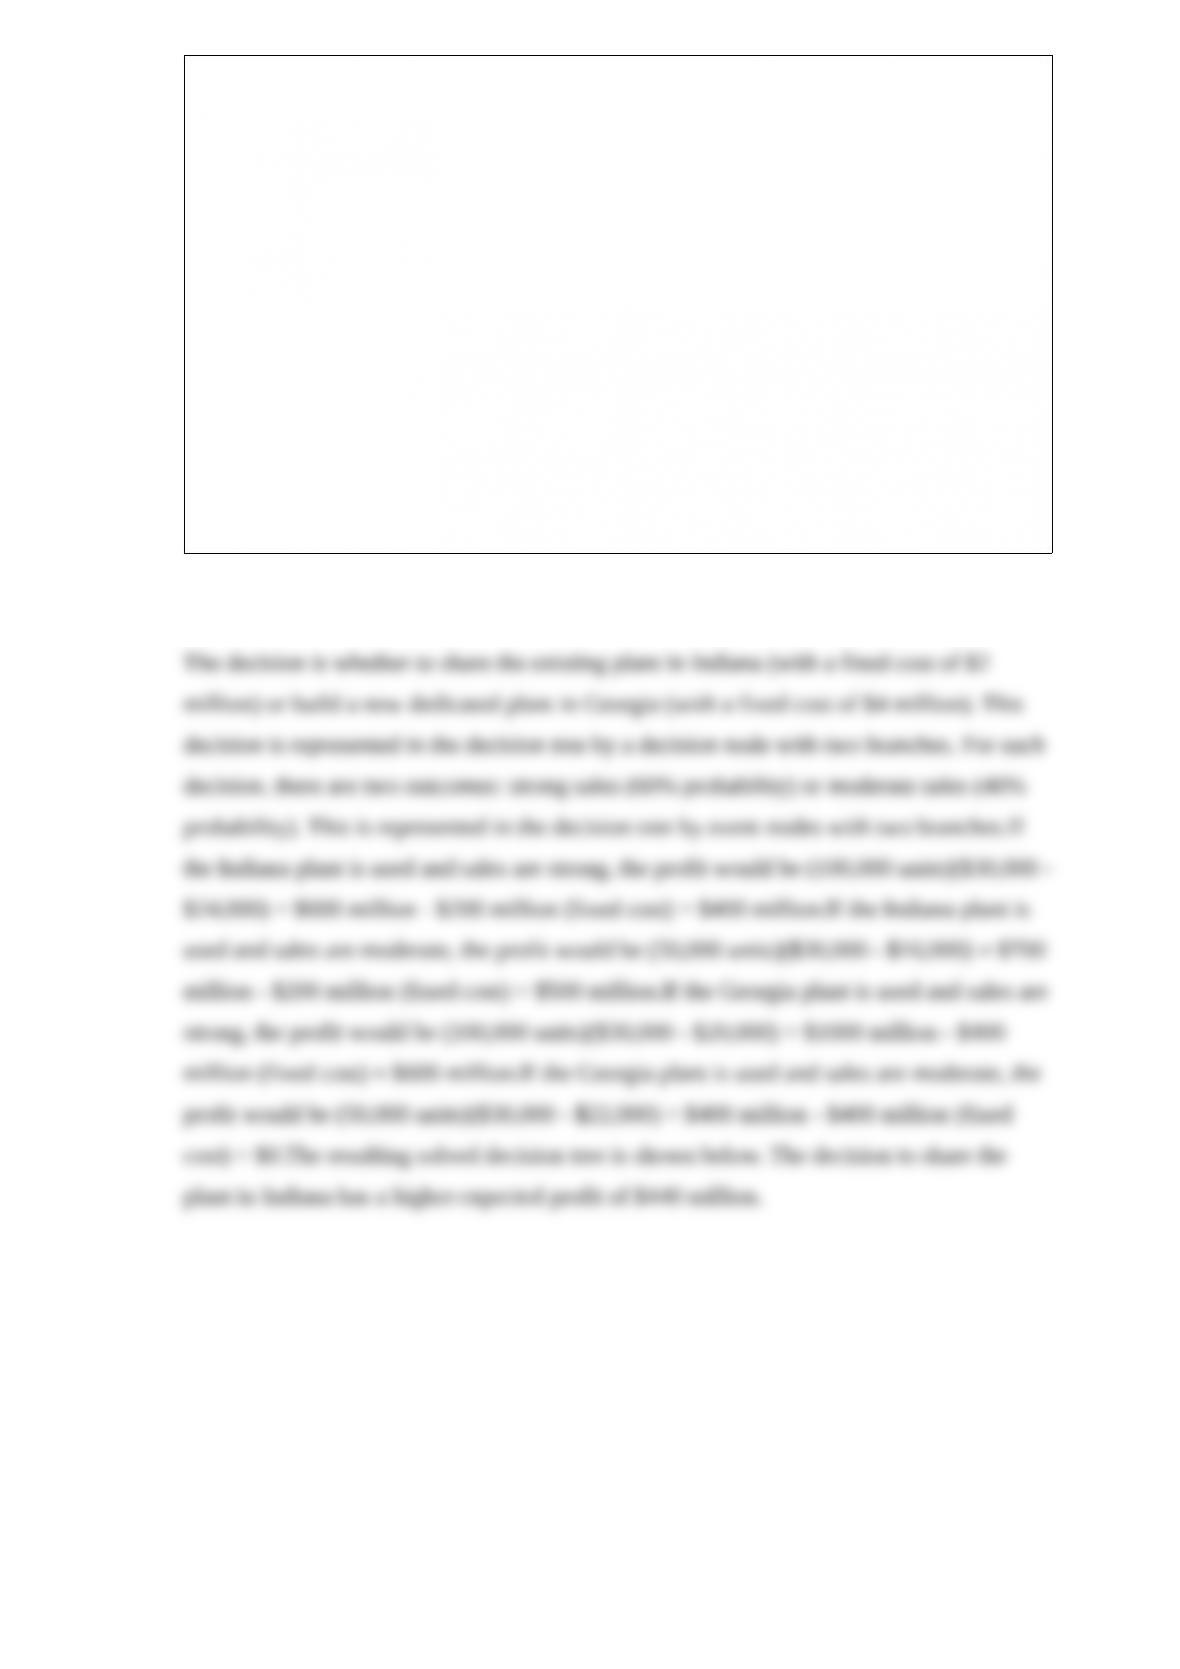
construct a decision tree to determine how the company should proceed and what the
expected annual profit would be (ignoring the cost of the survey).
What is the expected value of experimentation (EVE) in part b? What does this say
about how large the cost of the marketing survey can be before it would no longer be
worthwhile to conduct the survey?


Business travelers tend to be less price sensitive than leisure travelers. Knowing this,
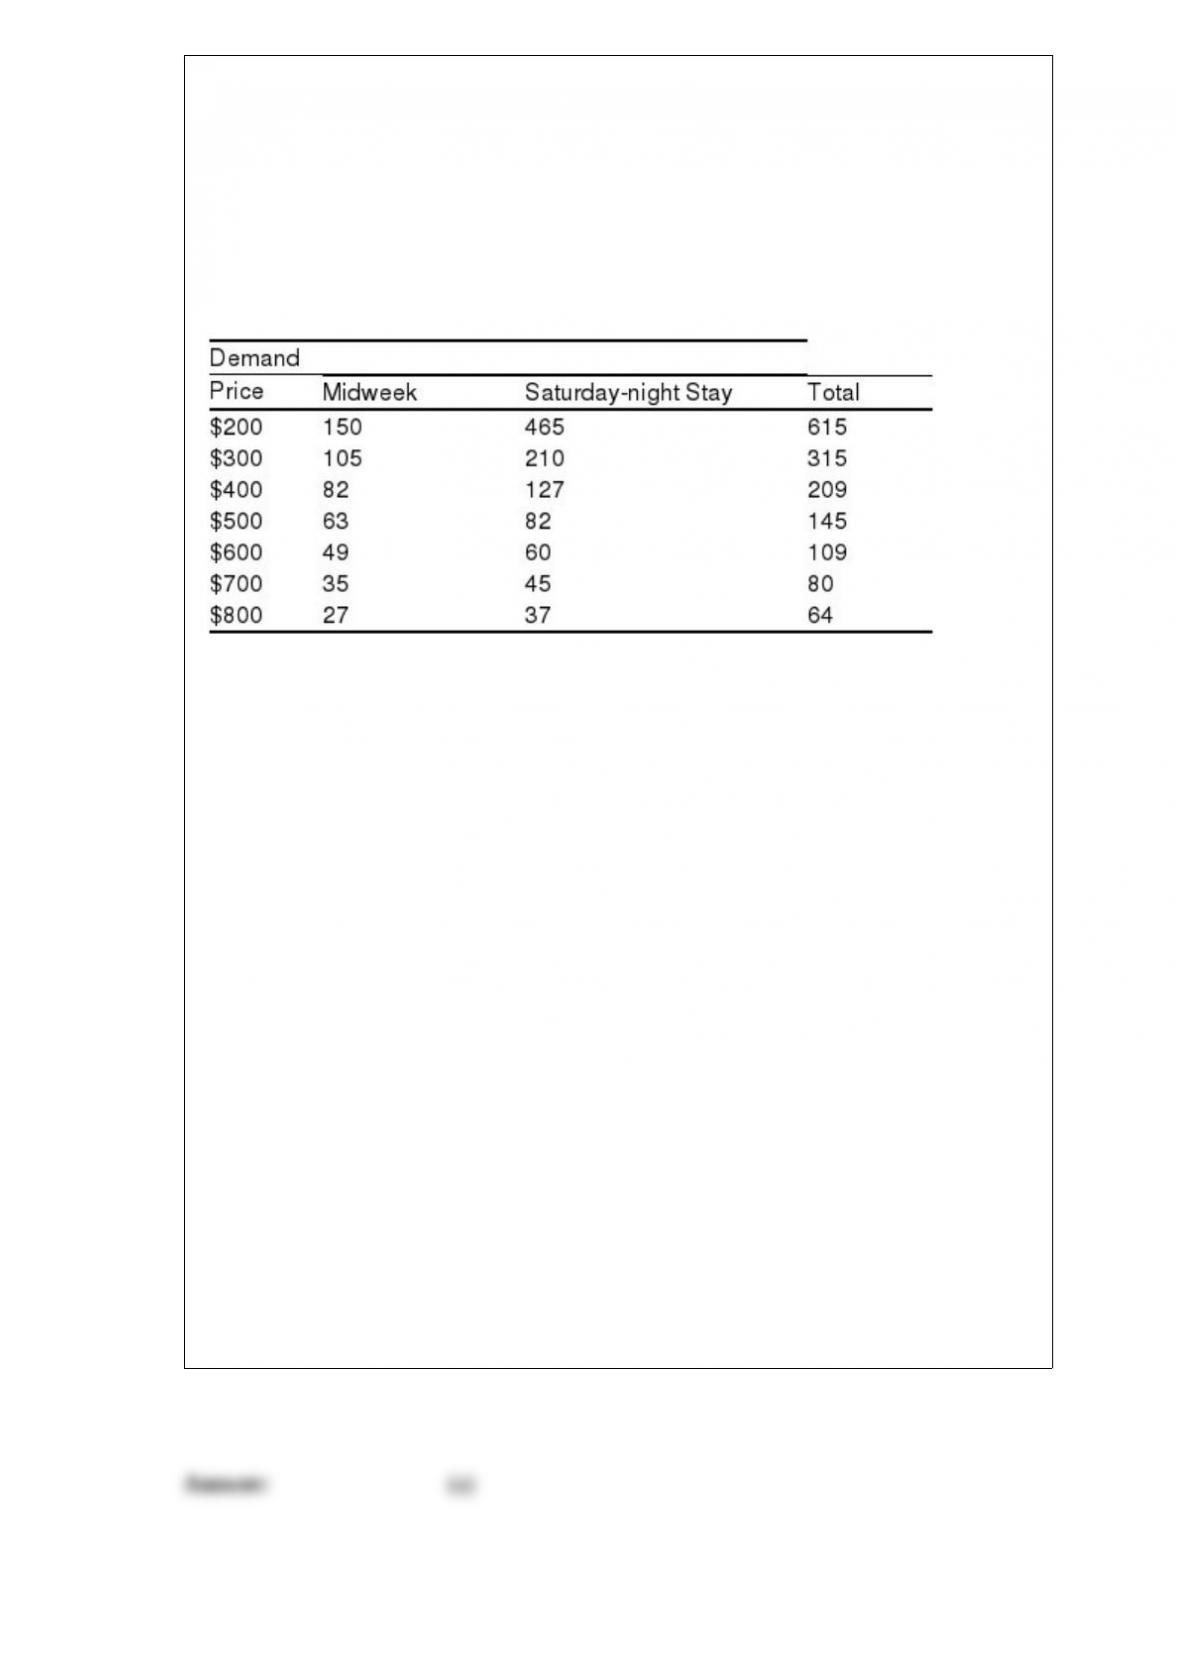
airlines have discovered that extra profit can be generated by using separate pricing for
these two types of customers. For example, airlines often charge more for a midweek
flight (mostly business travelers) than for travel that includes a Saturday-night stay
(mostly leisure travelers). Suppose an airline has estimated demand vs. price for
midweek travel (mostly business travelers) and for travel that includes a Saturday-night
stay (mostly leisure travelers) as shown in the table below. This flight is served by a
Boeing 777 with capacity for 300 travelers. The fixed cost of operating the flight is
$30,000. The variable cost per passenger (for food and fuel) is $30.
One function that can used to estimate demand (D) as a function of price (P) is a linear
demand function, where D = a – bP. For positive values of a and b, this will give lower
demand when the price is higher. However, a nonlinear demand function usually can
provide a better fit to the data. For example, one such function is a constant elasticity
demand function, where D = aP. For positive values of a and negative values of b, this
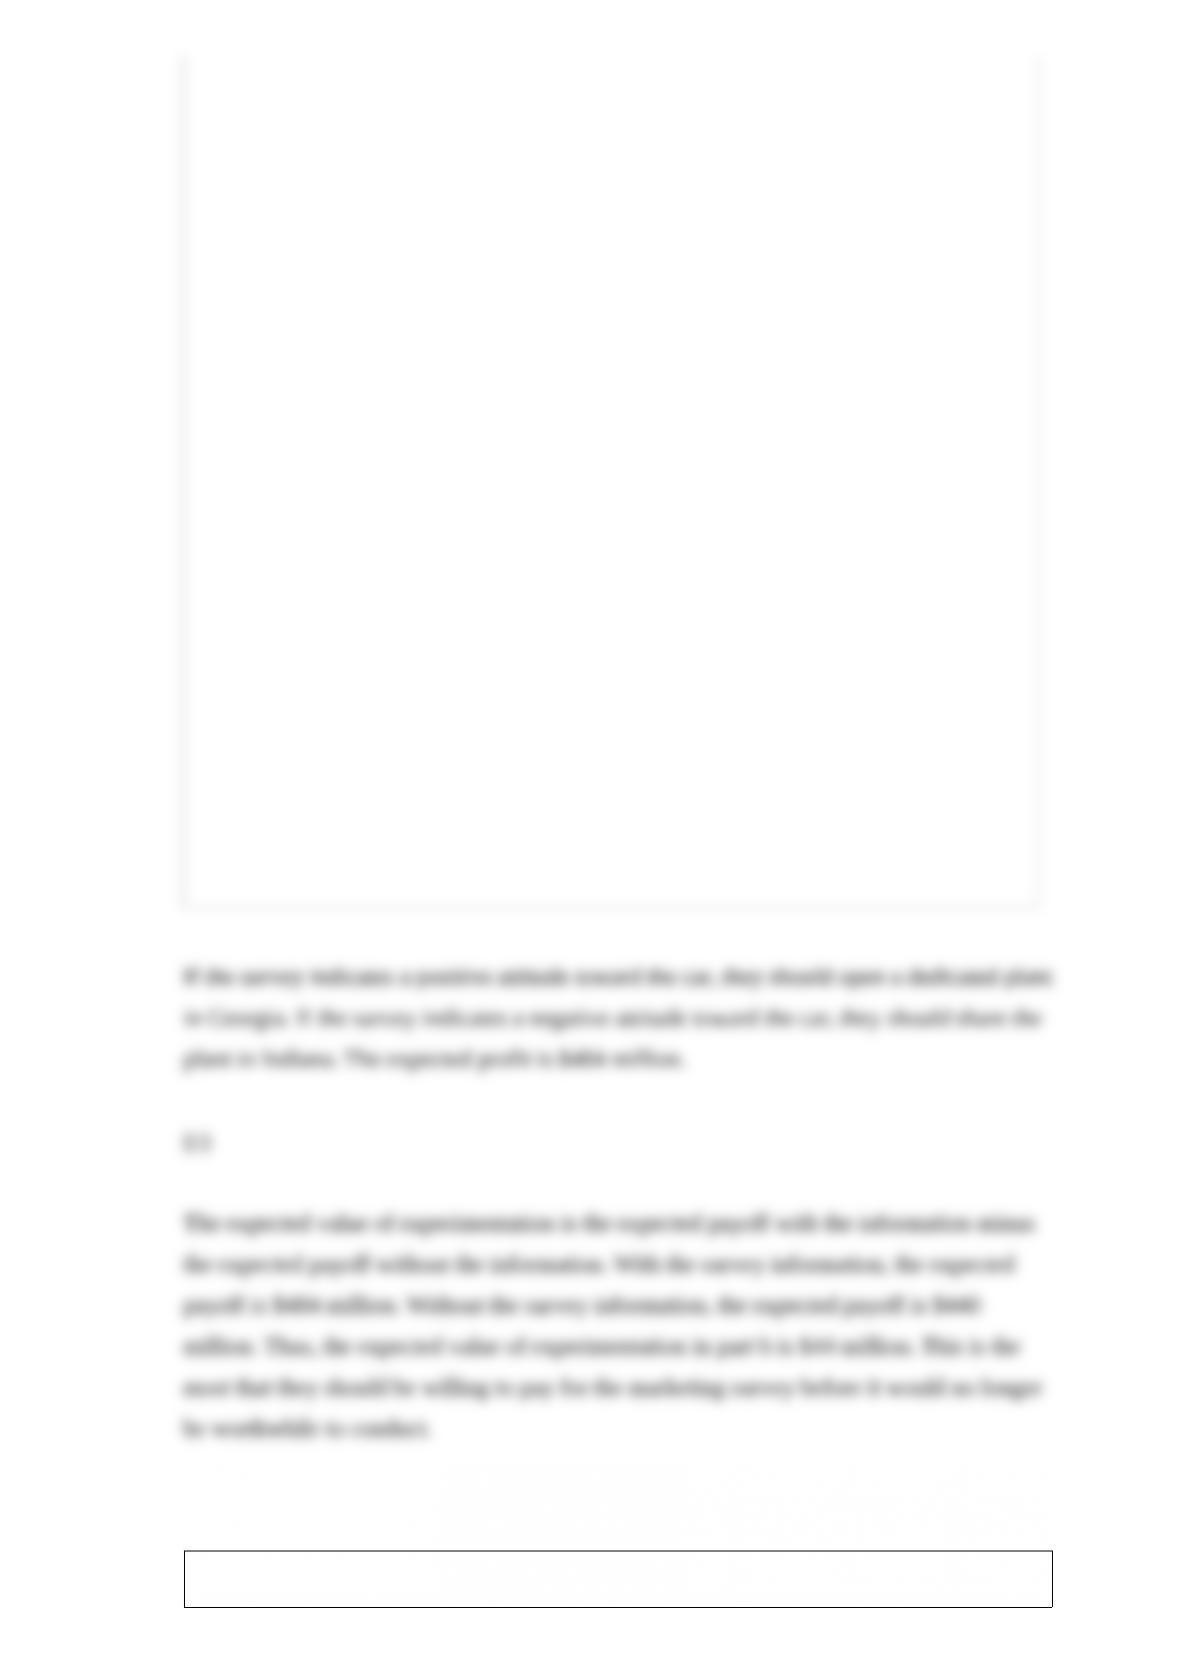
also will give lower demand when the price is higher. Graph the above data and use the
Add Trendline feature of Excel to find the constant elasticity demand function that best
fits the data in the above table for midweek demand, Saturday-night stay demand, and
total demand
For this part, assume that the airline charges a single price to all customers. Using the
demand function for total demand determined in part a, formulate and solve a nonlinear
programming model in a spreadsheet to determine what the price should be so as to
achieve the highest profit for the airline.
Now assume that the airline charges separate prices for midweek and Saturday-night
stay tickets. Using the two demand functions for midweek and Saturday-night stay
tickets determined in part a, formulate and solve a nonlinear programming spreadsheet
model to determine what the prices of the two types of tickets should be so as to
maximize the profit for the airline.
How much extra profit can the airline achieve by charging higher prices for midweek
tickets than for Saturday-night stay tickets?


Consider the following nonlinear programming problem.
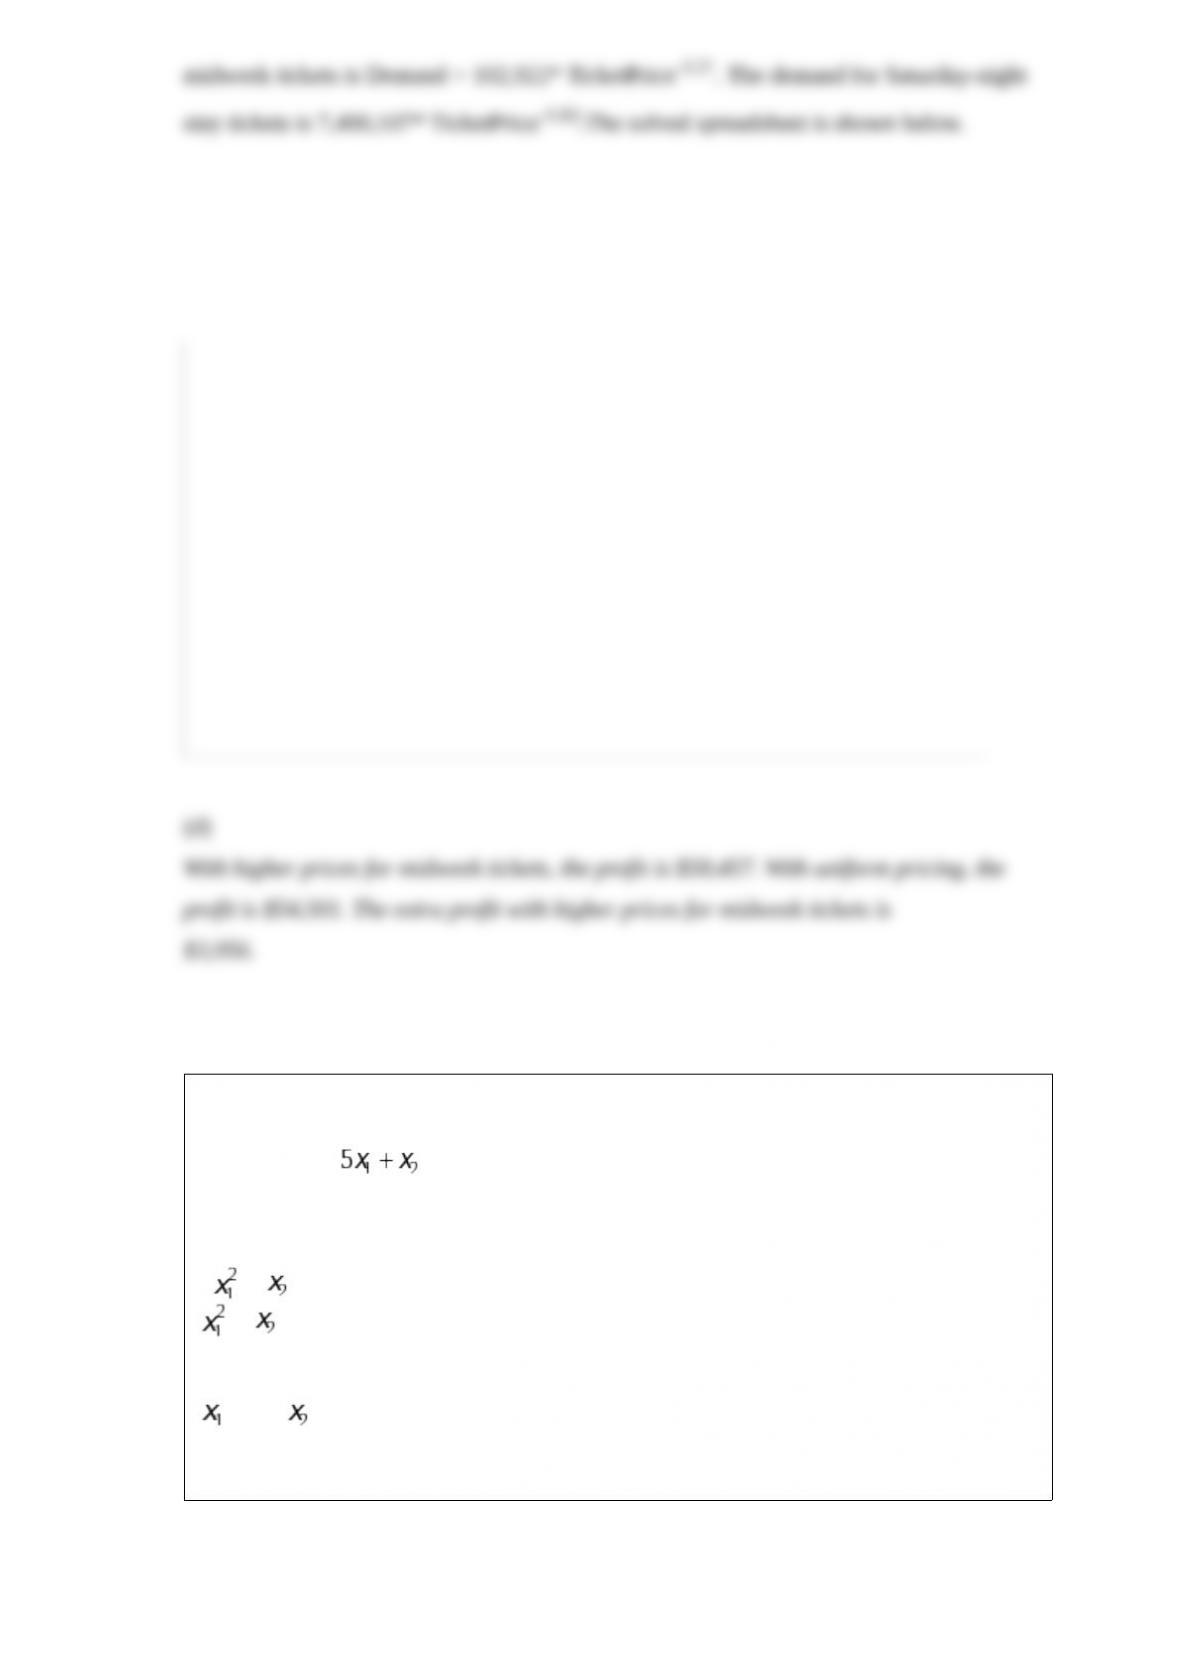
Maximize Z = ,
subject to
2 + =< 13
+ =< 9
and
>= 0, >= 0.
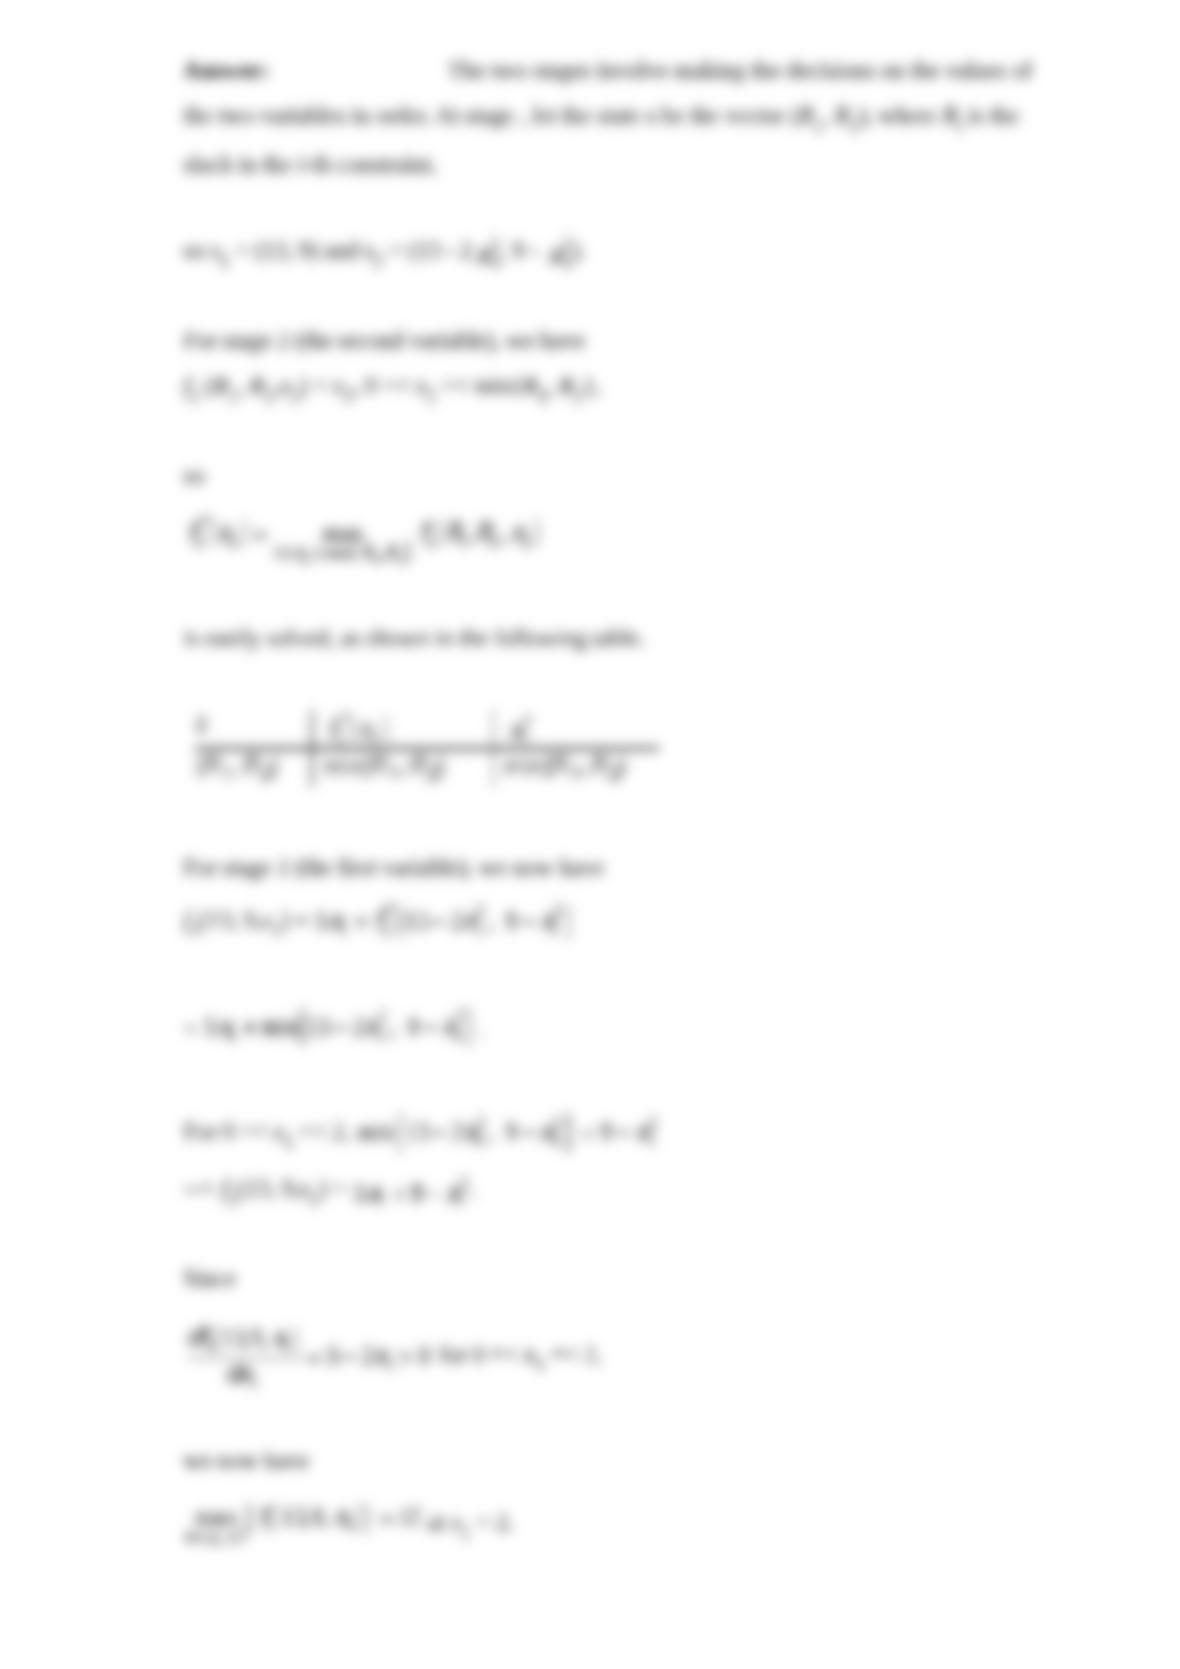
Use dynamic programming to solve this problem.
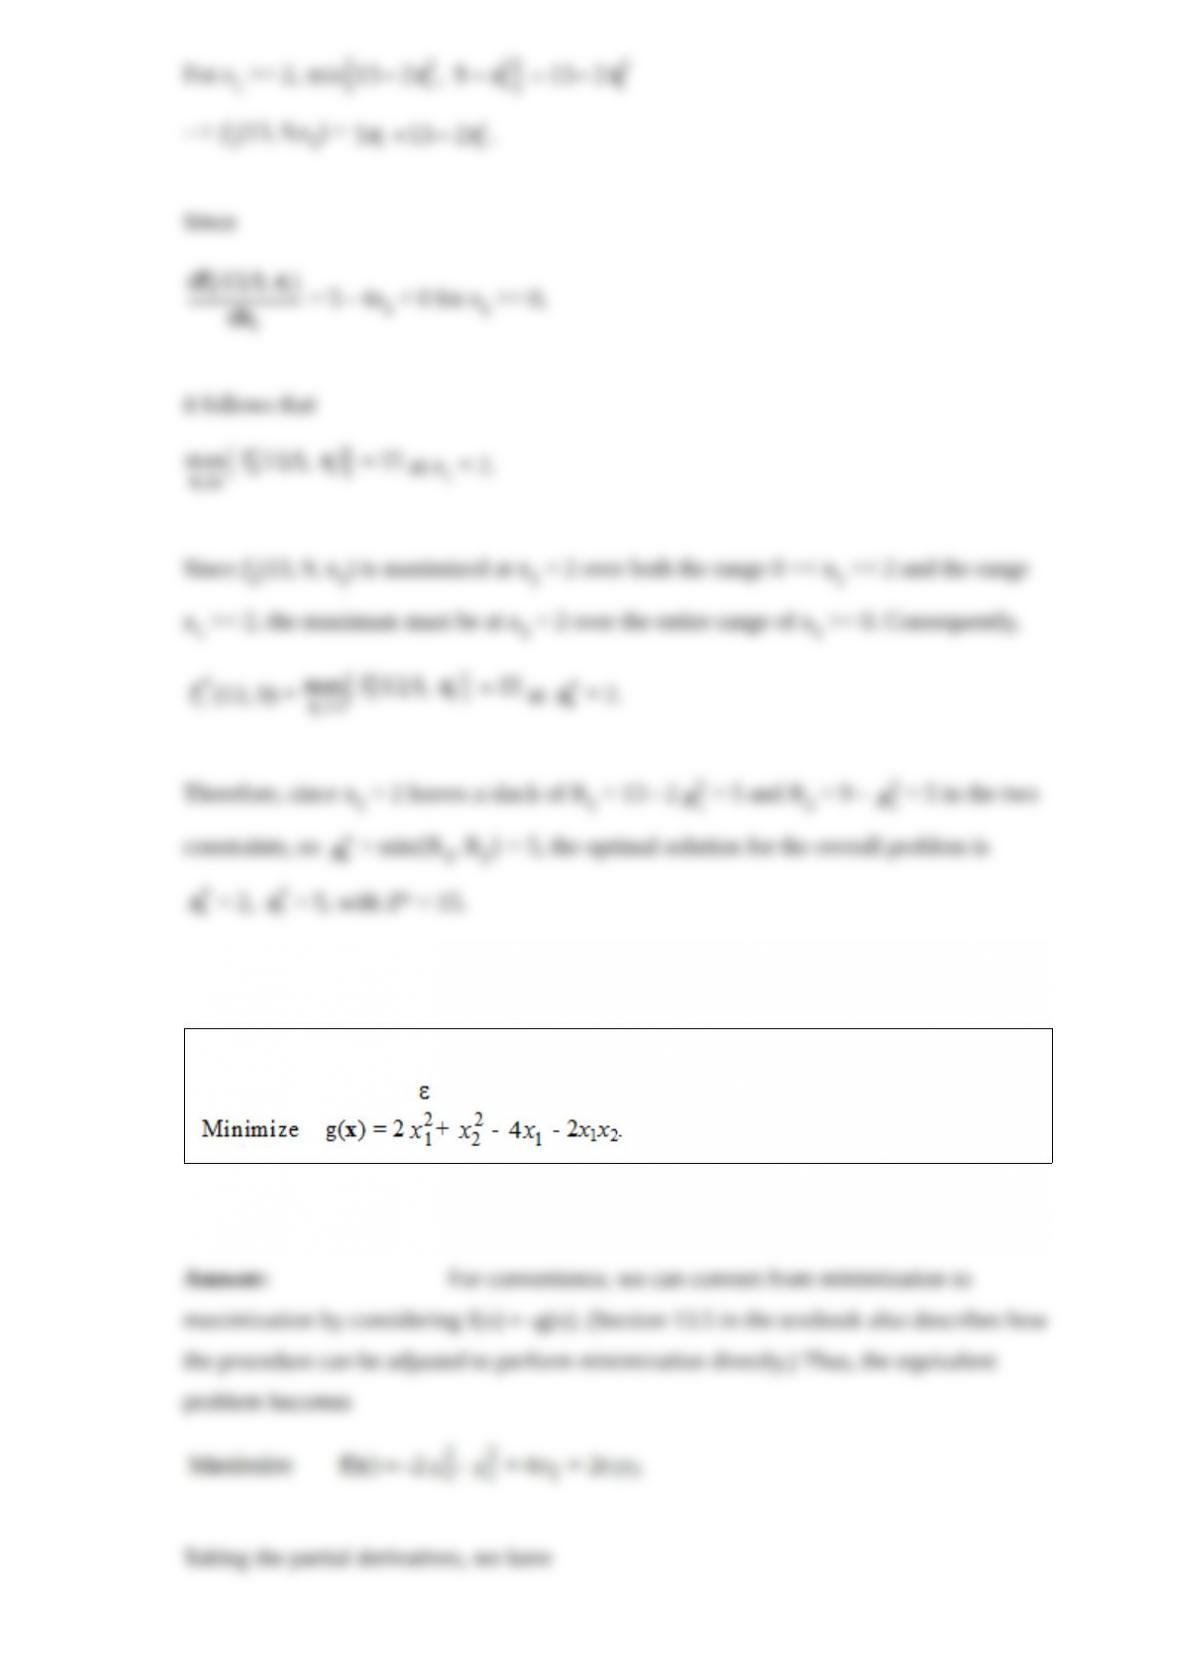
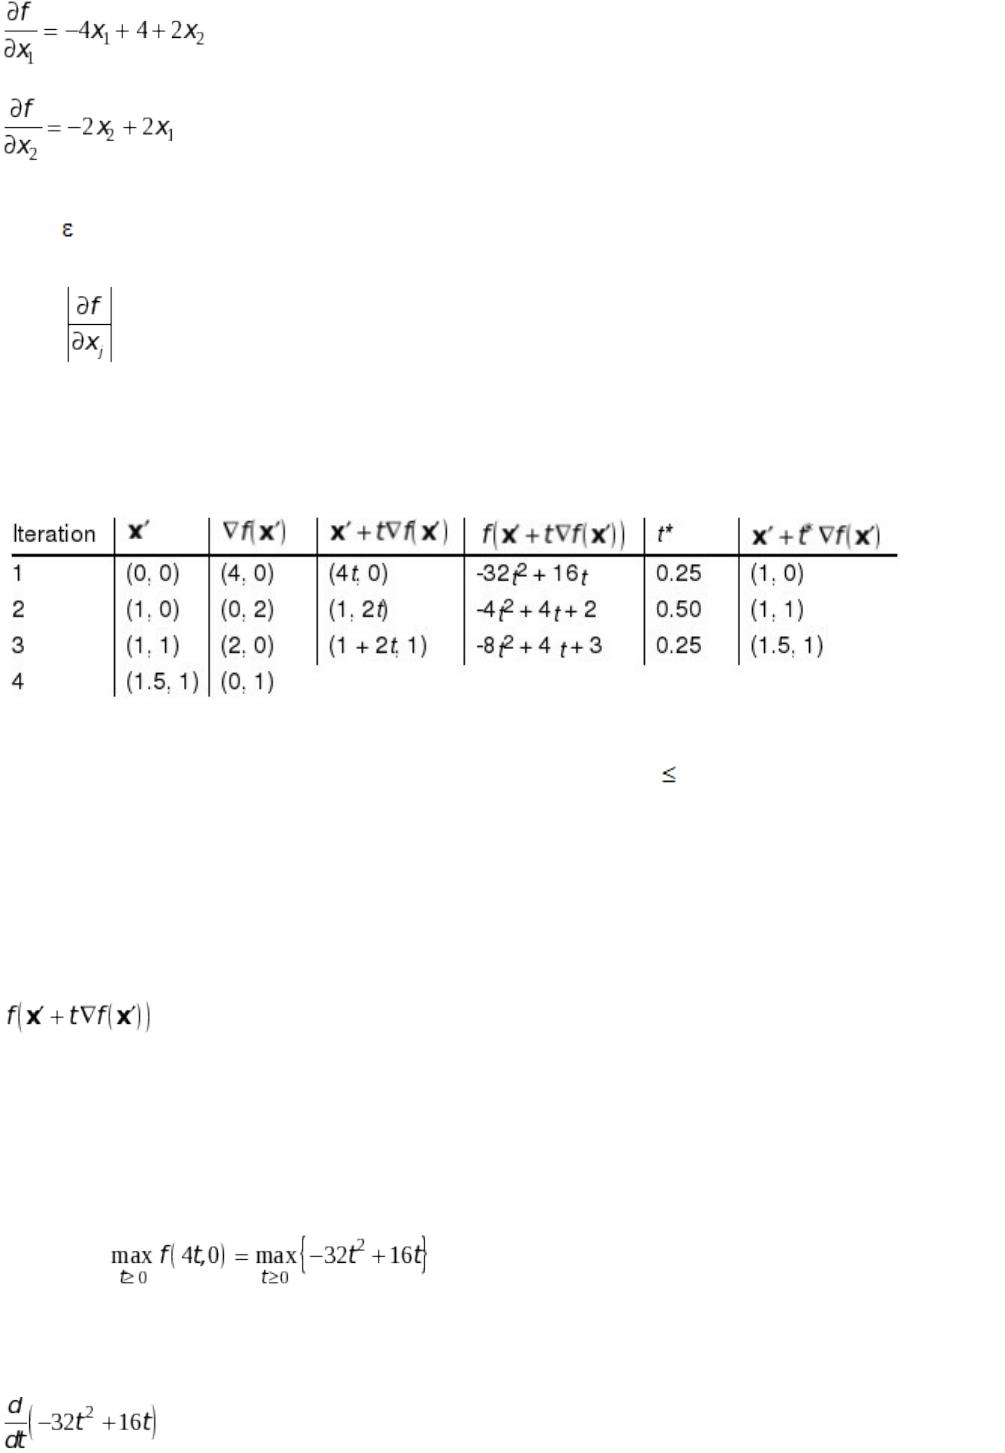
Starting from the initial trial solution (x1, x2) = (0, 0), interactively apply the gradient
search procedure with = 1 to solve (approximately) the following problem.
The Weigelt Corporation has three branch plants with excess production capacity.
Fortunately, the corporation has a new product ready to begin production, and all three
plants have this capability, so some of the excess capacity can be used in this way. This
product can be made in three sizes–large, medium, and small–that yield a net unit
profit of $420, $360, and $300, respectively. Plants 1, 2, and 3 have the excess capacity
to produce 750, 900, and 450 units per day of this product, respectively, regardless of
the size or combination of sizes involved.
The amount of available in-process storage space also imposes a limitation on the
production rates of the new product. Plants 1, 2, and 3 have 13,000, 12,000, and 5,000
square feet, respectively, of in-process storage space available for a day’s production of
this product. Each unit of the large, medium, and small sizes produced per day requires
20, 15, and 12 square feet, respectively.
Sales forecasts indicate that if available, 900, 1,200, and 750 units of the large, medium,
and small sizes, respectively, would be sold per day.
At each plant, some employees will need to be laid off unless most of the plant’s excess
production capacity can be used to produce the new product. To avoid layoffs if
possible, management has decided that the plants should use the same percentage of
their excess capacity to produce the new product.
Management wishes to know how much of each of the sizes should be produced by
each of the plants to maximize profit.
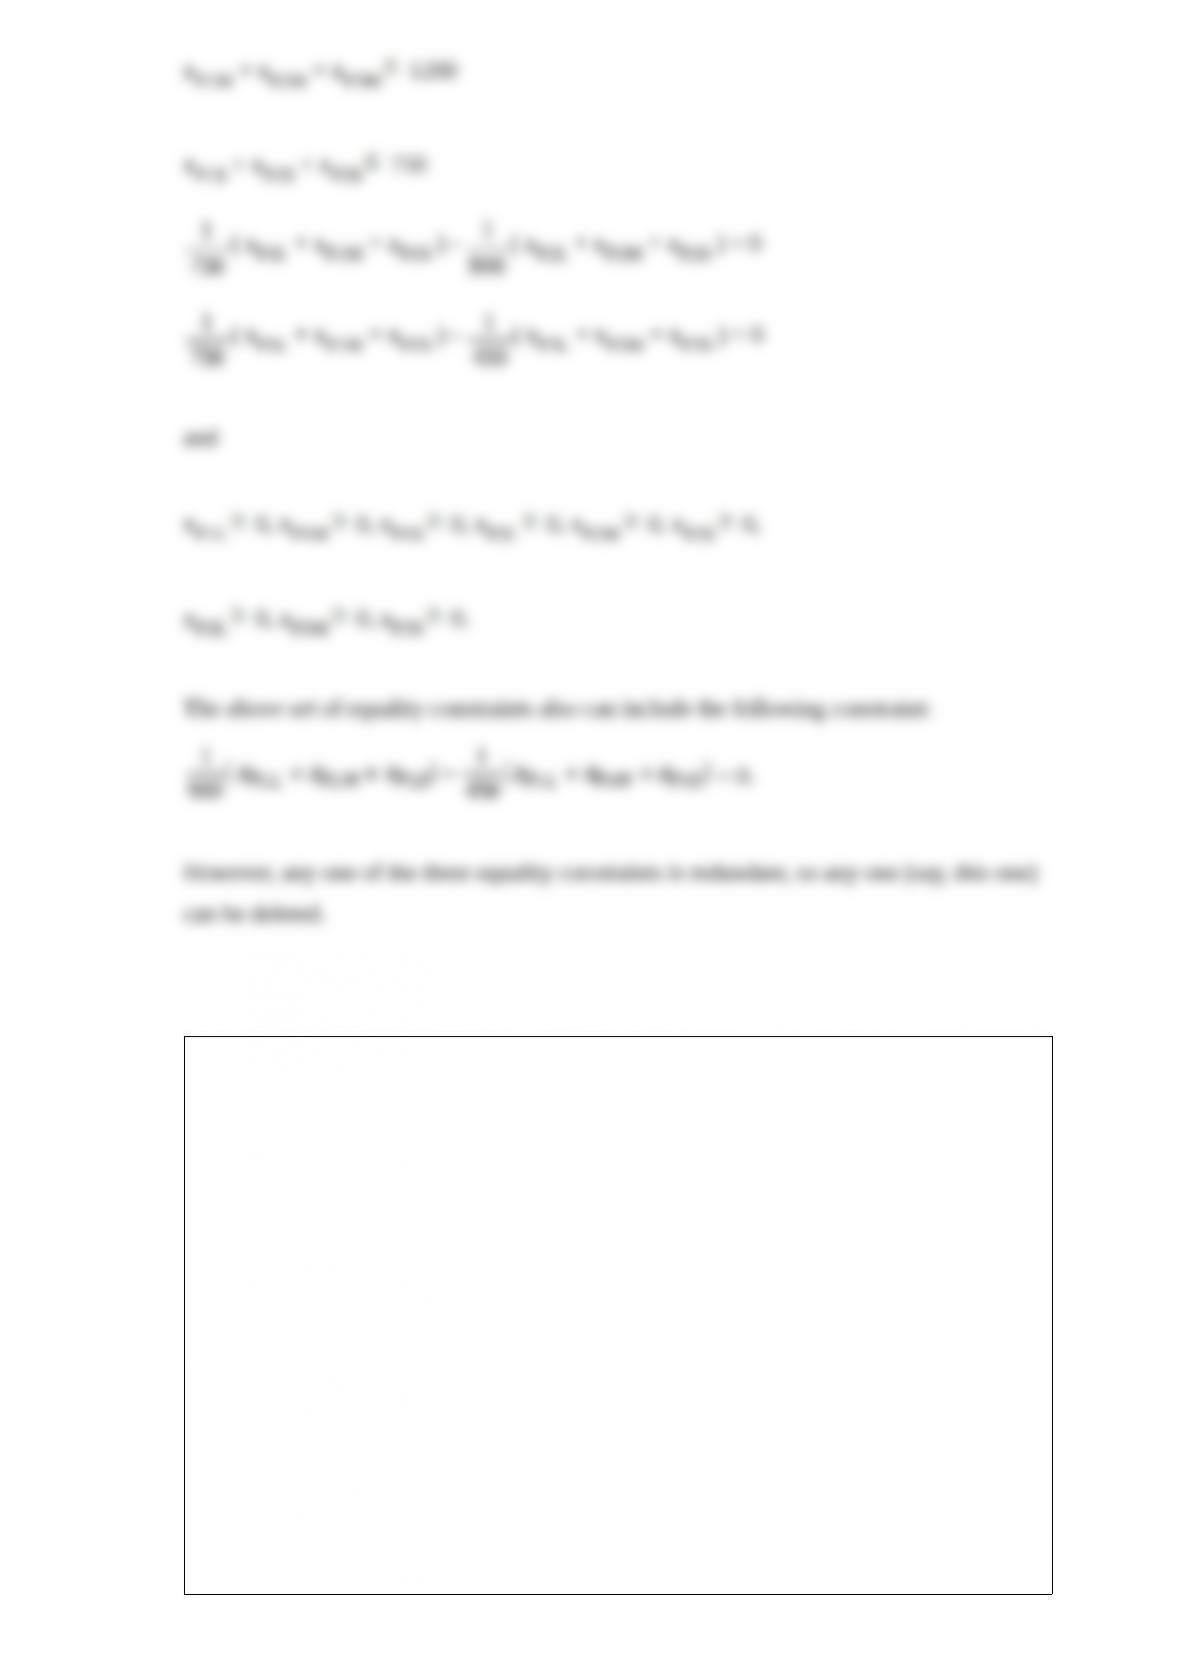
Formulate a linear programming model for this problem.

The employees of General Manufacturing Corp. receive health insurance through a
group plan issued by Wellnet. During the past year, 40 percent of the employees did not
file any health insurance claims, 40 percent filed only a small claim, and 20 percent
filed a large claim. The small claims were spread uniformly between 0 and $2,000,
whereas the large claims were spread uniformly between $2,000 and $20,000.
Based on this experience, Wellnet now is negotiating the corporation’s premium
payment per employee for the upcoming year. You are an operations research analyst
for the insurance carrier, and you have been assigned the task of estimating the average
cost of insurance coverage for the corporation’s employees.
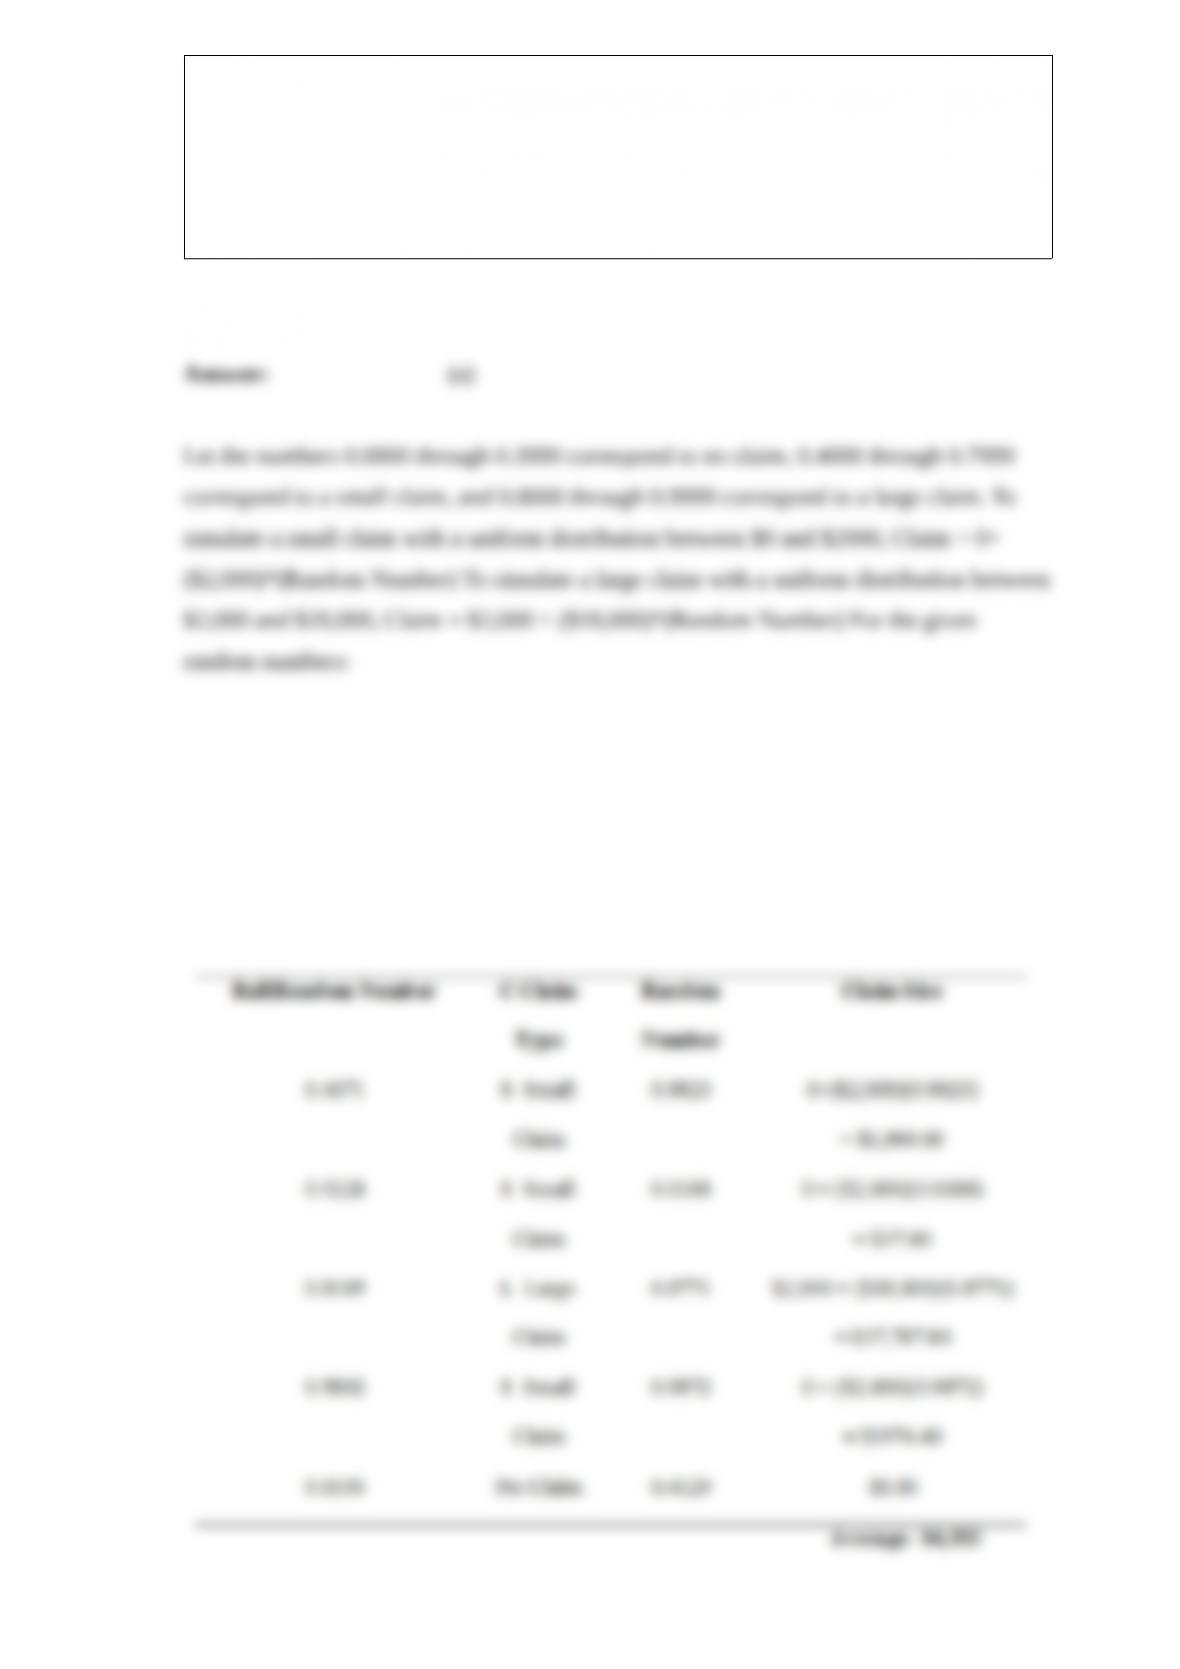
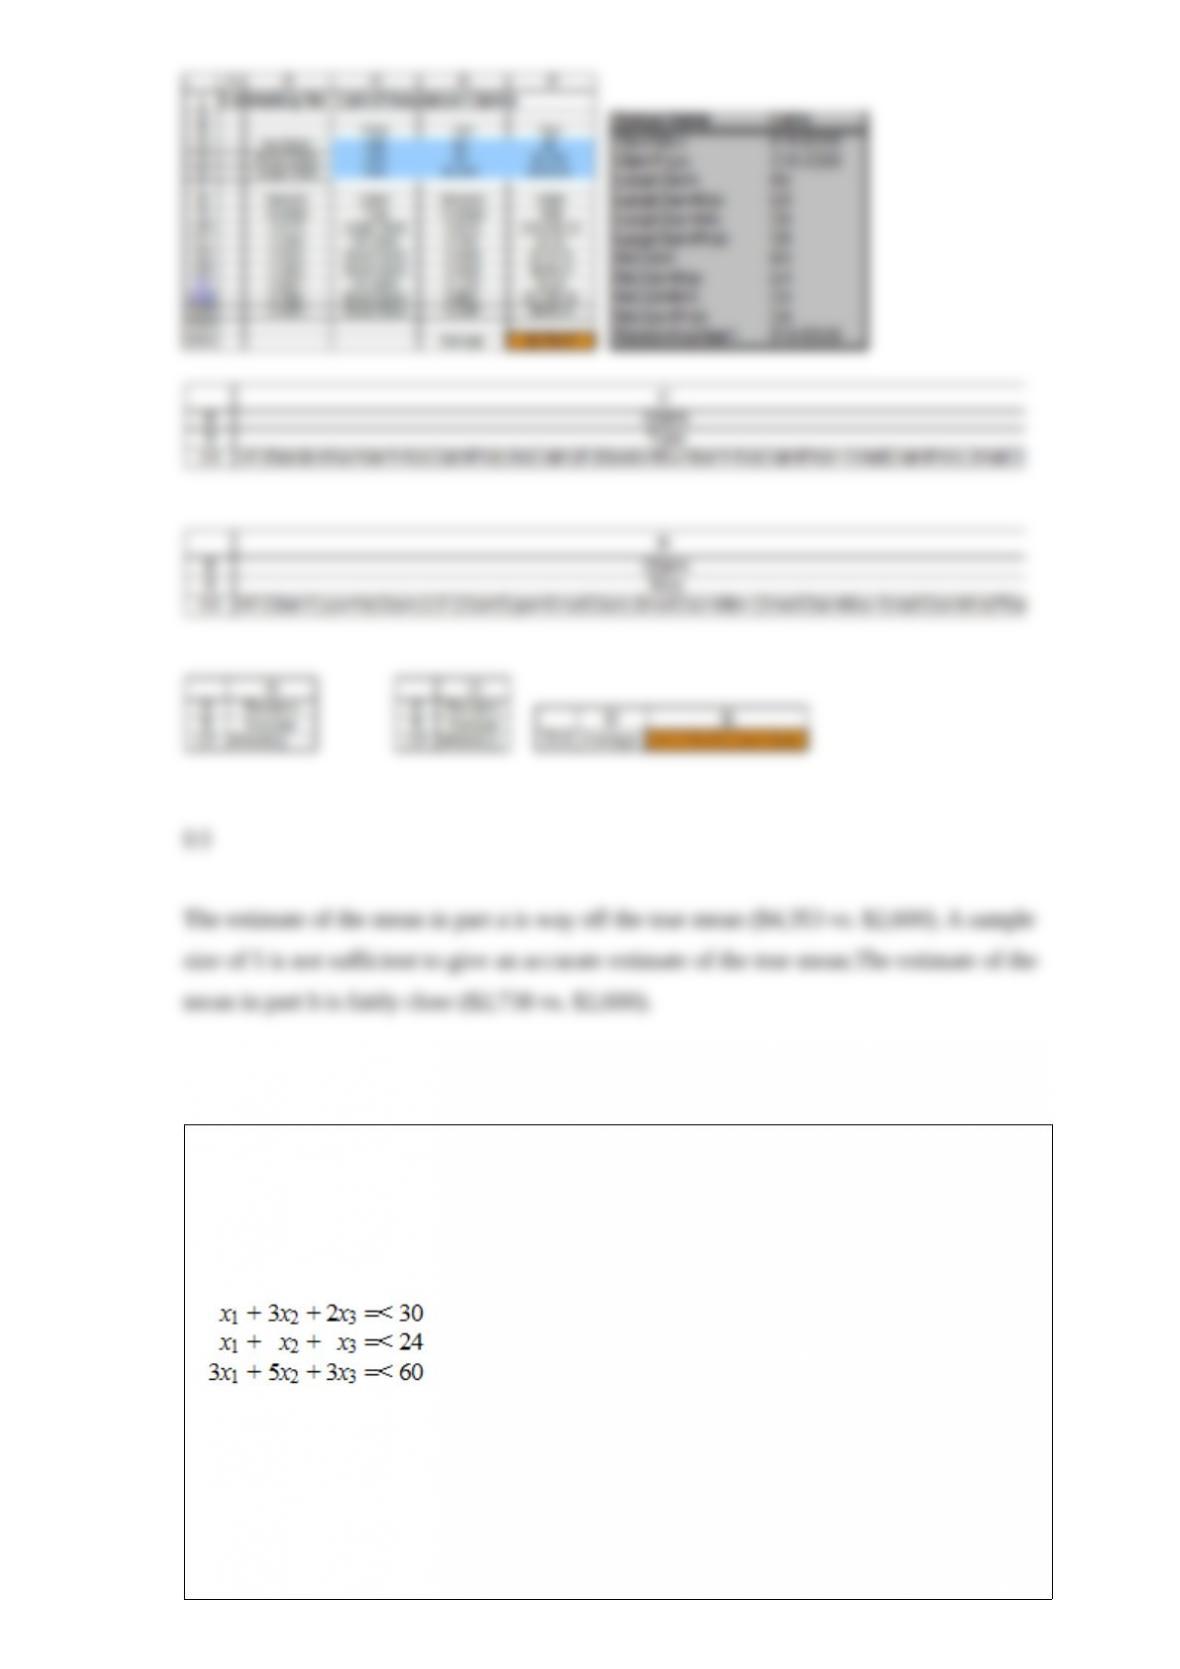
Use the random numbers 0.4071, 0.5228, 0.8185, 0.5802, and 0.0193 to simulate
whether each of five employees files no claim, a small claim, or a large claim. Then use
the random numbers 0.9823, 0.0188, 0.8771, 0.9872, and 0.4129 to simulate the size of
the claim (including zero if no claim was filed). Calculate the average of these claims to
estimate the mean of the overall distribution of the size of employee’s health insurance
claims.
Formulate and apply a spreadsheet model to simulate the cost for 300 employees’ health
insurance claims. Calculate the average of these random observations.
The true mean of the overall probability distribution of the size of an employee’s health
insurance claim is $2,600. Compare the estimates of this mean obtained in parts a and b
with the true mean of the distribution.
Consider the following problem.
Maximize Z = 2x1 + 4x2 + 3x3,
subject to
and
x1 >= 0, x2 >= 0, x3 >= 0.
You are given the information that x1 > 0, x2 = 0, and x3 >0 in the optimal solution.
Using the given information and the theory of the simplex method, analyze the
constraints of the problem in order to identify a system of three constraint boundary
equations (defining equations) whose simultaneous solution must be the optimal
solution (not augmented). Then solve this system of equations to obtain this solution.