1) The most common quantitative causal model is regression analysis.
2) A series of steps or procedures that are repeated is known as an algorithm.
3) The Monte Carlo simulation was developed as a quantitative technique by the great
mathematician John von Neumann during World War I.
4) The three basic components of a queuing process are arrivals, service facilities, and
the actual waiting line.
5) A profit equation is an example of a schematic model.
6) Gantt charts contain information about the time taken by each activity, but not about
the sequential dependencies of the activities.
7) From an Analytic Hierarchy Process analysis, » is computed to be 4.123, n = 4, RI =
0.9. Compute the consistency ratio.
A) 4.5811
B) 1.0308
C) 0.0456
D) 0.0410
E) None of the above
8) Which technique requires that we start in the upper-left-hand cell of the table and
allocate units to shipping routes in a ‘stair step” fashion?
A) upper-left rule
B) stair step method
C) northwest corner rule
D) Vogel’s approximation method
E) MODI
9) Customers enter the waiting line to pay for food as they leave a cafeteria on a
first-come, first-served basis. The arrival rate follows a Poisson distribution, while
service times follow an exponential distribution. If the average number of arrivals is
four per minute and the average service rate of a single server is seven per minute, on
average, how much time will elapse from the time a customer enters the line until
he/she leaves the cafeteria?
A) 0.67 minute
B) 0.50 minute
C) 0.75 minute
D) 0.33 minute
E) 1.33 minutes
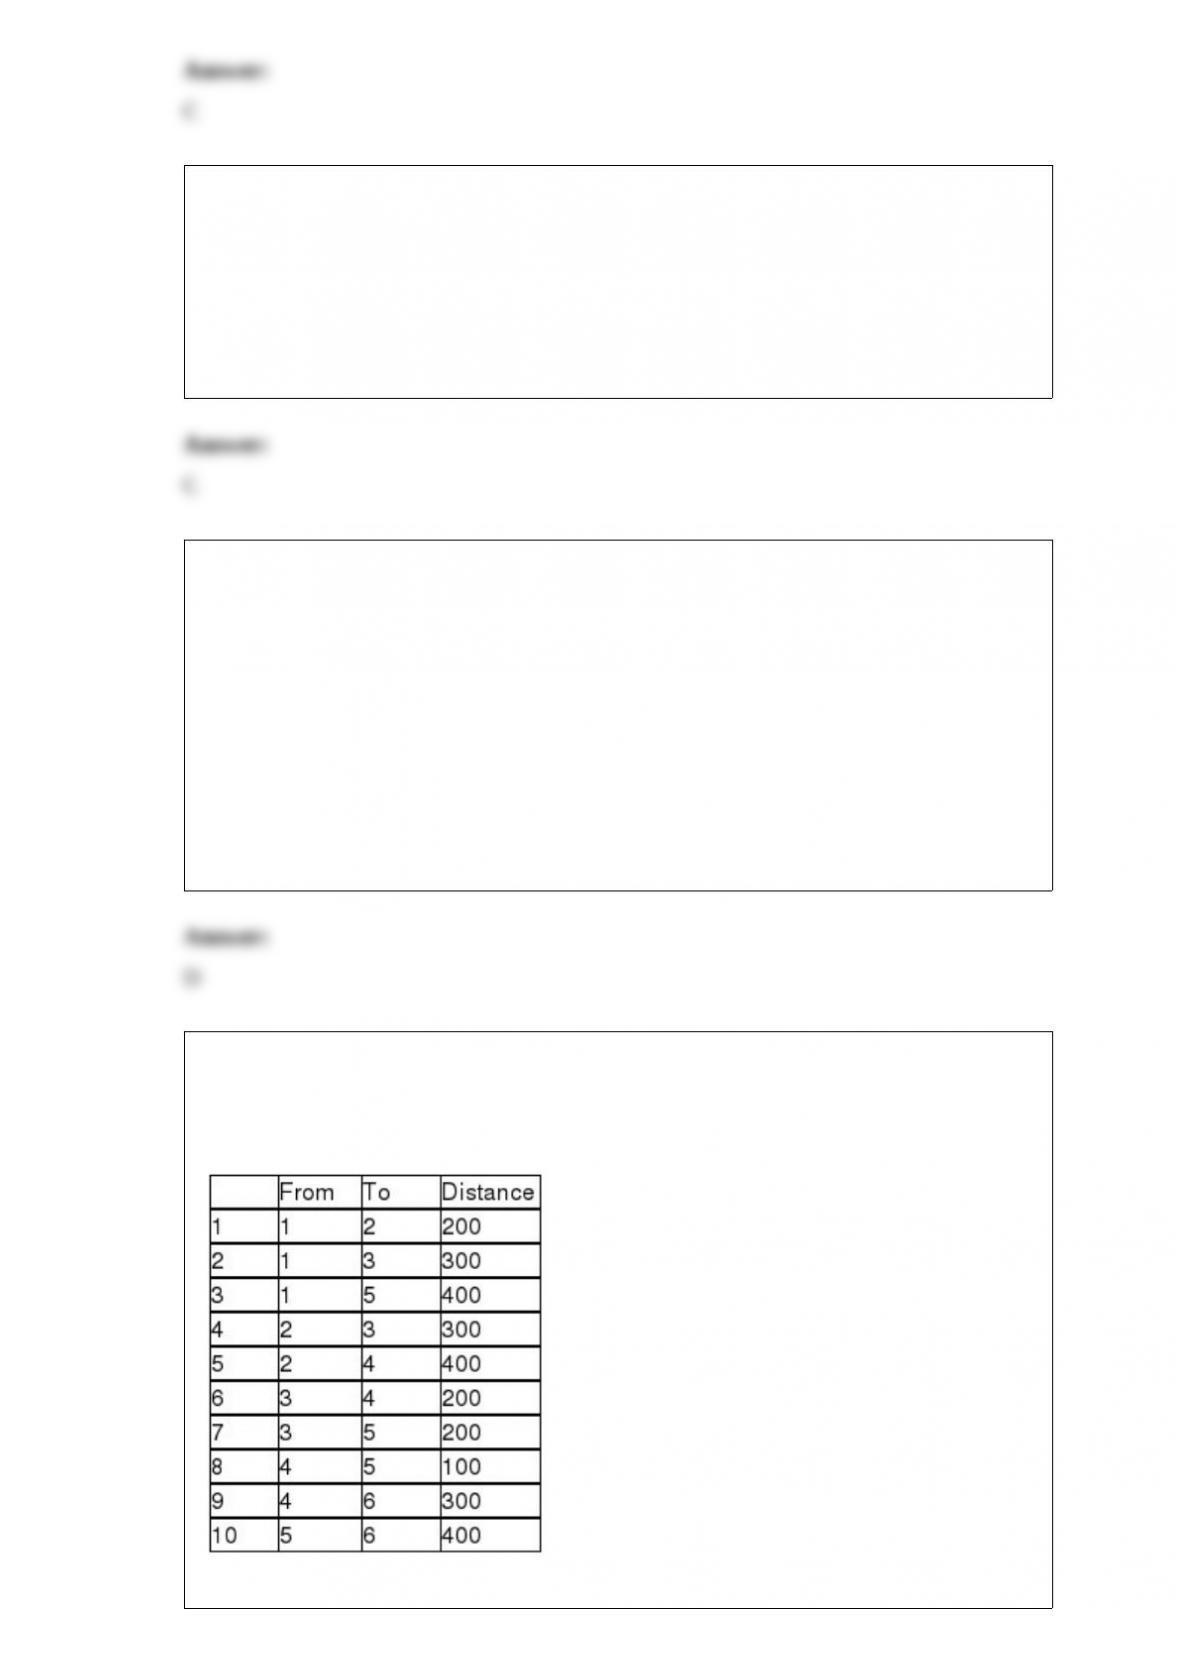
10) Given the following nodes and distances, determine the minimal length of cable
necessary to connect all nodes, using Node 2 as the starting point.
A) 1200
B) 1100
C) 900
D) 700
E) None of the above
11) Which of the following is not a popular definition of quality?
A) Quality is the totality of features and characteristics of a product or service that bears
on its ability to satisfy stated or implied needs.
B) Quality is defined as a competitively priced product that surpasses customer needs.
C) Quality is the degree to which a product conforms to design or specification.
D) Quality is fitness for use.
E) Even though quality cannot be defined, you know what it is.
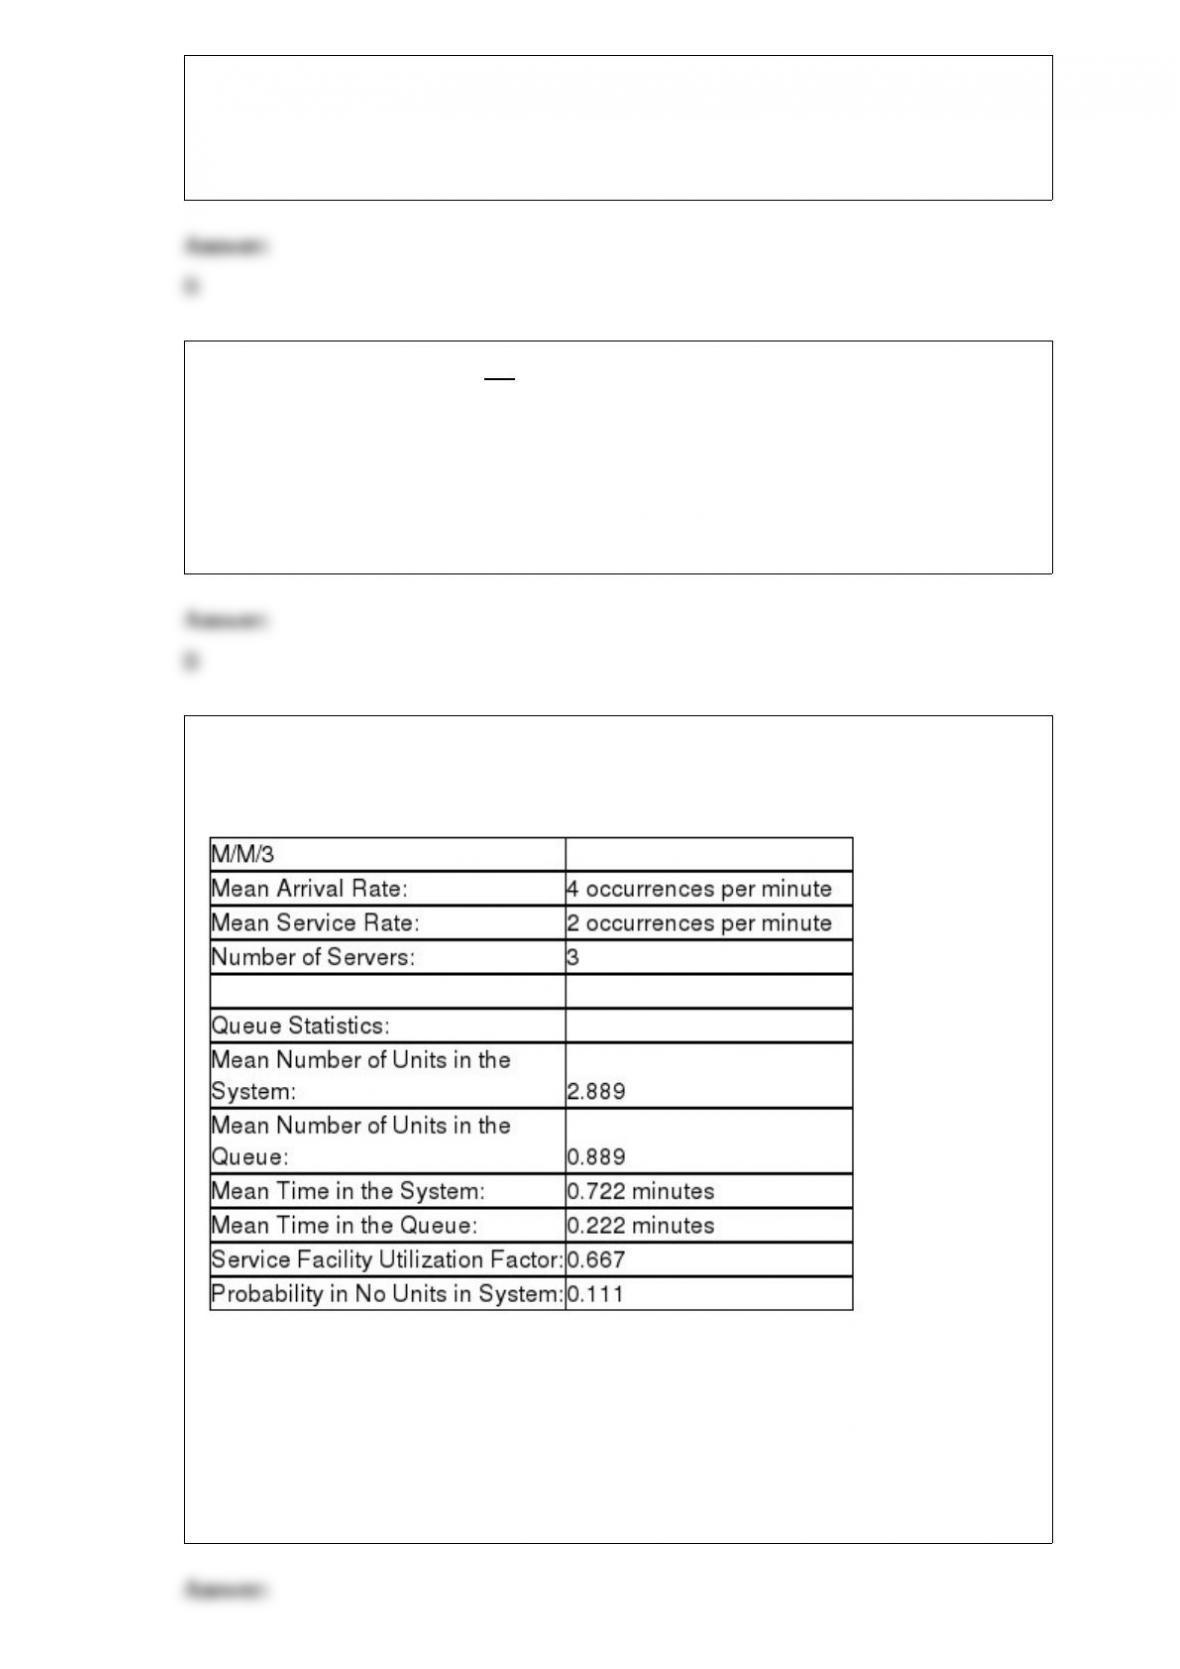
12) Table 12-3
According to the information provided in Table 12-3, which presents a queuing problem
solution, what is the utilization rate of the service facility?
A) 0.111
B) 0.889
C) 0.222
D) 0.722
E) 0.667
13) Which of the following is not an assumption in common queuing mathematical
models?
A) Arrivals come from an infinite, or very large, population.
B) Arrivals are Poisson distributed.
C) Arrivals are treated on a first-in, first-out basis and do not balk or renege.
D) Service rates follow the normal distribution.
E) The average service rate is faster than the average arrival rate.
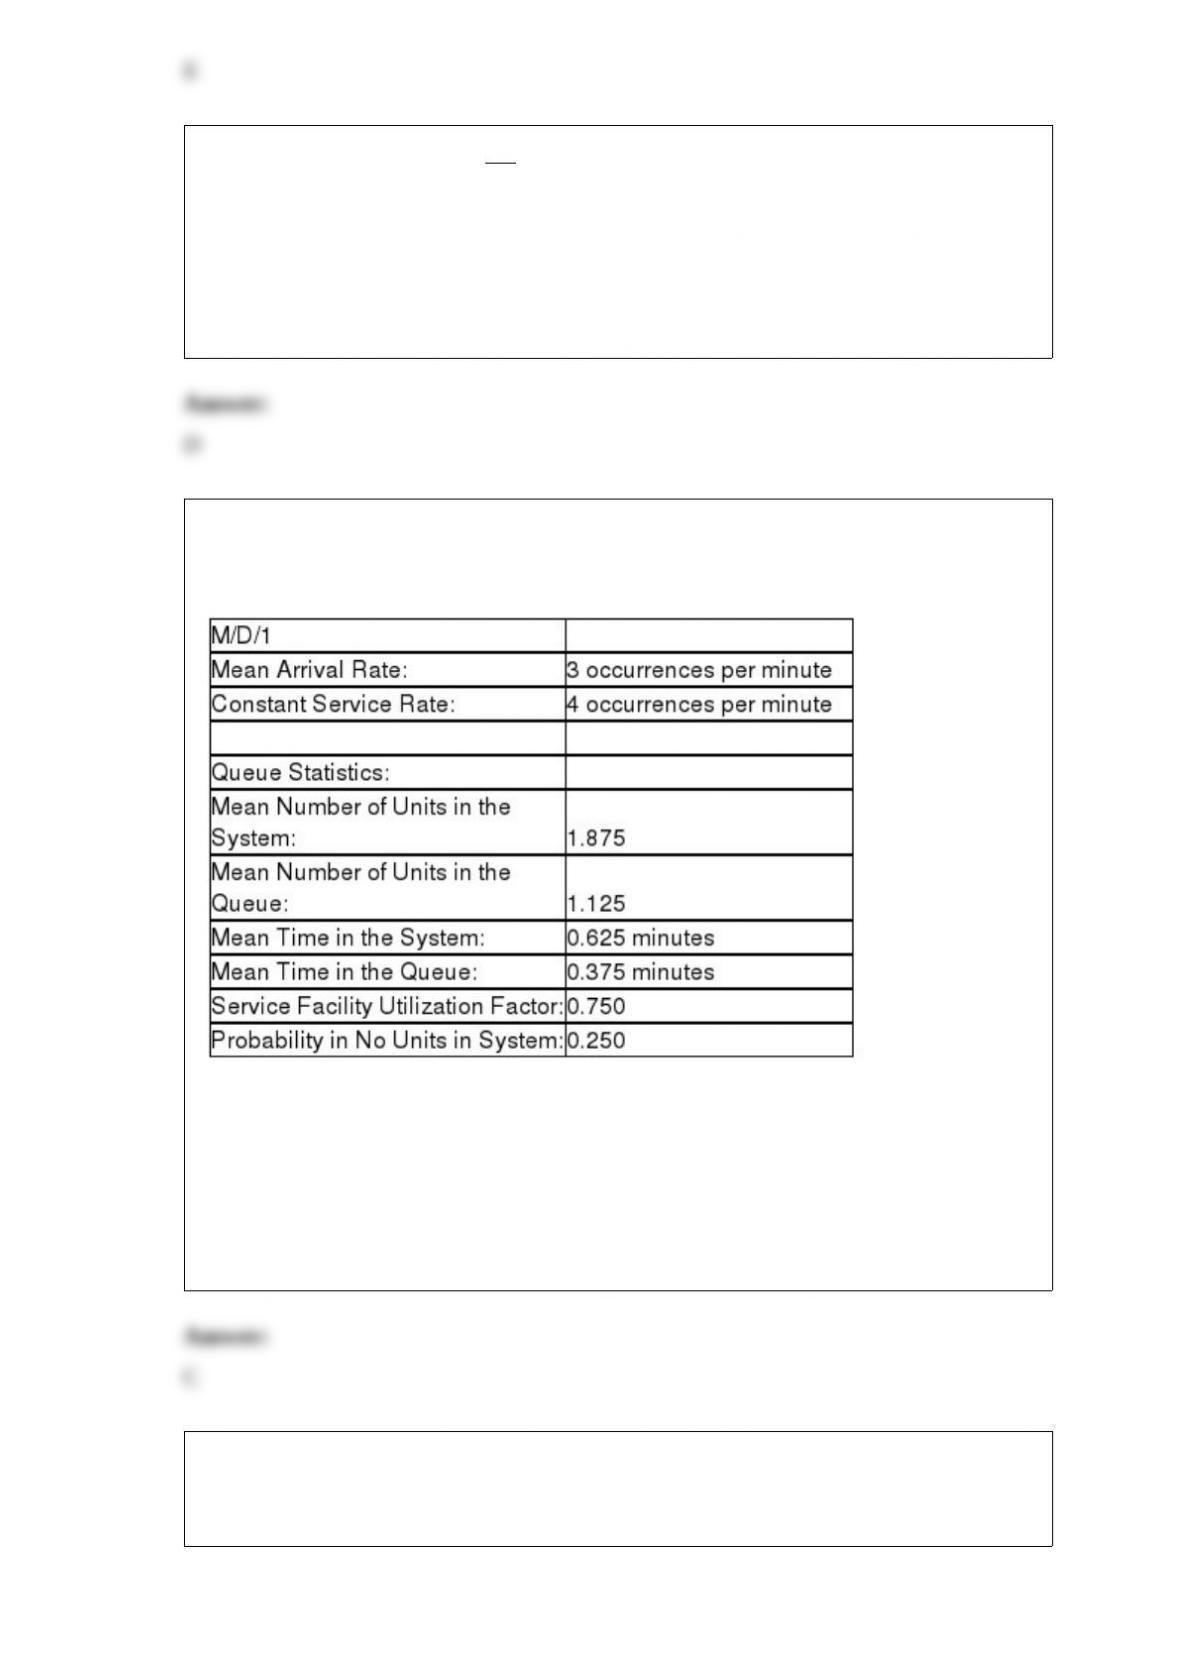
14) Table 12-4
According to Table 12-4, which presents a queuing problem with a constant service
rate, on average, how many minutes does a customer spend in the service facility?
A) 0.375 minute
B) 4 minutes
C) 0.625 minute
D) 0.25 minute
E) None of the above
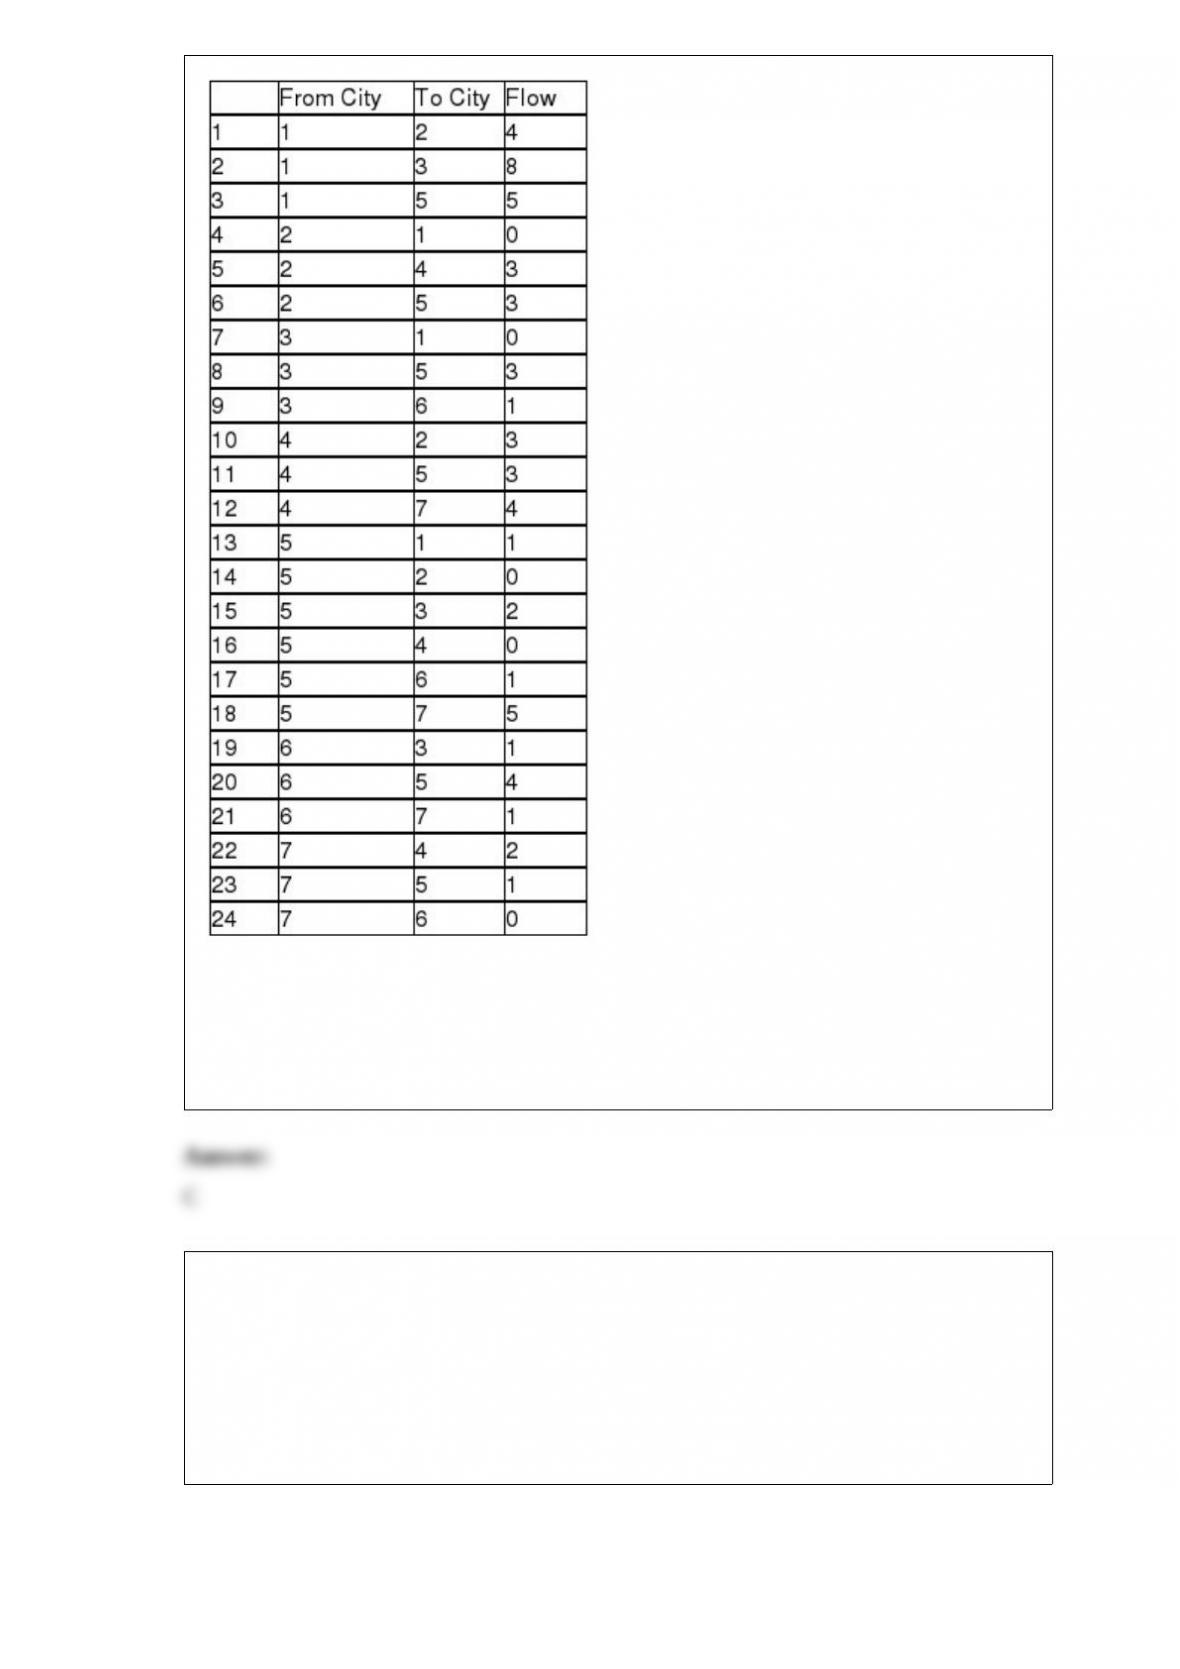
15) Given the following traffic flows, in hundreds of cars per hour, what is the
maximum traffic flow from City 1 to City 7?
A) 1200
B) 1400
C) 900
D) 800
E) None of the above
16) Table 13-2
A new young mother has opened a cloth diaper service. She is interested in simulating
the number of diapers required for a one-year-old. She hopes to use this data to show
the cost effectiveness of cloth diapers. The table below shows the number of diapers
demanded daily and the probabilities associated with each level of demand.
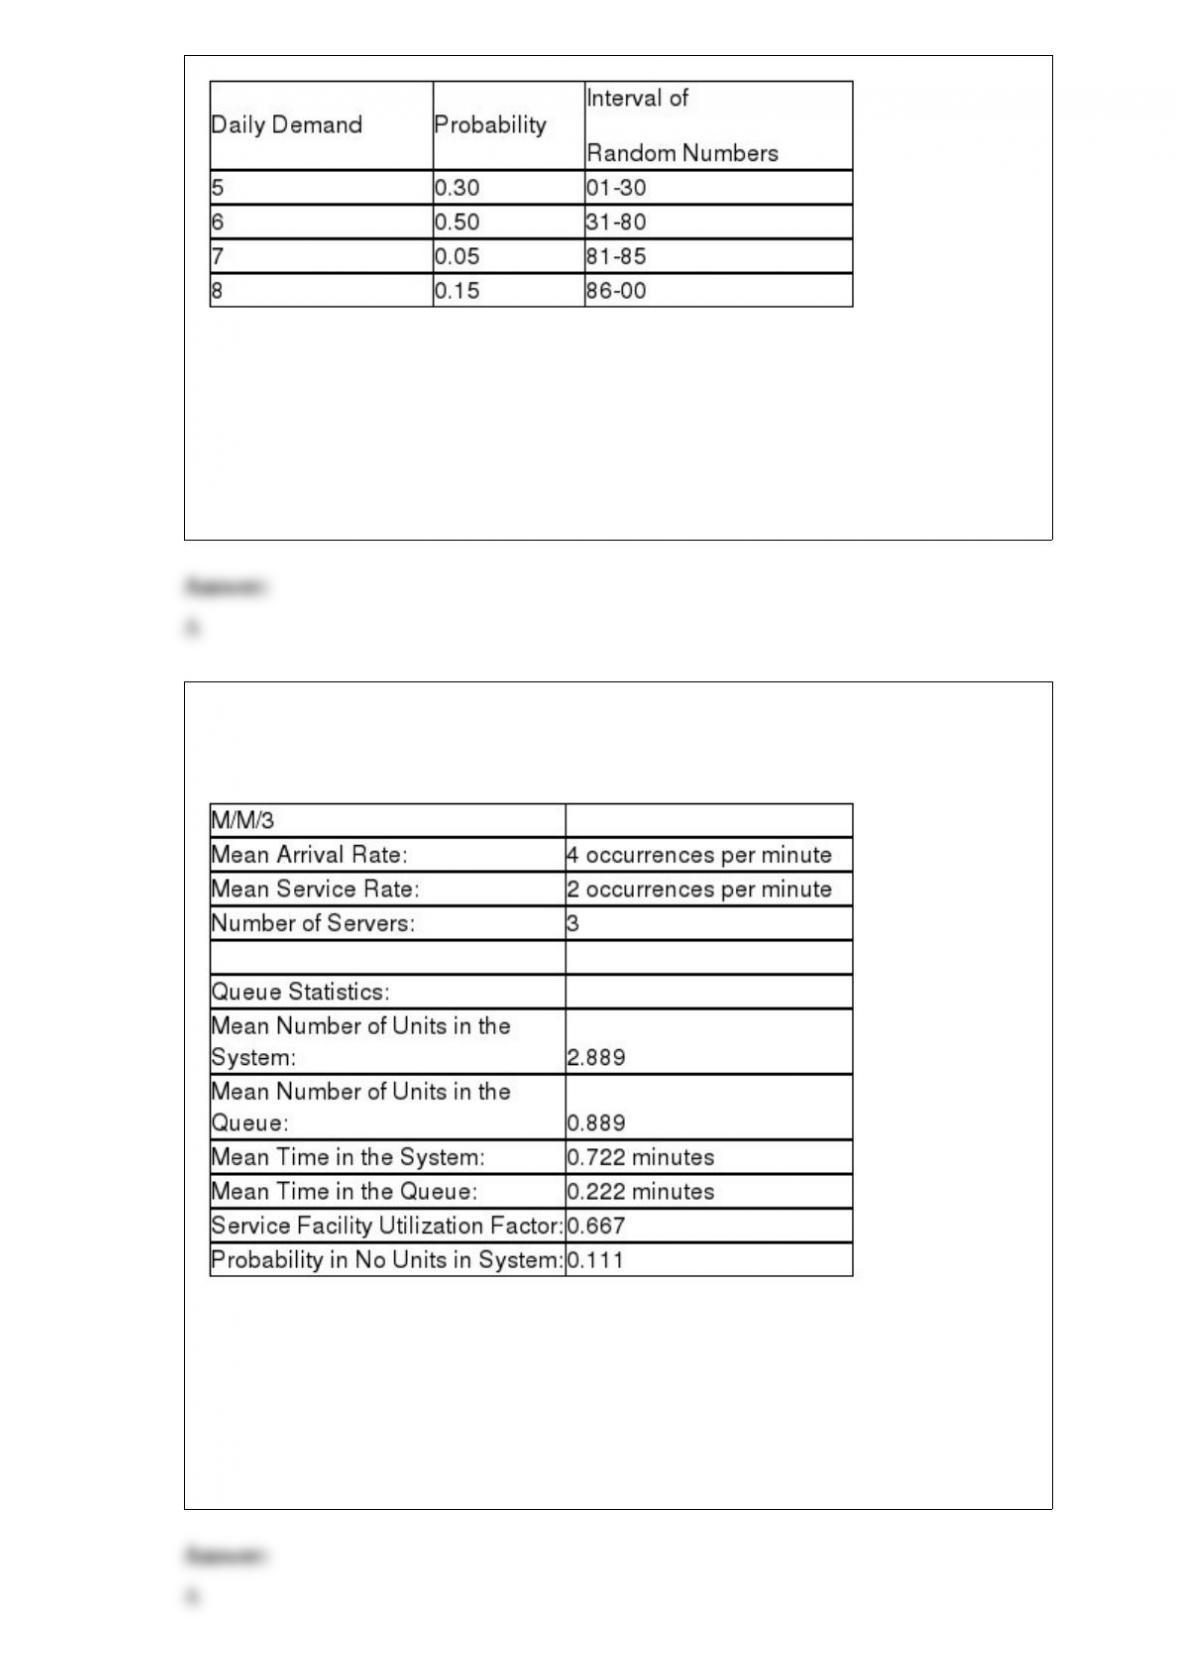
According to Table 13-2, what is the cumulative probability that demand is less than or
equal to 7?
A) 0.85
B) 0.95
C) 0.80
D) 0.15
E) None of the above
17) Table 12-3
According to the information provided in Table 12-3, which presents a queuing problem
solution, what proportion of time is the system totally empty?
A) 0.111
B) 0.333
C) 0.889
D) 0.667
E) None of the above
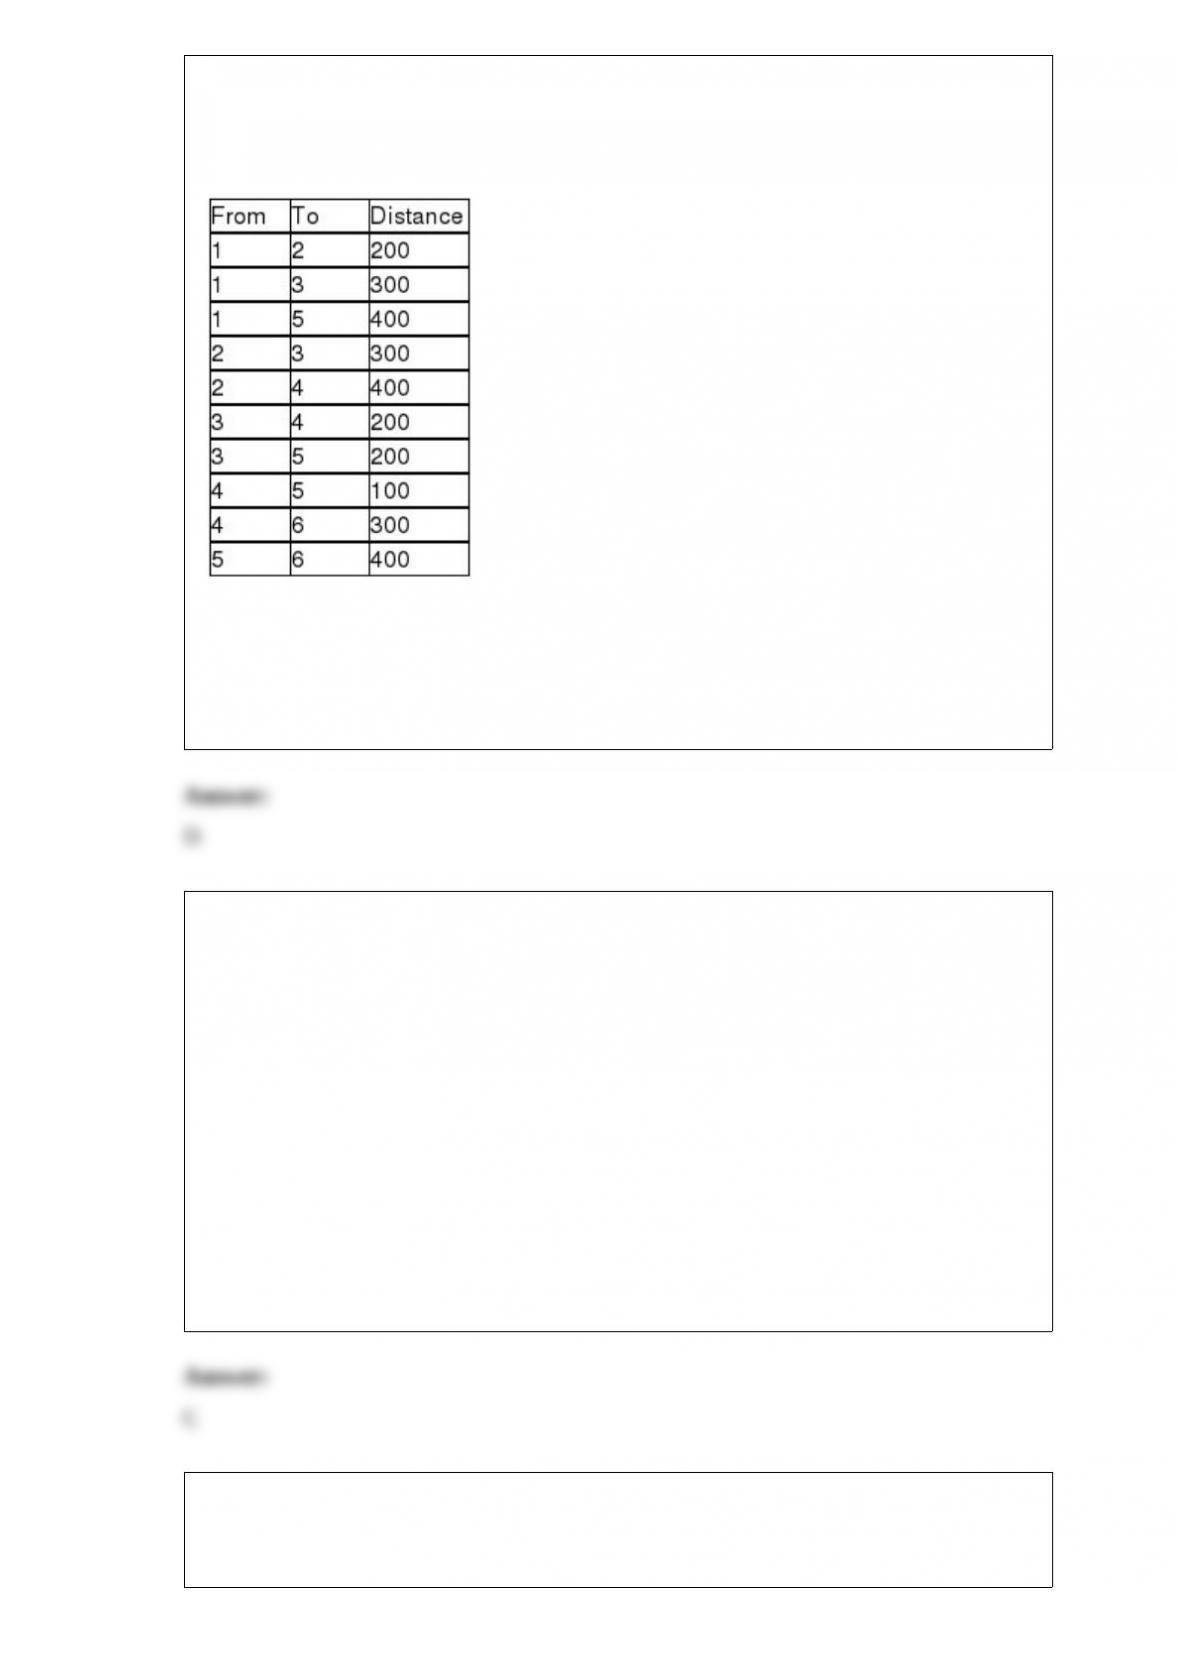
18) Given the following distances between destination nodes, what is the minimum
distance that connects all the nodes?
A) 1000
B) 800
C) 700
D) 1100
E) None of the above
19) A company is considering producing some new Gameboy electronic games. Based
on past records, management believes that there is a 70 percent chance that each of
these will be successful and a 30 percent chance of failure. Market research may be
used to revise these probabilities. In the past, the successful products were predicted to
be successful based on market research 90 percent of the time. However, for products
that failed, the market research predicted these would be successes 20 percent of the
time. If market research is performed for a new product, what is the probability that the
results indicate an unsuccessful market for the product and the product is actually
successful?
A) 0.63
B) 0.06
C) 0.07
D) 0.24
E) 0.21
20) A goal programming problem had two goals (with no priorities assigned). Goal
number 1 was to achieve a profit of $2,400 and goal number 2 was to have no idle time
for workers in the factory. The optimal solution to this problem resulted in a profit of
$2,300 and no idle time. What was the value for the objective function for this goal
programming problem?
A) 2300
B) 100
C) -100
D) 0
E) None of the above
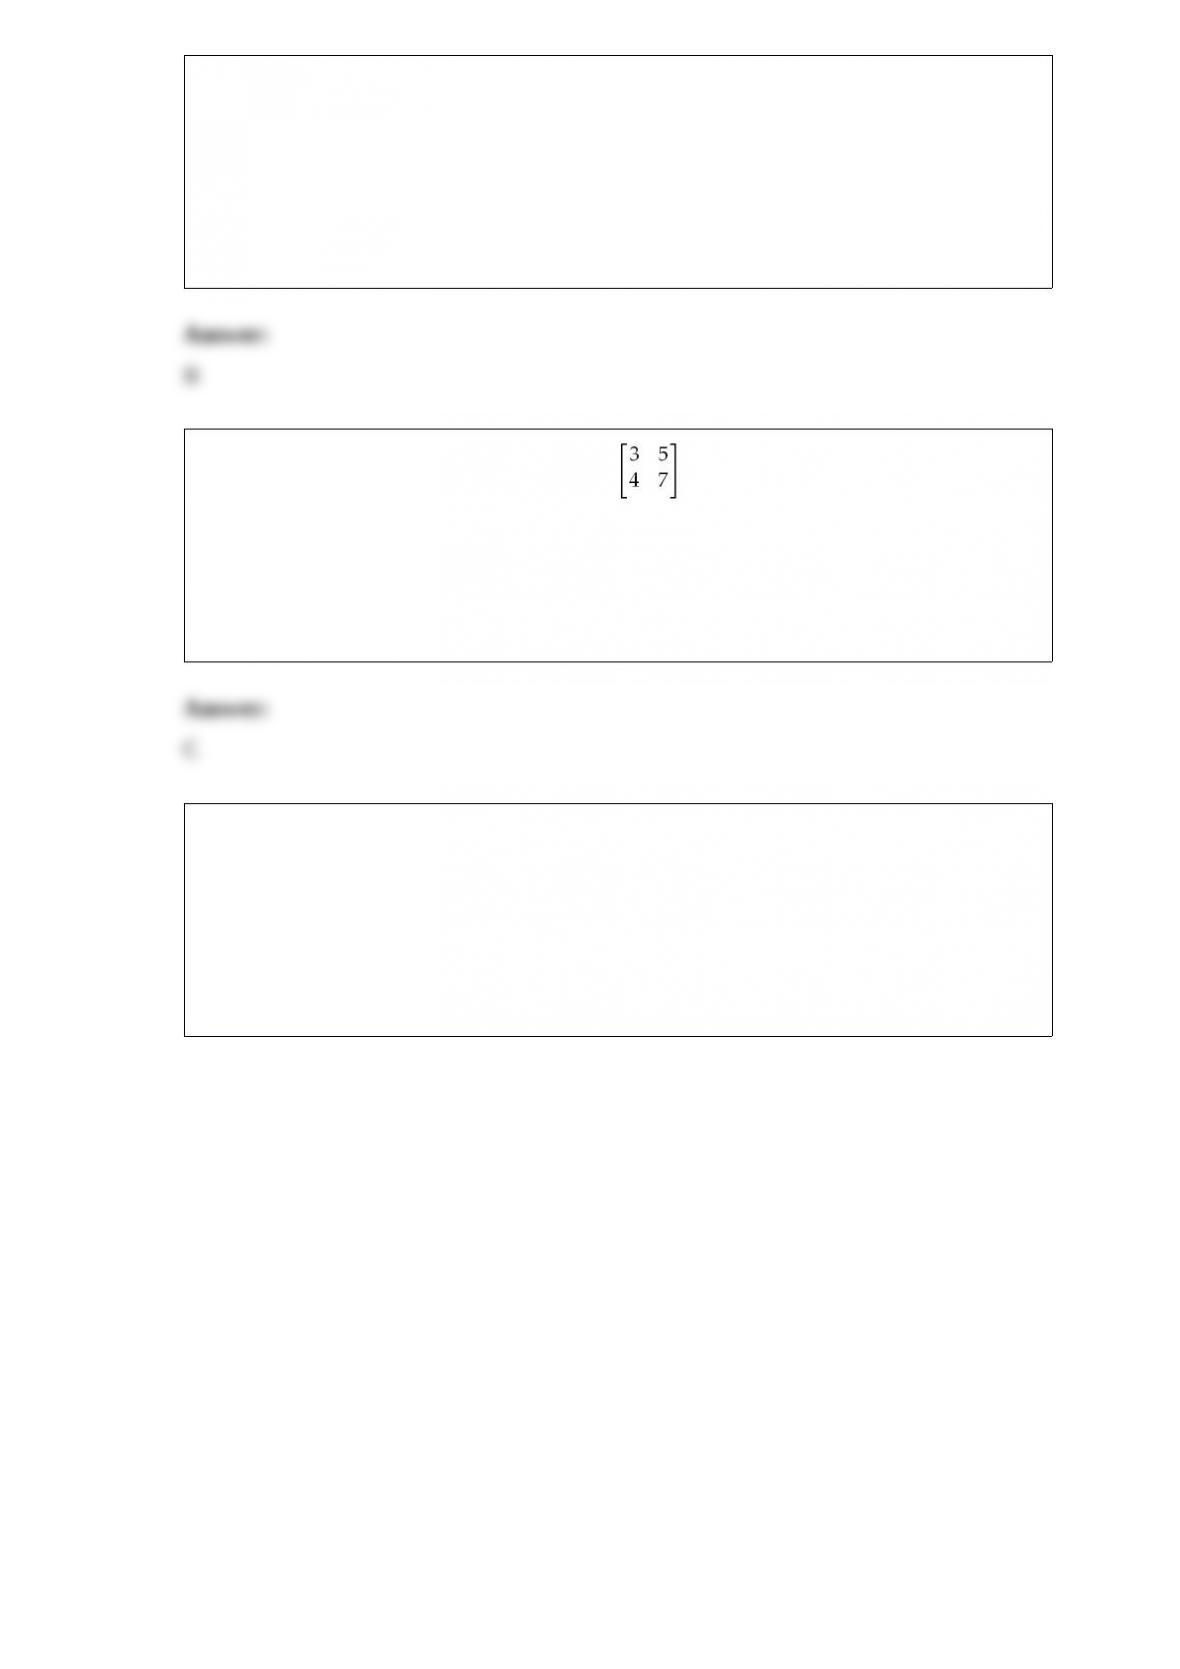
21) Element 2,2 of the inverse of the matrix is
A) -5.
B) -4.
C) 3.
D) 7.
E) None of the above
22) Table 13-4
A pawn shop in Arlington, Texas, has a drive-through window to better serve
customers. The following tables provide information about the time between arrivals
and the service times required at the window on a particularly busy day of the week. All
times are in minutes.
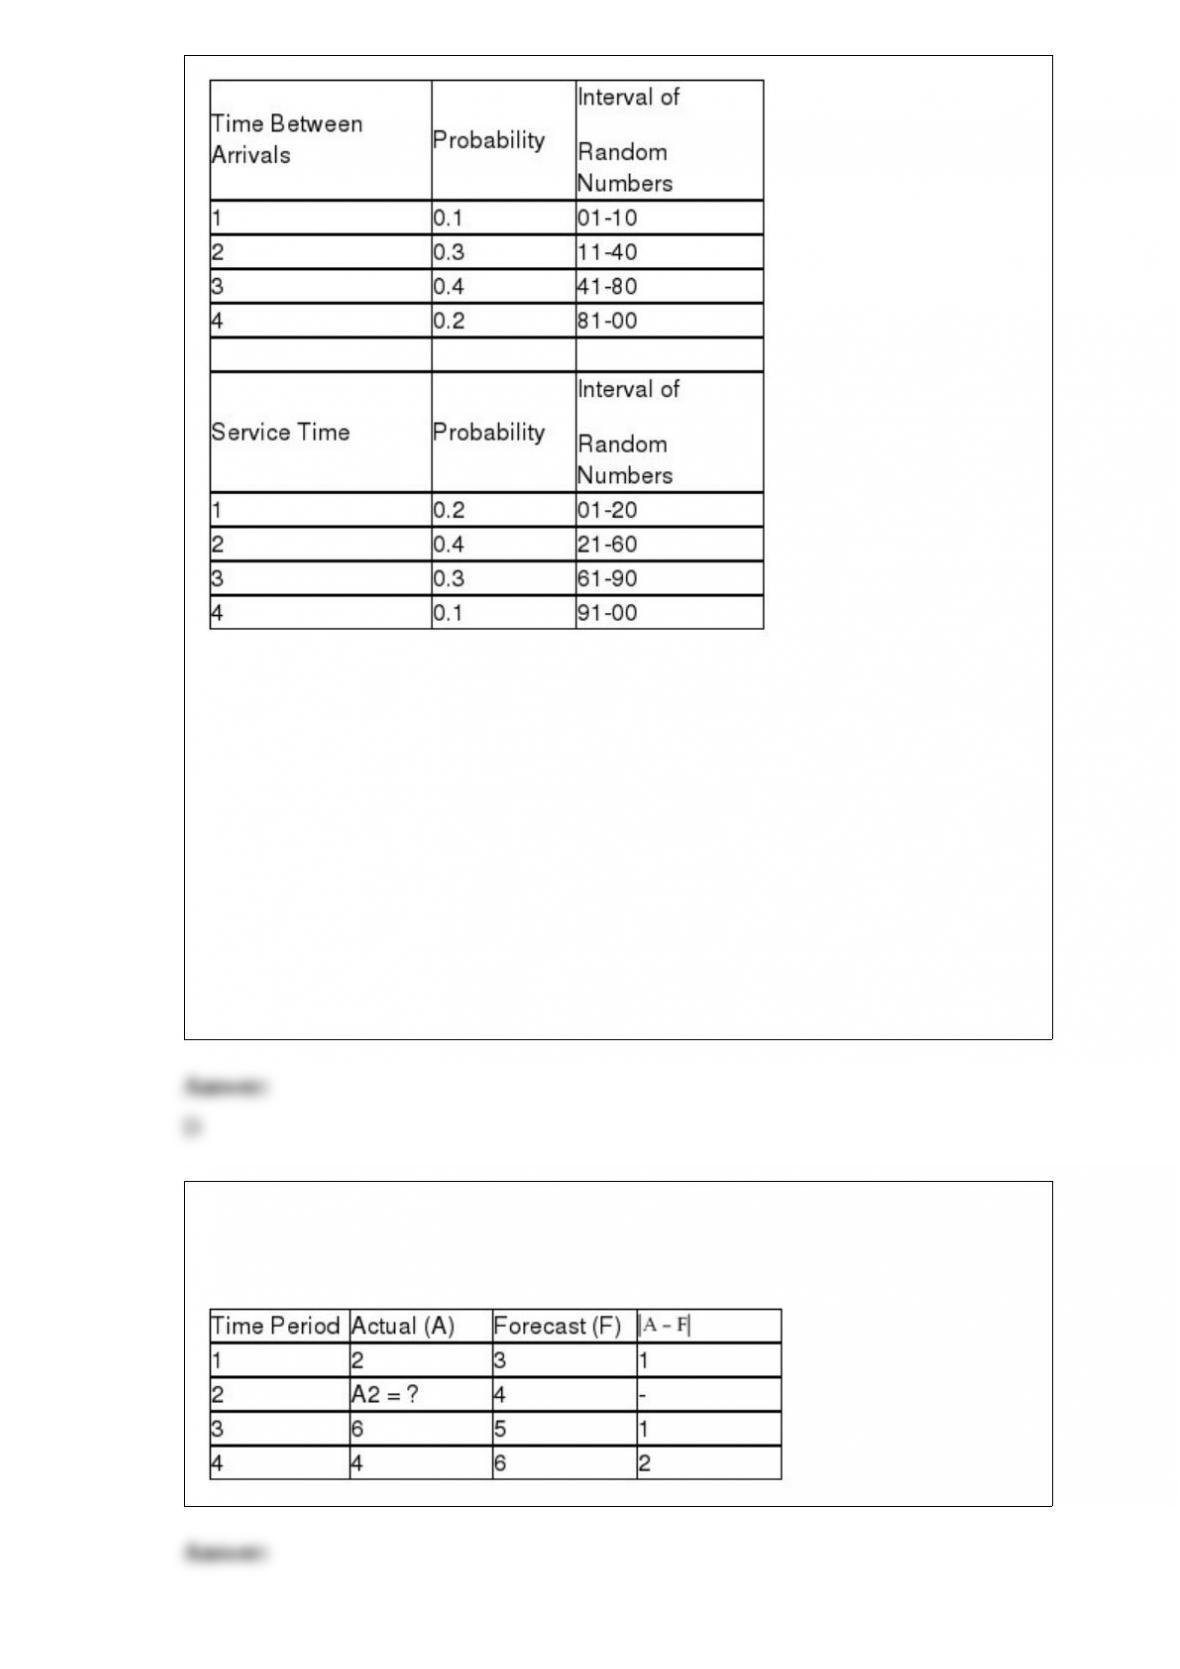
The first random number generated for arrivals is used to tell when the first customer
arrives after opening.
According to Table 13-4, the time between successive arrivals is 1, 2, 3, or 4 minutes.
The store opens at 8:00 a.m., and random numbers are used to generate arrivals and
service times. The first random number to generate an arrival is 39, while the first
service time is generated by the random number 94. What time would the first customer
finish transacting business?
A) 8:03
B) 8:04
C) 8:05
D) 8:06
E) None of the above
23) Given the following data, if MAD = 1.25, determine what the actual demand must
have been in period 2 (A2).
24) The customer who arrives at a bank, sees a long line, and leaves to return another
time is
A) balking.
B) cropping.
C) reneging.
D) blithering.
E) None of the above
25) A market research survey is available for $10,000. Using a decision tree analysis, it
is found that the expected monetary value with the survey is $75,000. The expected
monetary value with no survey is $62,000. What is the expected value of sample
information?
A) -$7,000
B) $3,000
C) $7,000
D) $13,000
E) None of the above
26) Explain the basic difference(s) between the simple EOQ model and the production
run model.
27) The east-to-west (City 5 to City 1) air traffic system passing through the United
States can handle aircraft flows with capacities in hundreds of planes per hour as
shown. What is the peak air traffic load in aircraft per hour from City 5 to City 1 that
this system can handle?
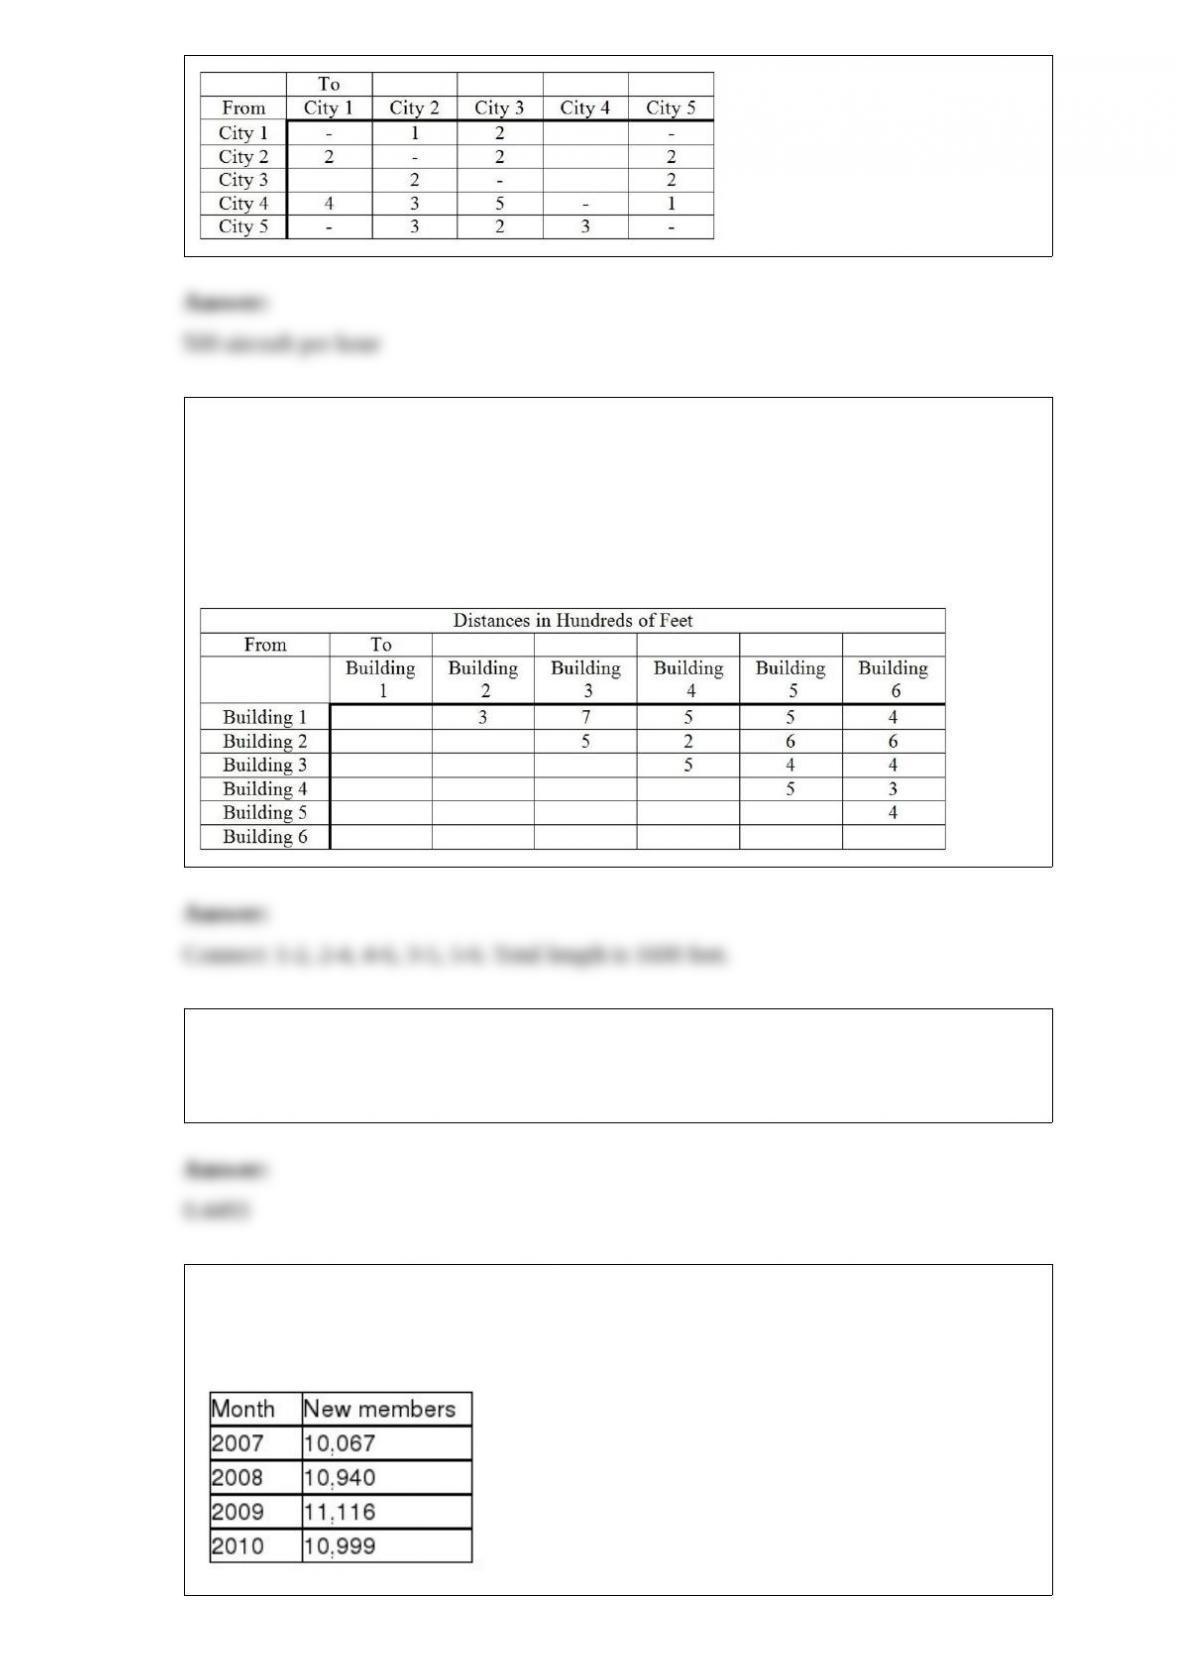
28) Brantley College has decided to “wire” its campus. The first stage in this effort is to
install the “backbone,” i.e., to connect all the buildings. The table below gives the
distances between the various buildings on campus in hundreds of feet. How should the
buildings be connected to minimize the total length of cable? What length of cable is
required?
29) Machine breakdowns occur at a rate of 0.4 per week. The time between breakdowns
follows an exponential distribution. What is the probability that more than 2 weeks go
by without a breakdown?
30) The following table represents the number of applicants at a popular private college
in the last four years.
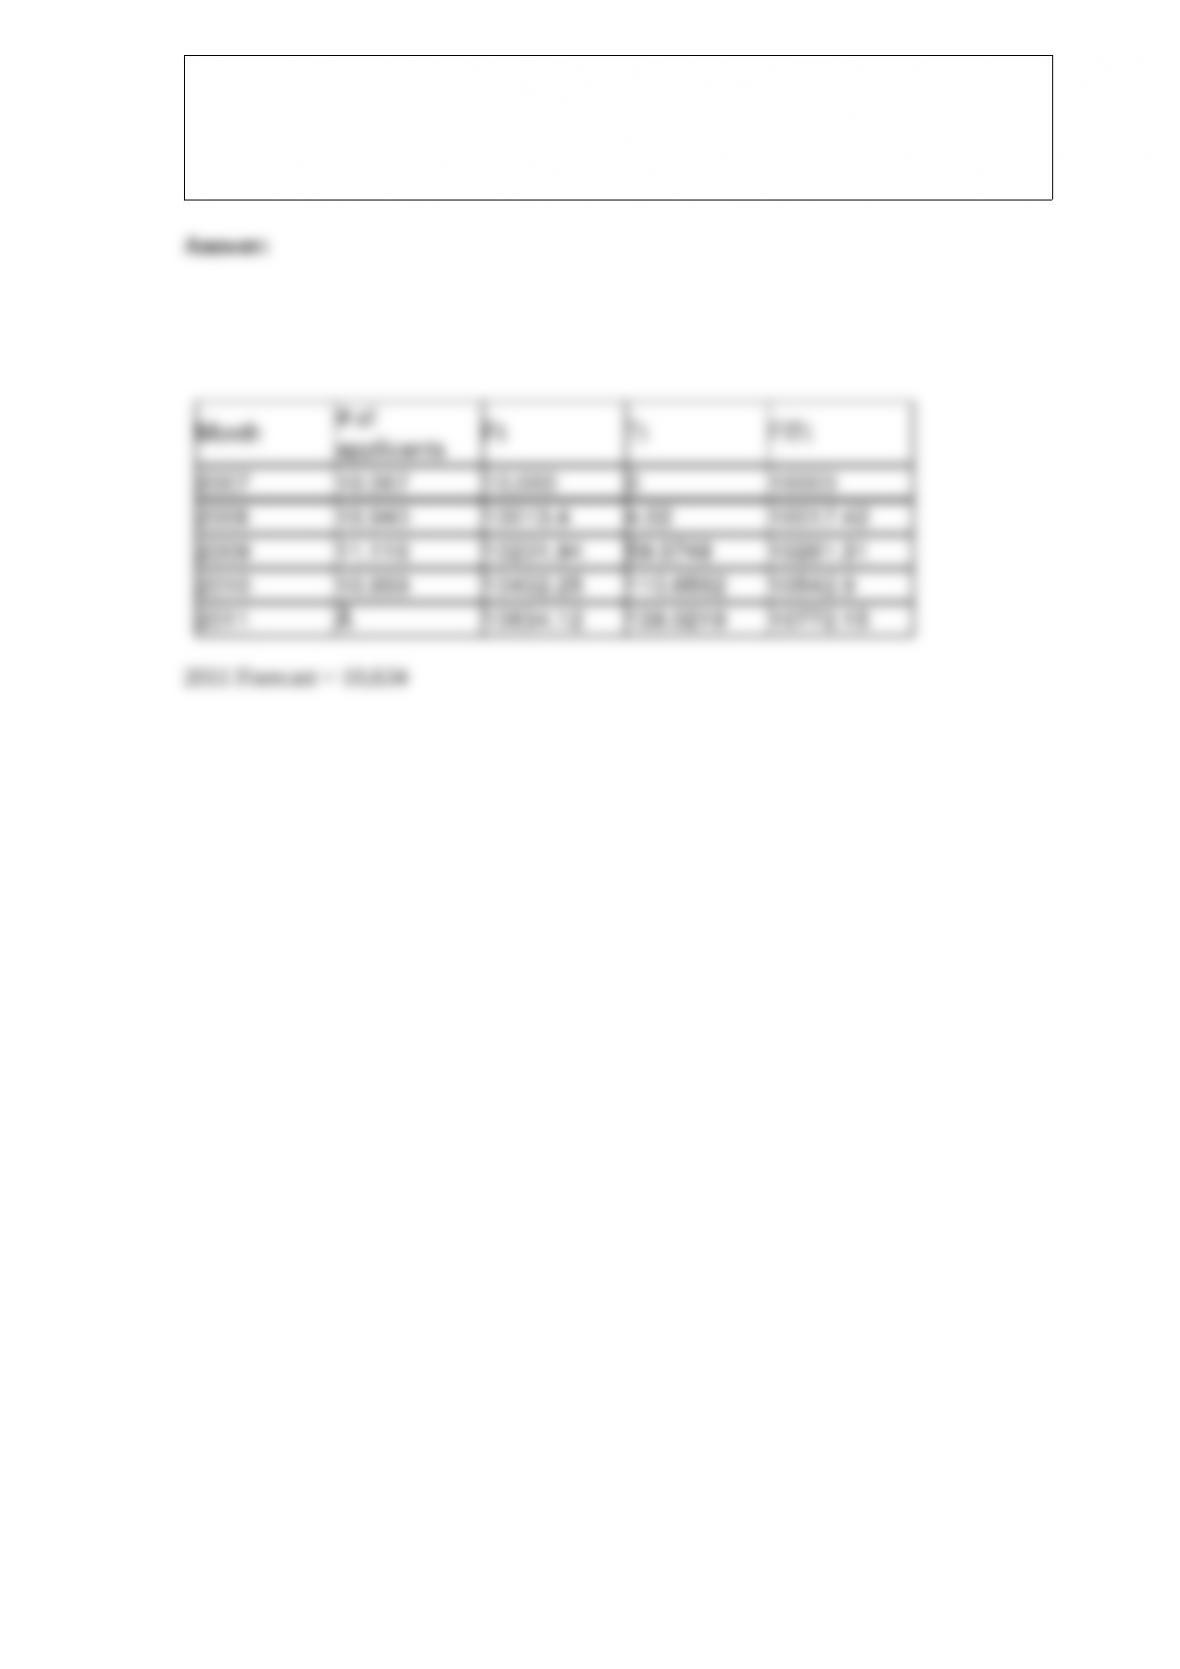
Assuming α= 0.2, β= 0.3, an initial forecast of 10,000 for 2007, and an initial trend
adjustment of 0 for 2007, use exponential smoothing with trend adjustment to come up
with a forecast for 2011 on the number of applicants.