
Which of the following are NOT true of conjoint analysis?
a. Conjoint analysis does not require the respondent to provide self’‘reports regarding
the importance of various product attributes.
b. Conjoint analysis attempts to determine individuals’ utilities for various product
attributes when determining choices.
c. Conjoint analysis provides essentially the same results as a multidimensional scaling
analysis in a given situation.
d. Conjoint analysis is quite dependent on the availability of a computer.
e. All of the above are true of conjoint analysis.
a. increase coding time for a questionnaire.
b. do not permit individuals to elaborate their true position.
c. are often used to begin a questionnaire.
d. b and c.
e. none of the above.
One of the major difficulties experienced with projective methods arises

a. in the interpretations of the replies.
b. when trying to secure the respondent’s cooperation.
c. in the lack of experience of the respondents with these techniques.
d. in the distorted frame of reference of the interviewers.
e. There are no problems with projective methods.
The difference, 02 ‘‘ 01, in the one group pretest’‘posttest design is a measure of
a. E + U.
b. E + U + I.
c. U + I.
d. only I.
e. none of the above.
Which of the following would increase the sample size by the greatest amount?
a. increasing the confidence from 68% to 95% confidence
b. decreasing the confidence from 99% to 95% confidence
c. increasing the precision from 30 to 10
d. decreasing the precision from 10 to 40
e. increasing the precision from 5 to 10
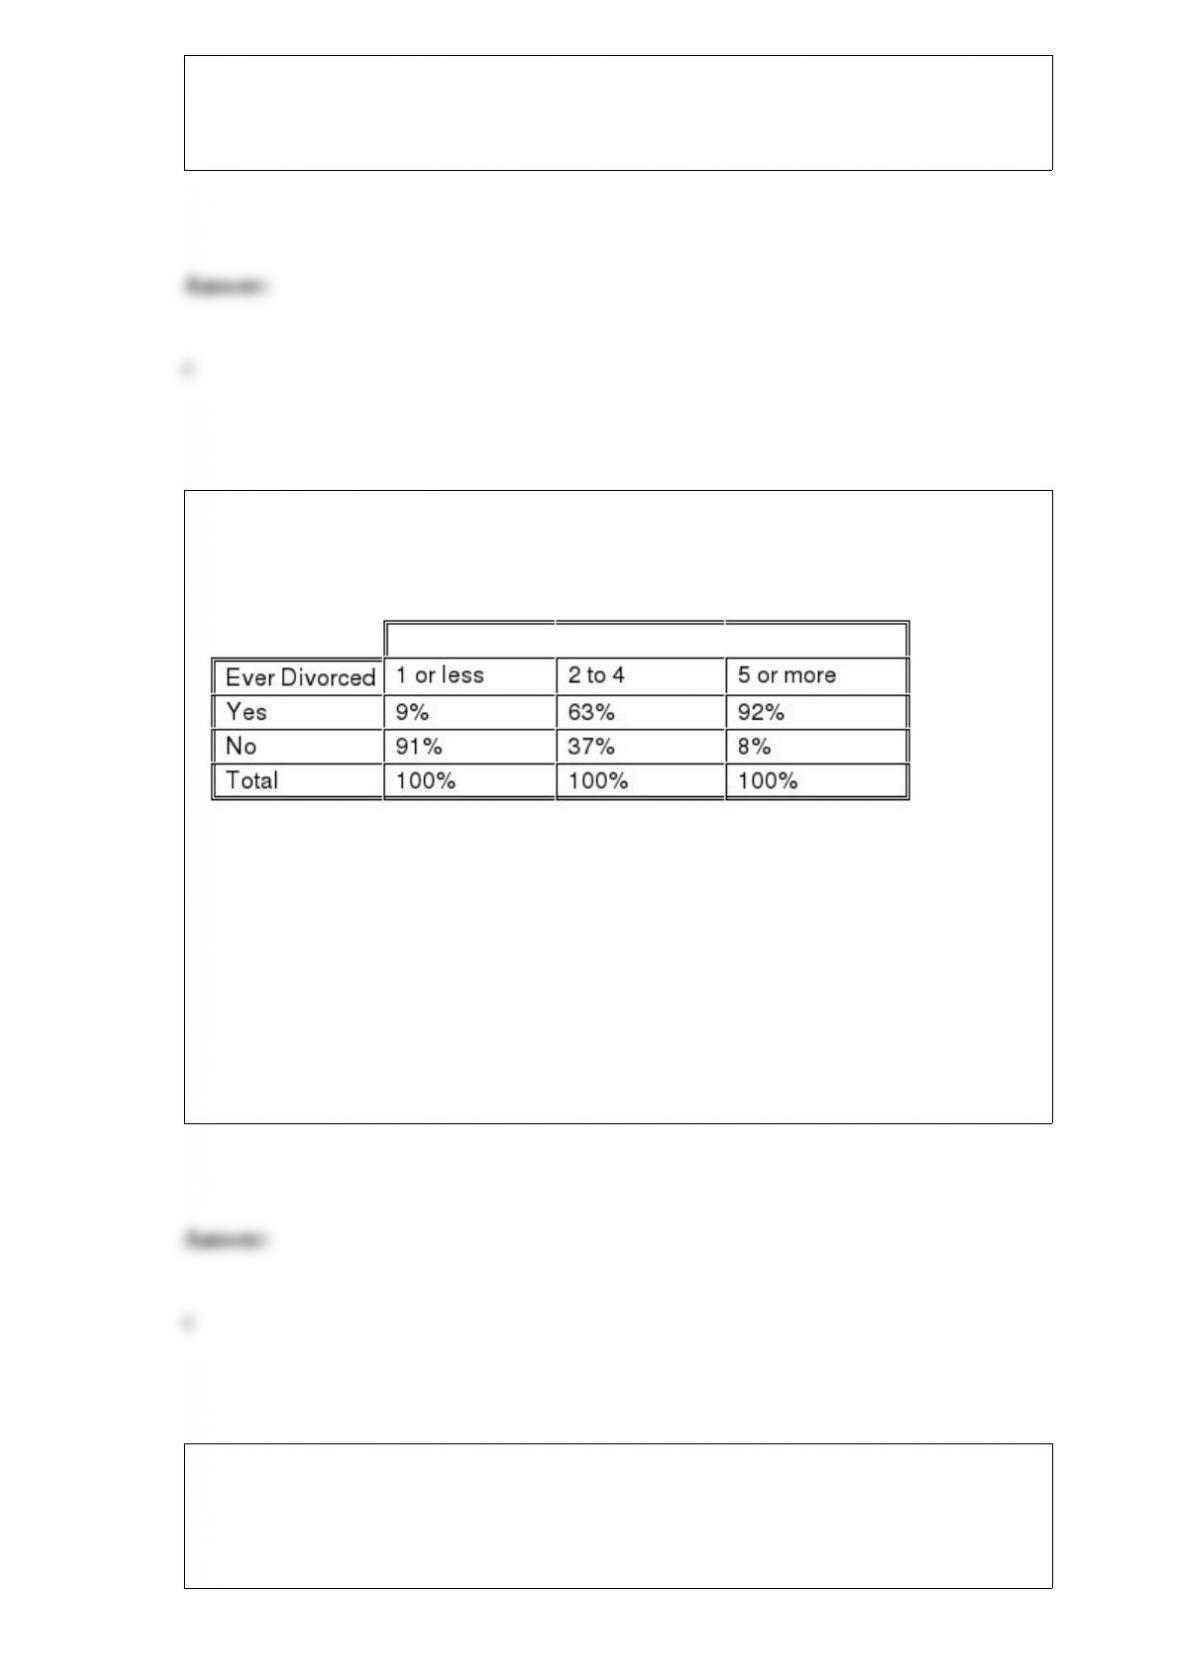
What conclusion(s) can you make from the following cross tabulation?
Number of Children
a. Having more children increases the divorce rate.
b. Getting divorced makes a couple have more children.
c. The more children a person has the more likely s/he is to be divorced.
d. All of the above can be correctly concluded from the cross-tabulation.
e. None of the above can be concluded from the cross-tabulation.
A t’‘statistic has been calculated in order to test the significance of the ß estimate
from a least squares analysis. The estimate was based on 50 observations. How many
degrees of freedom are associated with this test?

a. 50
b. 48
c. 49
d. 47
e. none of the above
Which of the following is NOT one of the key decisions to be made when cluster
analyzing data?
a. selecting and coding the attributes necessary to generate natural groupings
b. selecting an appropriate method of measuring the similarity or resemblance of the
objects
c. select a method of testing the significance of the solution and naming the resulting
clusters
d. both a and c are not key decision in cluster analysis
e. all of the above are key decisions in cluster analysis
The type of study design that affords the researcher the most control is
a. a descriptive design.
b. an exploratory design.

c. a field experiment.
d. a sample survey.
e. a laboratory experiment.
b Which of the following are true of the maximum chance criterion and the proportional
chance criterion?
a. They are equal in value when the diagonal entries are the same.
b. They are equal in value when group sample sizes are equal.
c. The maximum chance criterion is always greater than the proportional chance
criterion.
d. The proportional chance criterion is always greater than the maximum chance
criterion.
e. None of the above are true.
TABLE
Family Size and Ownership of a VCR by Household
(Figures in millions of households)
___________________________________________________________

Family OWN A VCR
Size Yes No TOTAL
___________________________________________________________
Less than 4 10 38 48
4 or more 24 28 52
____________________________________________________________
TOTAL 34 66 100
____________________________________________________________
What relationship can be inferred from the above table between family size and owning
a VCR?
a. Nothing can be inferred.
b. The smaller the family the more likely they are to own a VCR.
c. A lower proportion of large families (4 or more) own VCR’s than small families.
d. Owning a VCR causes the family size to increase.
e. Ownership of a VCR tends to increase as family size increases.
Which of the following statements pertaining to Latin Square design is FALSE?
a. When the Latin Square design is used, the number of categories for each of the
extraneous variables the researcher wishes to control must be greater than the number
of treatments.
b. The Latin Square design is preferred to a randomized block design when there are

two specific extraneous sources of error to be controlled.
c. Every treatment is used once with each category of each blocking variable in a Latin
Square design.
d. The Latin Square design requires that the number of categories for each of the
extraneous variables we wish to control be equal to the number of treatments.
e. All of the above are true.
A researcher wishes to estimate the average annual expenditures per household on
gasoline. The estimate must be accurate within plus or minus $100 and the estimated
standard deviation in such expenditures is $500.
Given estimates and specifications that the population standard deviation is 250, total
precision is 100 and the researcher wishes to be 95% confident in the result, the
required sample size is
a. 10.
b. 50.
c. 100.
d. 500.
e. none of the above.
Which of the following is TRUE?

a. A frequency polygon is developed by connecting the points of change in a cumulative
distribution function.
b. The frequency polygon is obtained from the histogram by connecting the midpoints
of the bars with straight lines.
c. The empirical cumulative distribution function is obtained from the histogram by
connecting the midpoints of the bars of the histogram with straight lines.
d. The empirical cumulative distribution function can only be generated from the cross
tabulation.
e. b and d
Which of the following is FALSE?
a. The families comprising NPD are demographically balanced so the panel can be
projected onto total U.S. purchasing.
b. The National Purchase Diary uses store audits to collect information.
c. Turnover tables can be applied to NPD data.
d. a and b.
e. a, b, and c.
The number provided by the calculation, number of sample units contacted divided by
the total number of sample units approached is commonly called

a. the response rate.
b. the contact rate.
c. the completeness rate.
d. the refusal rate.
e. the nonresponse rate.
Consumers browsing in your local bookstores were asked to make judgments of
similarity among various genre of books. The consumers also made ratings of attributes
of the types of books, so that vectors representing those attributes might be plotted in
the space, aiding interpretation of the dimensions. The consumers also indicated their
preferences among these categories. The results are plotted below.Is consumer S2 likely
to be a man or a woman?
a. a woman; she likes poetry and literature
b. a man; he’s close to dimension 2
c. a woman; she’s opposite the ‘male’ vector
d. a man; but he happens to like poetry
e. indeterminate

Consumers browsing in your local bookstores were asked to make judgments of
similarity among various genre of books. The consumers also made ratings of attributes
of the types of books, so that vectors representing those attributes might be plotted in
the space, aiding interpretation of the dimensions. The consumers also indicated their
preferences among these categories. The results are plotted below.What could you
create to get consumer Sl to buy an art book?
a. photos of the Rocky Mountains
b. masculine art
c. an art audiobook
d. art that combined fiction and masculinity
e. nothing; S1 is not into art books
Structural equations models:
a.are like regression in that some variables predict others.
b.are like factor analysis in that multiple indicator variables may be included.
c.are like discriminant analysis in that group differences are modeled.
d.a and b
e.a, b and c

A research proposal need not contain which of the following:
a. caveats and limitations regarding the scope of the project
b. caveats and limitations regarding the sample
c. technical appendix describing analyses to be conducted
d. labor costs estimates
e. indication of understanding of the client’s marketing problem
Which of these marketing responsibilities can marketing research help with?
a) identifying customer segments
b) strategically selecting segments to target
c) setting pricing to be consistent with marketing strategy
d) managing relationships with suppliers
e) creating Internet banner ads that pull customers to our Web site