
18
7. What is the maximum amount Abbott Labs could have paid for St. Jude’s Medical and still earned its cost of capital? Did Abbott
overpay for St. Jude? Explain your answer.
VALUING THE TWITTER IPO
Case Study Objectives: To Illustrate
• Valuation is far more an art than a science.
• Understanding the limitations of individual valuation methods is critical.
• Averaging multiple valuation methods is often the most reliable means of valuing a firm.
• The credibility of any valuation ultimately rests on the credibility of its key underlying assumptions.
In the now infamous “dotcom” era, firms like Yahoo, Lycos, Excite and others evolved into portals in a desperate attempt to find ways to
make money from providing users the ability to search the web. Enter Google and the competitive landscape changed quickly. Google
invented the concept of paid search and contextual, pay–to-click advertising models.
Today, social networks like Twitter and Facebook, while attracting new users at an astonishing pace, have not fully defined their
business models. In fact, the eventual winners in the social networking space may not even exist today. Nonetheless, investor expectations
for the growth potential of social networking firms remained very optimistic during 2013. This investor enthusiasm prompted Twitter’s
financial backers and founders to take the firm public late in 2013, at a time when the firm’s valuation was likely to be high.
Twitter got its start in 2006, first with Jack Dorsey and then Evan Williams as CEO. In 2013, its CEO was Dick Costolo, a former
Google executive, steered the firm through one of the most exciting times in the firm’s young life. Since its inception, the social network
that lets users send short messages or “tweets” 140 characters in length has attracted world leaders, religious icons, and celebrities as well
as CEOs, marketers, and self-promoters. Twitter at the time of the IPO had 230 million users with three quarters outside the U.S.
In early 2013, Twitter had a valuation based on the sales of shares by employees to BlackRock, a multinational investment
management corporation, of $9 billion. According to pre-IPO leaks, hedge funds in the months immediately prior to the IPO in late 2013
were offering to pay $28 per privately traded shares, setting a $14 billion valuation for the entire firm.
Per the IPO prospectus, Twitter’s projected revenue from advertising in 2013 was $600 million based on what Twitter call “promoted
Tweets.” Revenue projections for 2014 were $1 billion. Using this information, investors in anticipation of the November 6, 2013 IPO
turned to estimating the market value of Twitter based on comparable publicly traded firms. Firms believed to be similar to Twitter were
those in the social networking space and which seemed to display similar growth, risk and profitability characteristics. As is often the
case, there were no firms that were both publicly traded and truly similar in size, product offering, and which satisfied the same customer
needs. Investors used valuation multiples for Facebook, LinkedIn, and Yelp as Twitter’s foremost peers.
Without detailed financial statements, investors groped for rudimentary valuation estimates based simply on revenue, the easiest metric
to find. Just prior to the IPO, Facebook traded at 18 times estimated 2013 sales. LinkedIn and Yelp traded for about 22 and 23 times
19
estimated 2013 sales, respectively. Multiples of projected 2014 revenue just prior to the Twitter IPO were 11, 14, and 13 times revenue
for Facebook, LinkedIn, and Yelp, respectively.
Since the firm was expected to lose $(.11) per share in 2013 and $(.02) in 2014, Twitter could not be valued based on estimates of
earnings per share or similar profitability measures. However, it could also be valued based on enterprise value as a multiple of earnings
before interest, depreciation, and amortization (EBITDA). For most firms, EBITDA is positive and often is used as a proxy for cash flow.
Enterprise value (EV) includes the market value of equity and debt less cash on the balance sheet. The appropriate valuation multiple was
calculated by computing the ratio of EV to EBITDA. Using this valuation multiple, Facebook traded at a ratio of 36 and LinkedIn at 159
for 2014. Yelp, with a negative EBITDA for 2013, did not have a meaningful enterprise to EBITDA ratio. Twitter’s estimated EBITDA
for 2013 was $230 million and $260 million in 2014.
These valuation multiples implied a very high valuation (market capitalization) and price per share for the IPO. But investors remained
cautious, as valuation estimates too often prove wrong. For every successful IPO like LinkedIn, there is a Groupon or Zynga that were
duds. Groupon, the provider of online discount coupons, went public in November 2011 at $20 per share. After accounting
investigations, slowing growth and a CEO firing, its shares traded at $11.50 at the time of the Twitter IPO. Online game maker Zynga,
which went public at $10 a share around the same time as Groupon, was unable to fully adjust as its users went mobile and now trades at
$3 per share. Facebook’s valuation at the time of its IPO on May 17, 2012 was $109 billion. Facebook then saw its valuation fall by 50
percent in the months immediately following the IPO. Its shares now trade well above its IPO price of $38 per share.
Moreover, Twitter’s user growth had slowed giving investors another reason to be cautious. After hitting 200 million monthly active
users at the end of 2012, the firm set a goal of 400 million by the end of 2013. At the time of the IPO, active users numbered a far more
modest 240 million.
Investors also had reason to question how similar Twitter actually was to its presumed peers. For example, the differences between
Twitter and Facebook are enormous in that they purport to satisfy substantially different user needs. Twitter is focused and simple while
Facebook offers users a portal interface. Facebook appeals to people looking to reconnect with friends and family or find new friends
online and offers email, instant messaging, image and video sharing. Most people can grasp how to use Facebook quickly. In contrast, the
usefulness of Twitter is not as obvious to some people as Facebook, although it may be more addictive since you get immediate
responses. Users often say they like Twitter because they can get instant responses to a question or comment.
The actual value of the IPO depended on whether investors used basic shares outstanding or fully diluted shares. Twitter ended the first
day of the IPO at $44.90 a share based on the number of basic shares outstanding (excluding options and restricted shares). Unlike the
Facebook IPO, the Twitter IPO went off without a hitch. This valued the firm at $24.9 billion. This valuation is based on 555 million
shares outstanding. The basic share count excludes options, warrants, and restricted stock. Altogether, Twitter has 150 million such shares
according to the IPO filing bringing the total share count to 705 million. Failure to include these shares can result in investors ignoring
their impact on dilution of EPS and ownership stake. Such investors pay more than they should.
Another adjustment must be made in calculating fully diluted shares outstanding for options and warrants. When options and warrants
are exercised by their holders, Twitter received cash equal to the number of options multiplied by their weighted average exercise price.
For the purpose of analysis, investors, typically assume a firm will reinvest the combined proceeds from the exercise of options and
warrants into buying back shares. This lowers Twitters diluted share count slightly to 704 million.
Based on fully diluted shares outstanding of 704 million shares, the IPO price per share of $44.90 placed the value of the IPO at $31.6
billion (i.e., 704 x $44.90), $6.7 billion more than the $24.9 billion valuation based only on basic shares outstanding. Using the basic
market capitalization, Twitter was valued at 24.9 times 2014 sales estimates (i.e., $24.9 billion in market value/$1 billion in revenue).
Using fully diluted shares outstanding, the multiple rises to 31.6 times (i.e., $31.6 billion in market value/$1 billion in revenue). That gap
should close over time since firms like Twitter tend to issue fewer options and restricted stock following the IPO.
Discussion Questions
1. Based on the information given in the case, how would you estimate the value of Twitter at the time of the IPO based on a simple
average of comparable firm revenue multiples based on projected 2014 revenue?
20
2. Based on the information given in the case, how would you estimate the value of Twitter at the time of the IPO based on a simple
average of comparable firm enterprise to EBITDA multiples based on projected 2014 EBITDA?
3. The valuation estimates in the preceding two questions are substantially different. What are the key assumptions underlying each
valuation method? Be specific. How can an analyst combine the two valuation estimates assuming she believes that the enterprise to
EBITDA ratio is twice as reliable as the valuation based on a revenue multiple?
4. Scenario analysis involves valuing businesses based on different sets assumptions about the future. What are the advantages and
disadvantages of applying this methodology in determining an appropriate purchase price using relative valuation methods to
estimate firm value?
China’s CNOOC Acquires Canadian Oil and Gas Producer Nexen Inc.
______________________________________________________________
Key Points
• DCF valuation assumes implicitly that management has little decision-making flexibility once an investment decision is made.
• In practice, management may accelerate, delay, or abandon the original investment as new information is obtained.
_____________________________________________________________________________
In its largest foreign takeover ever, China’s state owned energy company CNOOC acquired Canadian oil and gas company Nexen Inc. in
2013 for $15.1 billion. The acquisition gives CNOOC new offshore production in the North Sea, the Gulf of Mexico, offshore of western
Africa, and oil and gas properties in the Middle East and Canada. The deal also gives CNOOC control of major oil sands reserves in
Canada.
This acquisition by CNOOC represents an effort to secure geographically distributed sources of existing production and future reserves
as well as a bet on the future development of nonconventional oil and gas reserves such as the Canadian oil sands. Given the nature of the
reserves, their development is considerably more costly than conventional crude reserves. Also, the process by which oil sands are
converted to usable crude oil releases more carbon into the atmosphere than conventional crude extraction. This has created substantial
opposition among environmental groups seeking to limit or eliminate further development of oil sands. Consequently, there is a real
question as to the long-term value of such reserves.
The pace at which these new oil sands reserves would be developed by CNOOC would depend on the future demand for oil and global
oil prices and the ability to overcome objections to their development. Opposition to further development of the reserves had also blocked
construction of the pipelines necessary to transport the oil to energy hungry consumers in the U.S. and to Canada’s west coast to enable

21
export to China. Continued opposition to further development of these properties could reduce their value significantly. Given these
uncertainties what options does CNOOC have with respect to these reserves?
Standard discounted cash flow analysis assumes implicitly that once CNOOC made this investment decision to buy Nexen, CNOOC’s
management could do little to alter the investment stream it had included in the calculation of future cash flows used to value Nexen. In
reality, management has a series of so-called real options enabling changes to be made to their original investment decisions. Which
option would be pursued was contingent on certain future developments. These options include the decision to expand (i.e., accelerate
investment), delay investment, or abandon an investment.
With respect to CNOOC’s acquisition of Nexen, the major uncertainties deal with the actual timing and amount of the projected cash
flows. In practice, CNOOC’s management could accelerate investment in the Canadian oil sands reserves if oil prices were to rise
sufficiently (and were likely to remain at those levels) to offset the higher development costs and if environmental opposition could be
overcome, enabling the construction of additional pipeline capacity. In the absence of lessening hostility from environmentalists,
investment to develop the reserves could be delayed until circumstances improved. If concerns about the release of carbon precluded
further development of reserves beyond current oil sands drilling and extraction operations, CNNOC could abandon the reserves and spin-
off or divest already developed oil sands fields. While expensive, the latter option allows the firm to limit future losses. The bottom line
is that management has considerably greater decision-making flexibility than is implicit in traditional discounted cash flow analysis.
Is Texas Instruments Overpaying for National Semiconductor? As Always, It depends.
Key Points
Valuation is far more an art than a science, and understanding the limitations of individual valuation methods is critical.
Averaging multiple valuation methods is often the most reliable means of valuing a firm.
Evaluating success of an individual acquisition is best viewed in the context of an acquirer’s overall business strategy.
Value is in the eye of the beholder. Various indicators often provide a wide range of estimates. No single method seems to provide
consistently accurate valuation estimates. Which method the analyst ultimately selects often depends on the availability of data and on the
analyst’s own biases. Whether a specific acquisition should be viewed as successful depends on the extent to which it helps the acquirer
realize a successful business strategy.
At $25 per share in cash, Texas Instruments (TI) announced on March 5, 2011, that it had reached an agreement to acquire National
Semiconductor (NS). The resulting 78% premium over NS’s closing share price the day prior to the announcement raised eyebrows. After
showing little activity in the days immediately prior to the announcement, NS’s share price soared by 71% and TI’s share price rose by
2.25% immediately following the announcement. While it is normal for the target’s share price to rise sharply to reflect the magnitude of
the premium, the acquirer’s share price sometimes remains unchanged or even declines. The increase in TI’s share price seems to suggest
agreement among investors that the acquisition made sense. However, within days, analysts began to ask the question that bedevils so
many takeovers. Did Texas Instruments overpay for National Semiconductor?
Whether TI overpaid depends on how you measure value and how you interpret the results. Looking at recent semiconductor industry
transactions, the magnitude of the premium is almost twice the average paid on 196 acquisitions in the semiconductor industry during the
last several years. Based on price–to-earnings ratio analysis, TI paid 19.1 times NS’s 2012 estimated earnings, as compared to 14.3 times
industry average earnings for the same year. This implied that TI was willing to pay $19.10 per share for each dollar of the next year’s
earnings per NS share. In contrast, investors were generally willing to pay on average on $14.30 for each dollar of 2012 earnings for the
average firm in the semiconductor industry. Using a ratio of market capitalization (market price) to sales, it also appears that TI’s
premium is excessive. TI paid four times NS’s current annual sales, well above other key competitors. such as Maxim Integrated Products
and Intersil, which traded at 3.2 and 1.8 times sales, respectively.
The enterprise-value-to-sales ratio compares the value of a firm to its revenue and gives investors an idea of how much it costs to buy
the company’s sales. Some analysts believe that it is a more useful indicator than a market-capitalization-to-sales ratio, which considers
only how equity investors value each dollar of sales, since the market-cap-to–sales ratio ignores that the firm’s current debt must be
repaid. By this measure, TI is willing to pay $4.40 for each dollar of revenue, as compared to $3.80 per dollar of sales for the average
semiconductor firm. Another useful valuation ratio, the price-to-earnings ratio divided by the earnings growth rate (PEG ratio), also
suggested that TI might have overpaid. The PEG ratio relates what investors are willing to pay for a firm per dollar of earnings to the
growth rate of earnings. At 1.28 prior to the TI takeover, NS was trading at a premium to its growth rate according to this measure. After
the acquisition, the PEG ratio jumped to 2.09.
While suggesting strongly that TI overpaid, these measures may be seriously biased. A large percentage of TI’s and NS’s revenue
comes from the production and sale of analog chips, a rapidly growing segment of the semiconductor industry. Part of the growth in
analog chips is expected to come from the explosive growth of smartphones and tablets, where their use in regulating electricity
consumption is crucial to longer battery life. Consequently, many of the previous acquisitions in the semiconductor industry are of firms
that do not compete in the analog chip market; as such, they are not entirely comparable. Moreover, many of these acquisitions came
amidst a sluggish economic recovery and were made at “fire–sale” prices.
With the exception of comparisons with recent comparable transactions, all of these valuation measures do not consider directly the
value of synergy. There was little overlap between TI’s and NS’s product offering. TI believes that they can increase substantially NS’s
sales by selling their products through TI’s much larger sales force. Furthermore, TI added 12,000 new analog chip products, bringing its
combined offering to more than 30,000 products. TI also gets access to a number of analog engineers, who are highly specialized and
relatively rare. Finally, in the highly fragmented semiconductor industry, consolidation among competitors may lead to higher average
selling prices than would have been realized otherwise.
The acquisition of NS by TI should be viewed in the context of a longer-term strategy in which TI is seeking an ever-increasing share
of the $42 billion analog chip market, which many analysts expect to outgrow the overall semiconductor market during the next three to
five years. Following the financial crisis in 2008, TI acquired analog chip manufacturing facilities at “fire–sale” prices to boost the firm’s
capacity. The NS acquisition will give TI a 17% share of this rapidly growing market segment.
Discussion Questions
1. Most studies purporting to measure the success or failure of acquisitions base their findings of the performance of acquiring
share prices around the announcement date of the acquisition or on accounting performance measures during the three to
five years following the acquisition. This requires that acquisitions be evaluated on a “standalone” basis. Do you agree or
disagree with this methodology? Explain your answer.
2. Despite their limitations, why is the judicious application of the various valuation methods critical to the acquirer in
determining an appropriate purchase price?
23
3. Scenario analysis involves valuing businesses based of different sets assumptions about the future. What are the advantages
and disadvantages of applying this methodology in determining an appropriate purchase price?
4. Do you agree or disagree with the following statement: Valuation is more an art than a science. Explain your answer.
Bristol-Myers Squibb Places a Big Bet on Inhibitex
___________________________________________________________
Key Points
DCF valuation assumes implicitly that management has little decision-making flexibility once an investment decision is made.
In practice, management may accelerate, delay, or abandon the original investment as new information is obtained.
______________________________________________________________________________________________________________
Pharmaceutical firms in the United States are facing major revenue declines during the next several years because of patent expirations for
many drugs that account for a substantial portion of their annual revenue. The loss of patent protection will enable generic drug makers to
sell similar drugs at much lower prices, thereby depressing selling prices for such drugs across the industry. In response, major
pharmaceutical firms are inclined to buy smaller drug development companies whose research and developments efforts show promise in
order to offset the expected decline in their future revenues as some “blockbuster” drugs lose patent protection.
Aware that its top-selling blood thinner, Plavix, would lose patent protection in May 2012, Bristol–Myers Squibb (Bristol-Myers)
moved aggressively to shed its infant formula and other noncore businesses to focus on pharmaceuticals. Such restructuring has reduced
employment from 40,000 in 2008 to 26,000 in 2011. Bristol–Myers’ strategy has been either to acquire firms with promising drugs under
development or to develop them internally. However, the firm faced an uphill struggle to offset the potential loss of $6.7 billion in annual
Plavix revenue, which represented about one-third of the firm’s total annual revenue.
In early January 2012, Bristol-Myers announced that it had reached an agreement to purchase hepatitis C drug developer Inhibitex Inc.
for $2.5 billion. Inhibitex focuses on treatments for bacterial and viral infections. It had annual revenue of only $1.9 million and an
operating loss of $22.7 million in 2011. The lofty purchase price reflected Bristol–Myers’ growth expectations for the firm’s hepatitis C
treatment INX-189, based on very early phase one clinical testing trials, with larger trials scheduled for 2013. The all-cash deal for $26
per share represented a 164% premium to Inhibitex’s closing price on January 10, 2012.
Bristol-Myers valued Inhibitex in terms of the expected cash flows resulting from the commercialization of hepatitis C treatment INX–
189. Standard discounted cash flow analysis assumes implicitly that once Bristol-Myers makes an investment decision, it cannot change
its mind. In reality, management has a series of so-called real options enabling them to make changes to their original investment decision
contingent on certain future developments.

24
These options include the decision to expand (i.e., accelerate investment at a later date), delay the initial investment, or abandon an
investment. With respect to Bristol–Myers’ acquisition of Inhibitex, the major uncertainties deal with the actual timing and amount of the
projected cash flows. In practice, Bristol–Myers’ management could expand or accelerate investment in the new Inhibitex drug, contingent
on the results of subsequent trials. The firm could also delay additional investment until more promising results are obtained. Finally, if
the test results suggest that the firm is not likely to realize the originally anticipated developments, it could abandon or exit the business
by spinning-off or divesting Inhibitex or by shutting it down. The bottom line is that management has considerably greater decision–
making flexibility than is implicit in traditional discounted cash flow analysis.
Google Buys YouTube: Valuing a Firm Without Cash Flows
YouTube ranks as one of the most heavily utilized sites on the Internet, with one billion views per day, 20 hours of new video uploaded
every minute, and 300 million users worldwide. Despite the explosion in usage, Google continues to struggle to “monetize” the traffic on
the site five years after having acquired the video sharing business. 2010 marked the first time the business turned marginally profitable.
Whether the transaction is viewed as successful depends on whether it is evaluated on a stand-alone basis or as part of a larger strategy
designed to steer additional traffic to Google sites and promote the brand.
This case study illustrates how a value driver approach to valuation could have been used by Google to estimate the potential value of
YouTube by collecting publicly available data for a comparable business. Note the importance of clearly identifying key assumptions
underlying the valuation. The credibility of the valuation ultimately depends on the credibility of the assumptions.
Google acquired YouTube in late 2006 for $1.65 billion in stock. At that time, the business had been in existence only for 14 months,
consisted of 65 employees, and had no significant revenues. However, what it lacked in size it made up in global recognition and a rapidly
escalating number of site visitors. Under pressure to continue to fuel its own meteoric 77 percent annual revenue growth rate, Google
moved aggressively to acquire YouTube in an attempt to assume center stage in the rapidly growing online video market. With no debt,
$9 billion in cash, and a net profit margin of about 25 percent, Google was in remarkable financial health for a firm growing so rapidly.
The acquisition was by far the most expensive acquisition by Google in its relatively short eight-year history. In 2005, Google spent
$130.5 million in acquiring 15 small firms. Google seemed to be placing a big bet that YouTube would become a huge marketing hub as
its increasing number of viewers attracts advertisers interested in moving from television to the Internet.
Started in February 2005 in the garage of one of the founders, YouTube displayed in 2006 more than 100 million videos daily and had
an estimated 72 million visitors from around the world each month, of which 34 million were unique.1 As part of Google, YouTube
retained its name and current headquarters in San Bruno, California. In addition to receiving funding from Google, YouTube was able to
tap into Google’s substantial technological and advertising expertise.
To determine if Google would be likely to earn its cost of equity on its investment in YouTube, we have to establish a base-year free
cash-flow estimate for YouTube. This may be done by examining the performance of a similar but more mature website, such as
about.com. Acquired by The New York Times in February 2005 for $410 million, about.com is a website offering consumer information
and advice and is believed to be one of the biggest and most profitable websites on the Internet, with estimated 2006 revenues of almost
$100 million. With a monthly average number of unique visitors worldwide of 42.6 million, about.com‘s revenue per unique visitor was
estimated to be about $0.15, based on monthly revenues of $6.4 million.2
By assuming these numbers could be duplicated by YouTube within the first full year of ownership by Google, YouTube could
potentially achieve monthly revenue of $5.1 million (i.e., $0.15 per unique visitor × 34 million unique YouTube visitors) by the end of
year. Assuming net profit margins comparable to Google’s 25 percent, YouTube could generate about $1.28 million in after-tax profits on
those sales. If that monthly level of sales and profits could be sustained for the full year, YouTube could achieve annual sales in the
second year of $61.2 million (i.e., $5.1 × 12) and profit of $15.4 million ($1.28 × 12). Assuming optimistically that capital spending and
depreciation grow at the same rate and that the annual change in working capital is minimal, YouTube’s free cash flow would equal after–
tax profits.
25
Recall that a firm earns its cost of equity on an investment whenever the net present value of the investment is zero. Assuming a risk–
free rate of return of 5.5 percent, a beta of 0.82 (per Yahoo! Finance), and an equity premium of 5.5 percent, Google’s cost of equity
would be 10 percent. For Google to earn its cost of equity on its investment in YouTube, YouTube would have to generate future cash
flows whose present value would be at least $1.65 billion (i.e., equal to its purchase price). To achieve this result, YouTube’s free cash
flow to equity would have to grow at a compound annual average growth rate of 225 percent for the next 15 years, and then 5 percent per
year thereafter. Note that the present value of the cash flows during the initial 15-year period would be $605 million and the present value
of the terminal period cash flows would be $1,005 million. Using a higher revenue per unique visitor assumption would result in a slower
required annual growth rate in cash flows to earn the 10 percent cost of equity. However, a higher discount rate might be appropriate to
reflect YouTube’s higher investment risk. Using a higher discount rate would require revenue growth to be even faster to achieve an NPV
equal to zero.
Google could easily have paid cash, assuming that the YouTube owners would prefer cash to Google stock. Perhaps Google saw its
stock as overvalued and decided to use it now to minimize the number of new shares that it would have had to issue to acquire YouTube,
or perhaps YouTube shareholders simply viewed Google stock as more attractive than cash.
With YouTube having achieved marginal profitability in 2010, it would appear that the valuation assumptions implicit in Google’s
initial valuation of YouTube may, indeed, have been highly optimistic. While YouTube continues to be wildly successful in terms of the
number of site visits, with unique monthly visits having increased almost six fold from their 2006 level, it appears to be disappointing at
this juncture in terms of profitability and cash flow. The traffic continues to grow as a result of integration with social networks such as
Facebook and initiatives such as the ability to send clips to friends as well as to rate and comment on videos. Moreover, YouTube is
showing some progress in improving profitability by continuing to expand its index of professionally produced premium content.
Nevertheless, on a stand–alone basis, it is problematic that YouTube will earn Google’s cost of equity. However, as part of a broader
Google strategy involving multiple acquisitions to attract additional traffic to Google and to promote the brand, the purchase may indeed
make sense.
.
Discussion Questions:
1. What alternative valuation methods could Google have used to justify the purchase price it paid for YouTube? Discuss the
advantages and disadvantages of each.
2. The purchase price paid for YouTube represented more than one percent of Google’s then market value. If you were a Google
shareholder, how might you have evaluated the wisdom of the acquisition?
3. To what extent might the use of stock by Google have influenced the amount they were willing to pay for YouTube? How might
the use of “overvalued” shares impact future appreciation of Google stock?
4. What is the appropriate cost of equity for discounting future cash flows? Should it be Google’s or YouTube’s? Explain your
answer.

26
5. What are the key valuation assumptions implicit in the valuation method discussed in this case study?
A REAL OPTIONS’ PERSPECTIVE ON MICROSOFT’S DEALINGS WITH YAHOO
In a bold move to transform two relatively weak online search businesses into a competitor capable of challenging market leader Google,
Microsoft proposed to buy Yahoo for $44.6 billion on February 2, 2008. At $31 per share in cash and stock, the offer represented a 62
percent premium over Yahoo’s prior day closing price. Despite boosting its bid to $33 per share to offset a decline in the value of
Microsoft’s share price following the initial offer, Microsoft was rebuffed by Yahoo’s board and management. In early May, Microsoft
withdrew its bid to buy the entire firm and substituted an offer to acquire the search business only. Incensed at Yahoo‘s refusal to accept
the Microsoft bid, activist shareholder Carl Icahn initiated an unsuccessful proxy fight to replace the Yahoo board. Throughout this entire
melodrama, critics continued to ask how Microsoft could justify an offer valued at $44.6 billion when the market prior to the
announcement had valued Yahoo at only $27.5 billion.
Microsoft could have continued to slug it out with Yahoo and Google, as it has been for the last five years, but this would have given
Google more time to consolidate its leadership position. Despite having spent billions of dollars on Microsoft’s online service (Microsoft
Network or MSN) in recent years, the business remains a money loser (with losses exceeding one half billion dollars in 2007).
Furthermore, MSN accounted for only 5 percent of the firm’s total revenue at that time.
Microsoft argued that its share of the online Internet search (i.e., ads appearing with search results) and display (i.e., website banner
ads) advertising markets would be dramatically increased by combining Yahoo with MSN. Yahoo also is the leading consumer email
service. Anticipated cost savings from combining the two businesses were expected to reach $1 billion annually. Longer term, Microsoft
expected to bundle search and advertising capabilities into the Windows operating system to increase the usage of the combined firms’
online services by offering compatible new products and enhanced search capabilities.
The two firms have very different cultures. The iconic Silicon Valley–based Yahoo often is characterized as a company with a free-
wheeling, fun-loving culture, potentially incompatible with Microsoft’s more structured and disciplined environment. Melding or
eliminating overlapping businesses represents a potentially mind-numbing effort given the diversity and complexity of the numerous sites
available. To achieve the projected cost savings, Microsoft would have to choose which of the businesses and technologies would survive.
Moreover, the software driving all of these sites and services is largely incompatible.
As an independent or stand-alone business, the market valued Yahoo at approximately $17 billion less than Microsoft’s valuation.
Microsoft was valuing Yahoo based on its intrinsic stand-alone value plus perceived synergy resulting from combining Yahoo and MSN.
Standard discounted cash flow analysis assumes implicitly that, once Microsoft makes an investment decision, it cannot change its mind.
In reality, once an investment decision is made, management often has a number of opportunities to make future decisions based on the
outcome of things that are currently uncertain. These opportunities, or real options, include the decision to expand (i.e., accelerate
investment at a later date), delay the initial investment, or abandon an investment. With respect to Microsoft’s effort to acquire Yahoo, the
major uncertainties dealt with the actual timing of an acquisition and whether the two businesses could be integrated successfully. For
Microsoft’s attempted takeover of Yahoo, such options included the following:
Base case. Buy 100 percent of Yahoo immediately.
Option to expand. If Yahoo were to accept the bid, accelerate investment in new products and services contingent on the successful
integration of Yahoo and MSN.
Option to delay. (1) Temporarily walk away keeping open the possibility of returning for 100 percent of Yahoo if circumstances
change, (2) offer to buy only the search business with the intent of purchasing the remainder of Yahoo at a later date, or (3) enter into a
search partnership, with an option to buy at a later date.
Option to abandon. If Yahoo were to accept the bid, spin off or divest combined Yahoo/MSN if integration is unsuccessful.
27
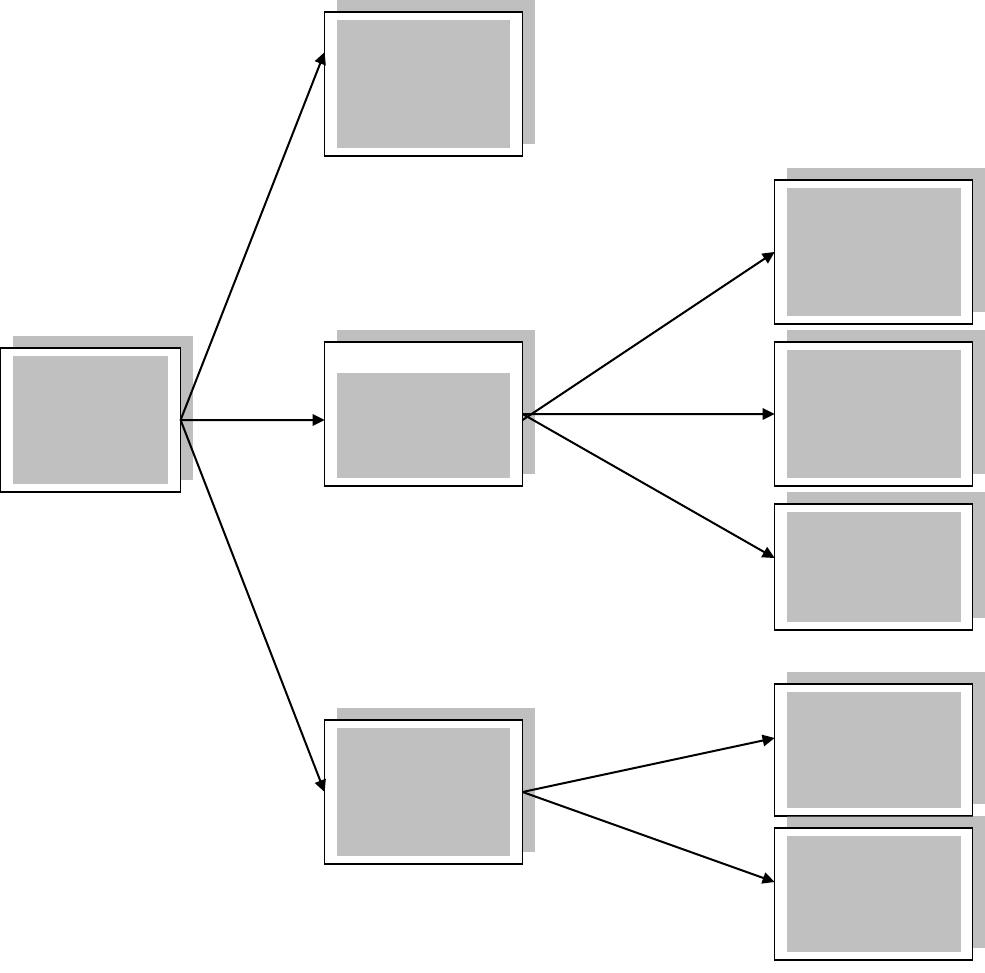
The decision tree in the following exhibit illustrates the range of real options (albeit an incomplete list) available to the Microsoft
board at that time. Each branch of the tree represents a specific option. The decision-tree framework is helpful in depicting the significant
flexibility senior management often has in changing an existing investment decision at some point in the future.
With neither party making headway against Google, Microsoft again approached Yahoo in mid-2009, which resulted in an
announcement in early 2010 of an internet search agreement between the two firms. Yahoo transferred control of its internet search
technology to Microsoft in an attempt to boost its sagging profits. Microsoft is relying on a 10-year arrangement with Yahoo to help
counter the dominance of Google in the internet search market. Both firms hope to be able to attract more advertising dollars paid by
firms willing to pay for links on the firms’ sites.
Base Case:
Microsoft offers
to buy all
outstanding share
of Yahoo
Option to expand
contingent on
successful
integration of Yahoo
and MSN
Option to postpone
contingent on
Yahoo’s rejection of
offer
Option to abandon
contingent on failure
to integrate Yahoo
and MSN
Enter long-term
search partnership
with option to buy.
Offer revised price
for all of Yahoo if
circumstances
change
Spin off combined
Yahoo and MSN to
Microsoft
shareholders
Divest combined
Yahoo and MSN.
Use proceeds to pay
dividend or buy
back stock.
Microsoft Real Options Decision Tree
Purchase Yahoo
online search only.
Buy remaining
businesses later.
Merrill Lynch and BlackRock Agree to Swap Assets
During the 1990s, many financial services companies began offering mutual funds to their current customers who were pouring money
into the then booming stock market. Hoping to become financial supermarkets offering an array of financial services to their customers,
these firms offered mutual funds under their own brand name. The proliferation of mutual funds made it more difficult to be noticed by
potential customers and required the firms to boost substantially advertising expenditures at a time when increased competition was
reducing mutual fund management fees. In addition, potential customers were concerned that brokers would promote their own firm‘s
mutual funds to boost profits.
This trend reversed in recent years, as banks, brokerage houses, and insurance companies are exiting the mutual fund management
business. Merrill Lynch agreed on February 15, 2006, to swap its mutual funds business for an approximate 49 percent stake in money–
manager BlackRock Inc. The mutual fund or retail accounts represented a new customer group for BlackRock, founded in 1987, which
had previously managed primarily institutional accounts.
At $453 billion in 2005, BlackRock’s assets under management had grown four times faster than Merrill’s $544 billion mutual fund
assets. During 2005, BlackRock’s net income increased to $270 million, or 63 percent over the prior year, as compared to Merrill’s 27
percent growth in net income in its mutual fund business to $397 million. BlackRock and Merrill stock traded at 30 and 19 times
estimated 2006 earnings, respectively.
Merrill assets and net income represented 55 percent and 60 percent of the combined BlackRock and Merrill assets and net income,
respectively. Under the terms of the transaction, BlackRock would issue 65 million new common shares to Merrill. Based on BlackRock’s
February 14, 2005, closing price, the deal is valued at $9.8 billion. The common stock gave Merrill 49 percent of the outstanding
BlackRock voting stock. PNC Financial and employees and public shareholders owned 34 percent and 17 percent, respectively. Merrill’s
ability to influence board decisions is limited, since it has only 2 of 17 seats on the BlackRock board of directors. Certain “significant
matters” require a 70 percent vote of all board members and 100 percent of the nine independent members, which include the two Merrill
representatives. Merrill (along with PNC) must also vote its shares as recommended by the BlackRock board.
Discussion Questions:
1. Merrill owns less than half of the combined firms, although it contributed more than one- half of the combined firms’ assets and
net income. Discuss how you might use DCF and relative valuation methods to determine Merrill’s proportionate ownership in
the combined firms.
2. Why do you believe Merrill was willing to limit its influence in the combined firms?
29
3. What method of accounting would Merrill use to show its investment in BlackRock?
Valuation Methods Employed in Investment Bank Fairness Opinion Letters
Background
A fairness opinion letter is a written third-party certification of the appropriateness of the price of a proposed transaction such as a merger,
acquisition, leveraged buyout, or tender offer. A typical fairness opinion provides a range of what is believed to be fair values, with a
presumption that the actual deal price should fall within this range. The data used in this case study is found in SunGard’s Schedule 14A
Proxy Statement submitted to the SEC in May 2005.
On March 27, 2005, the investment banking behemoth Lazard Freres (Lazard) submitted a letter to the board of directors of SunGard
Corporation pertaining to the fairness of a $10.9 billion bid to take the firm private made by an investor group. Lazard employed a variety
of valuation methods to evaluate the offer price. These included the comparable company approach, the recent transactions method,
discounted cash flow analysis, and an analysis of recent transaction premiums. The analyses were applied to each of the firm’s major
businesses: software services and recovery availability services. The software services’ business provides software systems and support
for application and transaction processing to financial services firms, universities, and government agencies. The recovery availability
services business provides businesses and government agencies with backup and recovery support in the event their data processing
systems are disrupted.
Comparable Company Analysis
Using publicly available information, Lazard reviewed the market values and trading multiples of the selected publicly held companies
for each business segment. Multiples were based on stock prices as of March 24, 2005 and specific company financial data on publicly
available research analysts’ estimates for 2005. In the case of SunGard’s software business, Lazard reviewed the market values and
trading multiples of four publicly traded financial services companies and three publicly traded securities trading companies. In the case
of SunGard’s recovery availability services business, Lazard reviewed the market values and trading multiples of the six selected publicly
traded business continuity services (i.e., recoverability services firms) companies. These firms were believed to be representative of these
segments of SunGard’s operations.
Lazard calculated enterprise values for these comparable companies as equity value plus debt, preferred stock, and all out–of-the-
money convertibles (i.e., convertible debt whose conversion price exceeded the merger offer price), less cash and cash equivalents (i.e.,
short-term liquid securities). Estimated enterprise value multiples of earnings before interest, taxes, depreciation and amortization (i.e.,
EBITDA) were created for 2005 by dividing enterprise values by publicly available estimates of EBITDA for each comparable company.
Similarly, price–to-earnings ratios were created by dividing equity values per share by earnings per share for each comparable company
for calendar 2005. See Tables 8-1 and 8.2.
Table 8-1 Enterprise Value Multiples for
Comparable Recovery Availability Companies
Enterprise Value as a Multiple of
EBITDA
Price-to-Earnings
Multiple (P/E)
2005E
2005E
High
9.0x
38.1x
Mean
6.7x
18.2x
Median
6.5x
15.3x
Low
3.8x
12.6x
E = estimate.

30
Based on this analysis, Lazard determined an enterprise value to estimated 2005 EBITDA multiple range for SunGard’s recovery
availability services business of 5.5x to 7.0x. Lazard also determined a 2005 estimated P/E range for this segment of 14.0x to 16.0x.
Multiplying SunGard’s projected EBITDA and earnings per share for 2005 by these ranges, Lazard calculated an enterprise value range
for SunGard’s recovery availability services business of approximately $3.1 billion to $3.7 billion. Financial projections for SunGard
were provided by SunGard’s management.
Table 8-2. Enterprise Value Multiples for Comparable Software Companies
Enterprise Value as a Multiple of
EBITDA
Price-to-Earnings
Multiple (P/E)
High
13.8x
21.5x
Mean
9.7x
18.8x
Median
9.0x
18.1x
Low
7.3x
16.9x
Based on the results in Table 8-2, Lazard determined an enterprise value to estimated 2005 EBITDA multiple range for SunGard’s
software business of 7.5x to 9.5x. Lazard also determined a 2005 estimated P/E range for SunGard’s software business of 17.0 to 19.0x.
Multiplying SunGard’s projected EBITDA and earnings per share for 2005 by these ranges, Lazard calculated an enterprise value range
for SunGard’s software business of approximately $4.3 billion to $5.2 billion.
Lazard then summed the enterprise value ranges for SunGard’s software business and recovery availability services business to
calculate a consolidated enterprise value range for SunGard of approximately $7.4 billion to $8.9 billion. Using this consolidated
enterprise value range and assuming net debt (i.e., total debt less cash and cash equivalents on the balance sheet) of $273 million, Lazard
calculated an implied price per share range for SunGard common stock of $24.20 to $29.00 by dividing the enterprise value less net debt
by the SunGard shares outstanding.
Recent Transactions Method
For the recovery availability services business, Lazard reviewed ten merger and acquisition transactions since October 2001 for
companies in the information technology outsourcing business. To the extent publicly available, Lazard reviewed the transaction
enterprise values of the recent transactions as a multiple of the last twelve months EBITDA for the period ending on the recent transaction
announcement date. See Table 8-3.
Table 8-3. Enterprise Value as a Multiple of Last Twelve Months EBITDA
for Recovery Availability Business
High
10.8x
Mean
7.37x
Median
6.4x
Low
5.4x
Based on Table 8-3, Lazard determined an EBITDA multiple range of 6.5x to 7.5x and multiplied this range by the last twelve months
EBITDA for SunGard’s recovery availability business to calculate an implied enterprise value range of approximately $3.4 billion to $4.0
billion.
Lazard reviewed 21 merger and acquisition transactions since February 2003 with a value greater than approximately $100 million for
companies in the software business. To the extent publicly available, Lazard examined the transaction enterprise values of the recent
transactions as a multiple of EBITDA for the last twelve months prior to the public announcement of the relevant recent transaction. See
Table 8-4.
Table 8-4. Enterprise Value as a Multiple of Last Twelve Months EBITDA
for the Software Business
High
11.6x
Mean
9.8x
Median
9.9x
Low
6.8x

31
Based on the information contained in Table 8-5, Lazard determined an EBITDA multiple range of 9.0x to 11.0x and multiplied this
range by the last twelve month EBITDA for SunGard’s software business to calculate an implied enterprise value range for this business
segment of approximately $5.0 billion to $6.1 billion.
Lazard then summed the enterprise value ranges for SunGard’s software business and recovery availability services business to
calculate a consolidated enterprise value range for SunGard of approximately $8.4 billion to $10.1 billion. Using this consolidated
enterprise value range and assuming net debt of $273 million, Lazard calculated the value per share of SunGard common stock of $27.60
to $32.70 by dividing the estimated consolidated enterprise value less net debt by common shares outstanding.
Discounted Cash Flow Analysis
Using projections provided by SunGard’s management, Lazard performed an analysis of the present value, as of March 31, 2005, of the
free cash flows that SunGard could generate annually from calendar year 2005 through calendar year 2009. Lazard analyzed separately
the cash flows for SunGard’s software business and recovery availability services business.
For SunGard’s software business, in calculating the terminal value, Lazard assumed perpetual growth rates (i.e., constant growth
model) of 3.5% to 4.5% for the projected free cash flows for the periods subsequent to 2009. The projected annual cash flows through
2009 and beyond were then discounted to present value using discount rates ranging from 10.0% to 12.0%. Based on this analysis, Lazard
calculated an implied enterprise value range for the software business of approximately $5.6 billion to $7.4 billion.
For SunGard’s recovery availability services business, in calculating the terminal value Lazard assumed perpetual growth rates of
2.0% to 3.0% for the projected free cash flows for periods subsequent to 2009. The projected cash flows were then discounted to present
value using discount rates ranging from 10.0% to 12.0%. Lazard then calculated an implied enterprise value range for SunGard’s recovery
availability business of approximately $2.6 billion to $3.3 billion.
Lazard then aggregated the enterprise value ranges for SunGard’s two business segments to calculate a consolidated enterprise value
range for SunGard of approximately $8.2 billion to $10.7 billion. Using this consolidated enterprise value range and assuming net debt of
$273 million, Lazard calculated an implied price per share range for SunGard common stock of $26.70 to $34.60.
Premiums Paid Analysis
Lazard performed a premiums paid analysis based upon the premiums paid in 73 recent transactions (not involving “mergers of equals”
transactions) that were announced from January 2004 through March 2005 and involved transaction values in excess of $1 billion. In
conducting its analysis, Lazard analyzed the premiums paid for recent transactions over $1 billion and those over $5 billion, since
premiums paid may vary with the size of the transaction.
The analysis was based on the one day, one week and four week implied premiums for the transactions examined. The implied
premiums were calculated by comparing the offer price for the target firm on the announcement date with the per share price of the target
firm one day, one week, and four weeks prior to the announcement of the transaction. The results of these calculations are given in Table
8-5.
Table 8-5. Premiums Paid Analysis
Greater Than $1 Billion1
Greater Than $5 Billion
1 Day
1 Week
1 Month
1 Day
1 Week
1 Month
High
69.8%
67.8%
80.2%
33.4%
38.3%
44.0%
Mean
23.8%
26.6%
27.0%
15.3%
23.1%
26.2%
Median
21.3%
24.0%
25.7%
13.0%
25.4%
23.7%
Low
(9.5)%2
(8.0)%
(19.6)%
0.0%
(1.2)%
5.4%
1The larger premiums paid for smaller transaction may reflect their potentially higher growth potential .
2Negative premiums may be a result of target firms whose expected financial performance had been
deteriorating during the month prior to the announcement date.
Based on this analysis, Lazard determined an applicable premium range of 20% to 30% for SunGard and applied this range to
SunGard’s share price of $24.95 on March 18, 2005. Using this information, Lazard calculated an implied price per share range for
SunGard common stock of $29.94 (i.e., 1.2 x $24.95) to $32.44 (1.3 x $24.95).
Summary and Conclusions
Table 8-6 summarizes the estimated valuation ranges based on the alternative valuation methods employed by Lazard Freres. Note that
the $36 per offer price compares favorably to the estimated average valuation range, representing a premium of 12% (i.e., $36/$27.11) to
33% (i.e., $36/$32.19). Consequently, Lazard Freres viewed the investor group’s offer price for SunGard as fair.
Table 8-6. Valuation Range Summary
Valuation Method
Valuation Range ($/Common
Share)
(Max. Valuation less Min.
Valuation)/Min. Valuation
Comparable Companies
24.20-29.00
19.8%
Recent Transactions
27.60-32.70
18.5%
Discounted Cash Flow
26.70-34.60
29.6%
Premiums Paid
29.94-32.44
8.4%
Average
27.11-32.19
18.7%
Discussion Questions:
1. Discuss the strengths and weaknesses of each valuation method employed by these investment banks in constructing estimates of
SunGard’s value for the Fairness Opinion Letter. Be specific.
2. Why do you believe that the percentage difference between the maximum and minimum valuation estimates varies so much from
one valuation method to another? See Table 8–7.