2009 2010 2011 2012 2013 2014 2015 2016 2017 2018 2019
Assumptions:
Sales Growth Rate % 0.508 0.450 0.400 0.400 0.400 0.350 0.300 0.250 0.200 0.150 0.100
Operating Margin % of Sales -0.02 -0.01 -0.01 0.02 0.04 0.08 0.1 0.12 0.15 0.15 0.15
Depreciation Exp. % of Sales 0.036 0.034 0.06 0.06 0.06 0.06 0.06 0.07 0.07 0.07 0.06
Marginal Tax Rate %10.4 0.4 0.4 0.4 0.4 0.4 0.4 0.4 0.4 0.4
Net Working Capital % of Sales20.104 0.114 0.100 0.100 0.100 0.100 0.100 0.100 0.100 0.100 0.100
Gross P&E % of Sales30.087 0.050 0.080 0.080 0.080 0.080 0.080 0.070 0.070 0.060 0.060
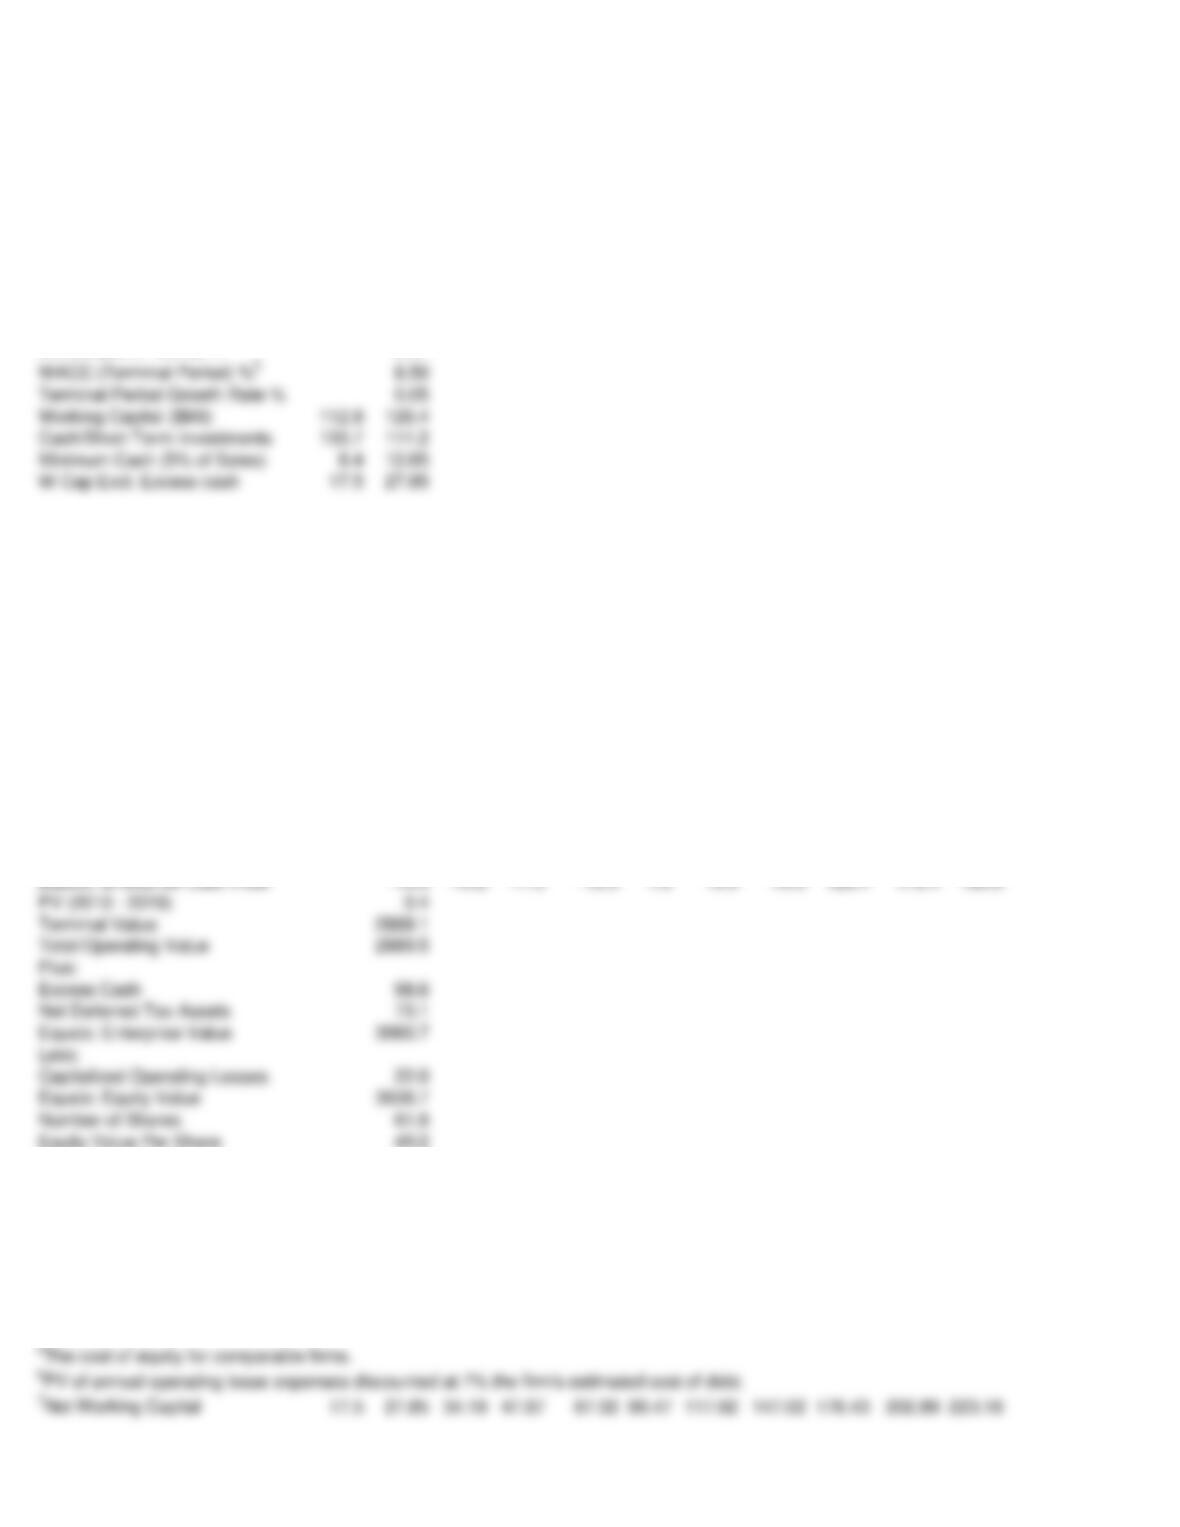
WACC (2010 – 2019) %49.31
WACC (Terminal Period) %58.50
Selected Financial Data ($Mil.)
Sales 168
Depreciation Expense & Amort. 6.1
Net Working Capital 11.2
Gross Plant & Equipment 14.6
Excess Cash 98.55
Deferred Tax Assets 73.1
PV of Operating Leases622.0
Number of Shares Outstanding 61.8
Valuation:
Sales 168.4 244.2 341.9 478.7 670.2 904.7 1176.2 1470.2 1764.3 2028.9 2231.8
EBIIT(1-t) -2.0 -1.5 -2.1 5.7 16.1 43.4 70.6 105.9 158.8 182.6 200.9
Plus: Depreciation & Amort. 6.1 8.6 20.5 28.7 40.2 54.3 70.6 102.9 123.5 142.0 133.9
Minus: Δ Net Working Capital710.4 6.3 13.7 19.1 23.5 27.1 29.4 29.4 26.5 20.3
Minus: Gross P&E Expend. 14.6 10.1 27.4 38.3 53.6 72.4 94.1 102.9 123.5 121.7 133.9
Equity Value Per Share 49.2
Explanatory Notes:
6PV of annual operating lease expenses discounted at 7% the firm’s estimated cost of debt.
5The cost of equity for comparable firms.
3Increases faster than depreciation through 2015 to support growth in 3PAR sales and matches depreciation through
the remainder of the forecast period.
4Cost of equity = 0.0265 + 1.21 (0.055), where 0.0265 is the 10 year Treasury bond at the time of the transacton, 1.21
is 3PAR’s beta, and 0.055 is the market premium. Note the WACC is the firm’s cost of equity as 3PAR has no
Projections
Case Study 7-1 Hewlett-Packard’s Valuaton of 3PAR
2Excludes 3PAR excess cash balances.
1A 40% marginal tax rate is used to reflect the full benefit of the 3PAR deferred tax assets to HP.
long-term debt.