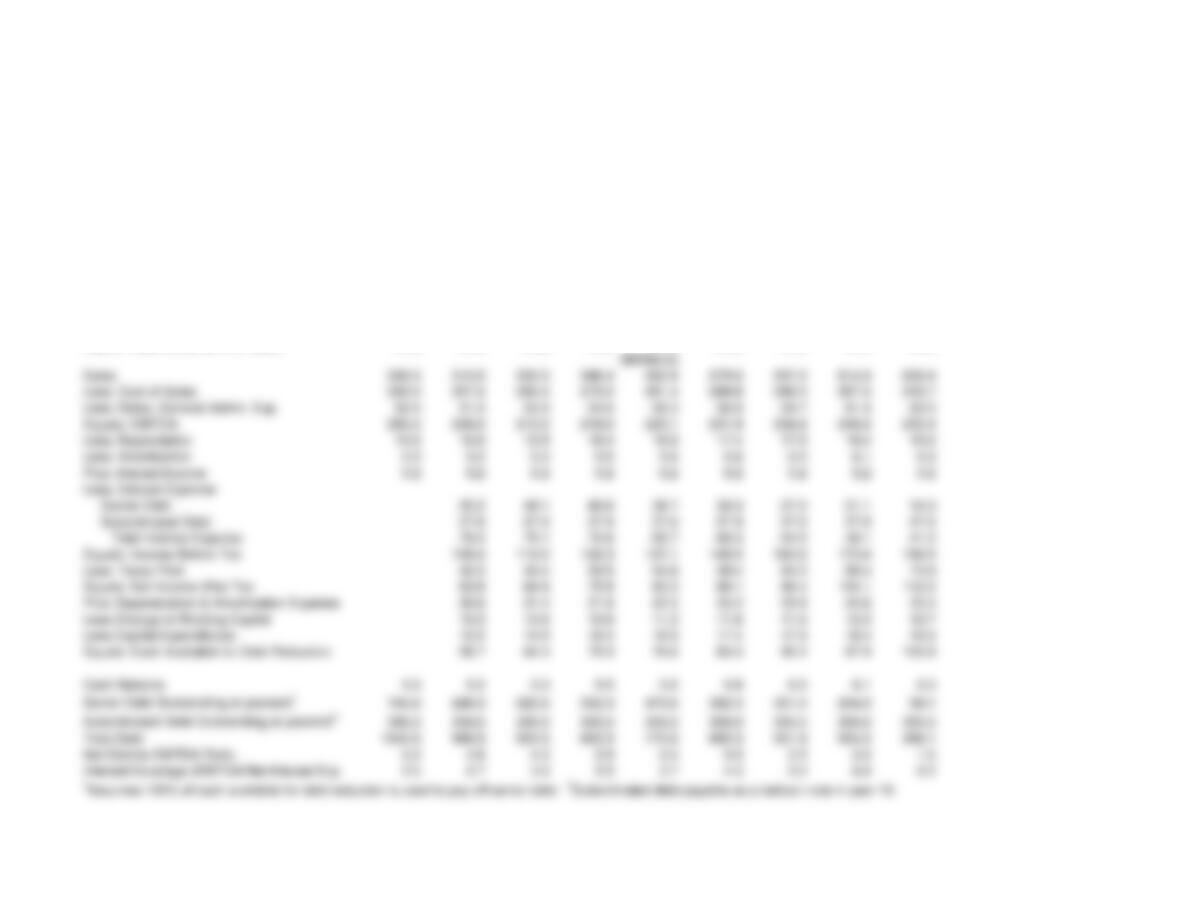
Year 0 Year 1 Year 2 Year 3 Year 4 Year 5 Year 6 Year 7 Year 8
Assumptions:
Sales Growth % 0 1.03 1.03 1.03 1.03 1.03 1.03 1.03 1.03
Cost of Sales (COS) as % of Sales 0.5 0.5 0.5 0.5 0.5 0.5 0.5 0.5 0.5
Sales, General & Admin. Exp. as % of Sales 0.1 0.1 0.1 0.1 0.1 0.1 0.1 0.1 0.1
Depreciation as % of Sales 0.03 0.03 0.03 0.03 0.03 0.03 0.03 0.03 0.03
Amortization as % of Sales 0.01 0.01 0.01 0.01 0.01 0.01 0.01 0.01 0.01
Interest on Cash & Marketable Securities % 0.03 0.03 0.03 0.03 0.03 0.03 0.03 0.03 0.03
Interest on Senior Debt % 0.07 0.07 0.07 0.07 0.07 0.07 0.07 0.07 0.07
Interest on Subordinated Debt % 0.09 0.09 0.09 0.09 0.09 0.09 0.09 0.09 0.09
Tax rate 0.4 0.4 0.4 0.4 0.4 0.4 0.4 0.4 0.4
Cash & Marketable Securities as % Sales 0.01 0.01 0.01 0.01 0.01 0.01 0.01 0.01 0.01
Change in Working Capital as % of Sales 0.02 0.02 0.02 0.02 0.02 0.02 0.02 0.02 0.02
Capital Expenditues as % of Sales 0.03 0.03 0.03 0.03 0.03 0.03 0.03 0.03 0.03
Less: Cost of Sales 250.0 257.5 265.2 273.2 281.4 289.8 298.5 307.5 316.7
Less: Sales, General Admin. Exp. 50.0 51.5 53.0 54.6 56.3 58.0 59.7 61.5 63.3
Less: Depreciation 15.0 15.5 15.9 16.4 16.9 17.4 17.9 18.4 19.0
Less: Amortization 5.0 5.2 5.3 5.5 5.6 5.8 6.0 6.1 6.3
Plus: Interest Income 0.2 0.2 0.2 0.2 0.2 0.2 0.2 0.2 0.2
Less: Interest Expense
Senior Debt 52.2 48.1 43.6 38.7 33.3 27.5 21.1 14.3
Subordinated Debt 27.0 27.0 27.0 27.0 27.0 27.0 27.0 27.0
Less: Taxes Paid 42.5 46.4 50.5 54.8 59.4 64.3 69.4 74.8
Equals: Net Income After Tax 63.8 69.6 75.8 82.3 89.1 96.4 104.1 112.2
Plus: Depareciation & Amortization Expense 20.6 21.2 21.9 22.5 23.2 23.9 24.6 25.3
Less Change in Working Capital 10.3 10.6 10.9 11.3 11.6 11.9 12.3 12.7
Less Capital Expenditures 15.5 15.9 16.4 16.9 17.4 17.9 18.4 19.0
Equals: Cash Avaliable for Debt Reduction 58.7 64.3 70.3 76.6 83.3 90.4 97.9 105.8
Cash Balance 5.0 5.2 5.3 5.5 5.6 5.8 6.0 6.1 6.3
Interest Coverage (EBITDA/Net Interest Exp. 2.5 2.7 3.0 3.3 3.7 4.3 5.0 6.0 6.2
Problem 13-16 Solution to Part A